DETERMINING THE VALUE OF INTEGRATED REPORTING
Preface
The copyright of this thesis rests with the author. The author is responsible for the contents. University of Twente is only responsible for the coaching and cannot be held liable for the content. No part of this publication may be reproduced or transmitted in any form or by any means electronic or mechanical, including photocopying, recording, or by any information storage and retrieval system, without permission in writing from the author. The copyright of the logo on the front page rests with the International Integrated Reporting Council.
Abstract
The research question in this thesis is "What is Integrated Reporting and is it a value increasing practice for DJSI-‐listed European companies?" The first part of this thesis elaborates on the question what Integrated Reporting is and why it is getting a lot of attention at the moment: its power to disclose true value. The content elements and guiding principles behind Integrated Reporting are explained and also is the way they relate to the capitals that a company influences by operating: financial, manufactured, intellectual, human, social and natural. The reason that companies want to engage in Integrated Reporting is among others to communicate value to stakeholders in a more transparent way. Besides communicating with the stakeholders, Integrated Thinking helps companies make strategic choices. A distinction is made between three phases of Integrated Reporting in which companies are currently active. After explaining our view on Integrated Reporting, the empirical part of the thesis uses hypothesis tests regarding the status of Integrated Reporting at the moment, the evolvement of the phenomenon and the influence of Integrated Reporting on financial performance. Using a sample of 260 firms from Dow Jones Sustainability Index Europe, I conclude that IR is gaining popularity in the sample and that companies are working on improving the standards of their reports. However, no evidence was found for value creation. Tobin’s Q and Return On Assets measured financial performance. Despite the lack of empirical evidence for value creation, there are still reasons for companies to seriously consider what the benefits of Integrated Reporting are. Especially when they want to avoid loss of market value, keep their access to the capital market and when they want to be prepared for the future of corporate reporting. This research also emphasizes on the fact that
improvements in the reporting standard are desired.
1
Introduction
1.1 Introduction
In today’s business environment, with a lot of technological changes and increasing expectations by society, companies are constantly monitored. A small misstep can have an immense impact on organizational financial performance. An example of a misstep includes that of BP DeepwaterHorizon’s oil spill that caused $37,2 billion of direct costs and led to a loss in market value of $105 billion. We can also remember the 2008 financial crisis, where the image and profitability of a lot of companies was seriously harmed and are still struggling to regain trust. Times are changing and so is our planet. This is an important reason why the classical role of financial accounting and reporting is not meeting the current requirements of stakeholders anymore. The demand of stakeholders for transparency is also illustrated by cases like that of WikiLeaks.org whereby a lot of sensitive information has been leaked. As a result of the above mentioned facts the landscape of corporate reporting is about to change considerably (Busco, Frigo, Quattrone & Riccaboni, 2013).
In order to prevent situations that destroy value in companies, companies tend to report in a more transparent way. Environmental reporting started in the 1980's and has evolved to extensive Sustainability Reporting and several mandatory standards supplemented with voluntary guidelines (e.g. Global Reporting Initiative guidelines). Problems with those standards include the facts that there is no clear relation with financial reporting, the size of the reports result in stakeholders getting an information overload and do not know where to focus on any more.
1.3 Research questions
The first part of this thesis is descriptive and maps the topic of Integrated Reporting with the content elements and interpretation, presumed benefits and reasons for using Integrated Reporting. The second part of the research tests hypotheses about developments and effects of Integrated Reporting on a sample of 260 sustainable firms from the Dow Jones Sustainability Index Europe (DJSI Europe) between the years 2011 and 2013. Some of these firms use a form of Integrated Reporting (37,5%). Based on existing literature on information asymmetry, voluntary disclosures, Integrated Reporting, and also management literature and information from IIRC, GRI, among others, the following research question has been formulated:
“What is Integrated Reporting and is it a value-‐increasing practice for DJSI-‐
listed European companies?”
The following sub-‐questions have to be answered to be able to give a proper answer to that question:
i. Why do listed firms produce annual, sustainability and integrated reports?
ii. What are Sustainability, Sustainability Reporting and Corporate Social Responsibility and why are they important?
iii. What are the benefits of Integrated Reporting, what are the contents of Integrated Reports and what are the differences between Integrated Reports?
iv. What are determinants of value in listed firms and how are they measured?
v. Is there a tendency towards Integrated Reporting?
vi. Is Integrated Reporting more than a buzzword and will it continue to develop in the near future?
vii. Do companies that use Integrated Reporting in our sample perform better than those that do not?
Phase D finalizes the study and gives interpretations of the findings from the theory. The same applies to the results from the data. The research question can be answered and the consequences of this study on the topic of Integrated Reporting are discussed. Furthermore, Phase D gives advice to (potential) practitioners and academics that are
process. A practical example of why they should do this is to avoid claims against the company, or to keep up their positive brand image. Stakeholder management requires, and this is key, simultaneous attention to the interests of all stakeholders. This does not mean that all stakeholders should be involved in all processes and decisions equally, but their interests should be weighted (Donaldson & Preston, 1995; Perrini & Tencati, 2006).
It seems like there is a negative relation between the quality of voluntary disclosures and the cost of capital. The first reason for this relation is that greater disclosure is supposed to increase investors’ awareness of the existence and image of the firm, and thereby is enlarging its investor base. In this case, risk sharing reduces the cost of capital. Secondly, higher quality disclosures decrease the covariance of a firm’s cash flows compared to those of other firms. This reduces beta, and therefore also the cost of equity capital. Similarly, information asymmetry is reduced among investors or between managers and investors. Finally, when a firm adapts low standards in disclosure, and some investors are less willing to trade, information asymmetry increases the bid-‐ask spread and transaction costs. The result of this is a higher required rate of return or cost of equity capital (Coller & John, 1997; Healy & Palepu, 2001; Clarkson et al., 2008; Hillier, et. al., 2010; Dhaliwal, Tsang & Yang, 2011).
2.2 The emergence and importance of Sustainability and Sustainability Reporting
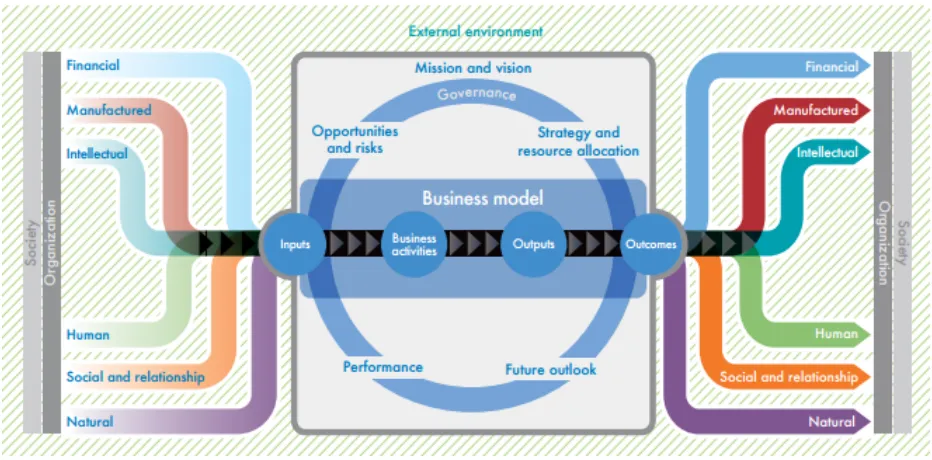
Figure 1: IIRC's organizational value creation model (source: IIRC, 2013a).
Figure 1 shows the value creation process with the several capitals that an organization influences (financial, manufactured, intellectual, human, social and relationship, natural) and the business model with factors that influence the inputs and outputs of the business process on the organization and society as a whole. The IIRC also provides us with several content elements that are related to those capitals. These elements are guided by the guiding principles. The guiding principles and content elements are conducted after running the pilot programme by the IIRC and are essential to understanding Integrated Reporting. The guiding principles and content elements are as stated below:
Guiding principles (IIRC, 2013b)
-‐ Connectivity of information: An integrated report should show a holistic picture of
the combination, interrelatedness and dependencies between the factors that affect the organization’s ability to create value over time
-‐ Stakeholder relationships: An integrated report should provide insight into the
orientation, the connectivity of information and the capitals and their interdependencies (see figure 1). Integrated thinking within the whole organization is hereby encouraged. IR aims at improving the quality of information for investors so that capital can be allocated more efficient and productive. It also encourages a more efficient approach to corporate reporting so that all the factors that affect the ability of an organization to create value can be communicated. Furthermore, it enhances accountability and stewardship for the broad base of the capitals mentioned by the IIRC, and promotes understanding of their relationships. Lastly, it supports integrated thinking, decision-‐ making and actions that focus on creating value over short, medium and long term.
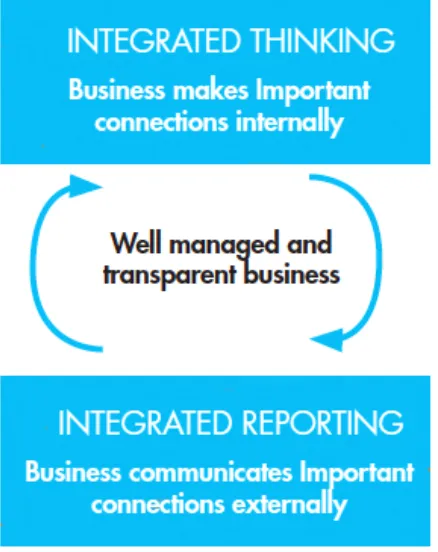
Integrated thinking (see figure 2) will help a company to create value over time, considering the several capitals, capacity of the organization to respond to key stakeholders needs and interests, tailor the business model and competitive strategy, ultimately fostering corporate financial performance and other capitals (IIRC, 2013b). The mechanisms of voluntary disclosure are likely to apply to both financial and non-‐ financial disclosures, as long as the information is (value) relevant. If Integrated
Reporting indeed produces value relevant information, the effects should be measurable.
Bohlhoff and Starnitzky articulate the power of Integrated Reporting in The Guardian Professional;
“Integrated Reporting is more than just merging financial and non-‐financial information. It is the outcome of an organizations integrated thinking and makes it possible to disclose true value (Bohlhoff & Starnitzky, 2014). "
2.4 Relationship between Integrated Reporting and Sustainability Reporting
It is expected that Integrated Reporting will lead to more value creation than Sustainability Reporting on itself. There are some similarities between the two but also important differences. The reason that Integrated Reporting might be superlative to sustainability reporting is described in the following description from the Global Reporting Initiative (GRI):
“Sustainability reporting is a process that assists organizations in setting goals, measuring performance and managing change towards a sustainable global economy – one that combines long term profitability with social responsibility and environmental care. Sustainability reporting – mainly through but not limited to a sustainability report – is the key platform for communicating the organization’s economic, environmental, social and
governance performance, reflecting positive and negative impacts.
Integrated reporting is an emerging and evolving trend in corporate reporting, which in general aims primarily to offer an organization’s providers of financial capital with an integrated representation of the key factors that are material to its present and future
value creation.
Jaffe & Jordan, 2010). Another way is to increase the liquidity of the equity. When equity is liquid, the costs of selling and buying are lower. Brokerage fees determine the cost to trade, together with the bid-‐ask spread and market impact costs.
An important distinction to make between the measures of performance is based on the book value or the market value of the assets. Book value of assets (as used in financial accounting) is the amount of assets that are accounted for in the accounts of a company. Companies depreciate their assets in a particular way because of IFRS and General Accepted Accountancy Principles (GAAP). This value can differ from the actual replacement costs of those assets, which is the first source of differences in book value and market value. The growing importance of intangible assets is a second source of differences between book values and market values. The efficient market hypothesis (EMH) tells us 'the market is always right' (Hillier et al., 2010). Therefor, in this study market value will be the dominant measure for organizational performance. The proxy used for market value in this thesis is measured with Tobin's Q.
2.7 Empirical evidence on voluntary disclosure and value creation
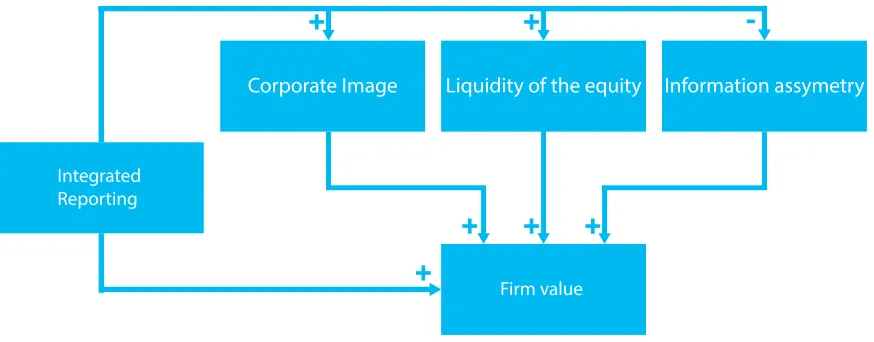
Figure 3: Research model. It is expected that Integrated Reporting causes an increase in corporate image, an increase in the liquidity of the equity and a reduction in the information asymmetry between managers and stakeholders. This will contribute to firm value. However, there may be more variables that have a positive or negative influence on firm value; hence the direct connection between Integrated Reporting and Firm value.
Integrated Reporting
Firm value
Corporate Image Liquidity of the equity Information assymetry
+ +
-+ + +
3
Research design
The theoretical framework answers sub-‐question i till iv and treats among others the question why companies produce financial and non-‐financial disclosures and what corporate sustainability is. A clear and extensive description on the capitals, content elements and guiding principles that are essential to really understand Integrated Reporting is given and finally it explained the choice for Tobin's Q as a proxy for firm value. Empirical evidence for sustainability and value creation is also presented, which led to a conceptual research model. The research design is Phase B of this study and it explains the design of the empirical part of this study. The aim of the empirical part is answering sub-‐question v till vii and thereby giving an indication about the use and growth of Integrated Reporting in the last couple of years and to test the effects of Integrated Reporting on financial performance.
In this study Tobin’s q is used as a proxy for firm value because it makes comparison across firms easier than comparison with for example stock returns or accounting measures (Lo & Sheu, 2007. p. 351). It is based on market value, which is the most accurate estimate of a company's value because all information is reflected and it incorporates future cash flows. This is a more reliable estimate than looking backwards at firm profitability with accounting based views like on return on investment or return on assets. In this longitudinal study, results of three years are used to measure the effects of IR, namely 2011, 2012, and 2013. It would have been possible to use an even longer time frame but going back in time further would mean even more immature Integrated Reporting so it would not complement this study.
firms. Concluding Lo & Sheu showed a positive relation between corporate sustainability and firm value, which our research also explores on the appliance of Integrated Reporting and firm value. A disadvantage of Lo & Sheu’s method is that they do not distinguish between the qualities of the reports.
It would also be very interesting to look into future outlook in the form of cash flow prediction like Clarkson et al. (2011) or cost of capital with a dividend discount model but unfortunately the data was unavailable for this sample. Using a proxy like cost of capital would help in gaining insight in the process of value creation, when there is a significant difference between corporate performance between IR and non-‐IR firms. 3.1 Self-‐constructed index
3.2 Data sources & sampling; Dow Jones Sustainability Index Europe
In this thesis a sample of Sustainable firms is used to isolate the Integrated Reporting effects on performance. The assessment of Sustainability can be done in several ways, namely via integrated assessment (combination of several analysis; for instance risk analysis and environmental impact analysis), product-‐related assessment (product material flow analysis, product energy analysis) or via indices and indicators (Ness, Urbel-‐Piirsalu, Anderberg & Olsson, 2007). Due to reasons of simplicity and accuracy there was chosen to use one of the top Sustainability indices in the world: RobecoSAM's Dow Jones Sustainability Index.
The sample in this study is based on RobecoSAM's European version of Down Jones Sustainability Index (see Figure 4). Selection of firms is done according to the dimensions of the RobecoSAM; these companies are constantly monitored by an extensive methodology applied by them. The dimensions are Economic (33%), Environment (33%) and Social (33%) and include corporate governance, financial robustness, environmental policy / performance / reporting, corporate citizenship, labour practice indicator and others. The companies in our sample are the top 10% performers in their industry. Given RobecoSAM her reputation it is assumed that these companies are indeed sustainable.
Access to the data from RobecoSAM was gained. The data from RobecoSAM / Dow Jones Sustainability Index Europe from 2011-‐2013 was used in this study. The financial data and industry codes are imported using the Orbis (Bureau van Dijk) database. The advantage of using a sustainable sample is that it is possible to isolate the effects of Integrated Reporting. The disadvantage of this method is that the selection of the sample is non-‐random, since the top sustainability performers are selected. This means the study will deal with problems regarding to external validity (De Veaux, Velleman & Bock, 2012). An advantage of using Orbis database is its reputation to be accurate and is therefor used as an important resource for (academic) researchers.
Within this sample there are companies using a form of Integrated Reporting (approximately 37,5%). There are 100 companies in the pilot of the IIRC, but not all companies using Integrated Reporting use the IIRC standards or are available at their website. To solve this problem all the annual reports were downloaded and read. While reading the phase of Integrated Reporting was determined (if integrated at all).
3.3 Sample
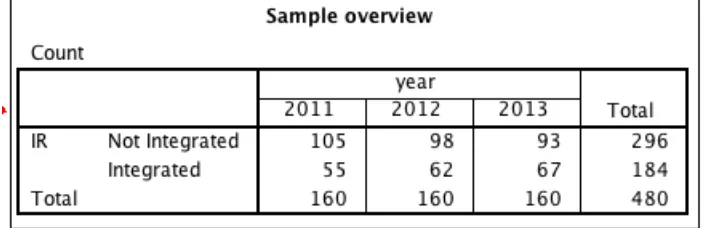
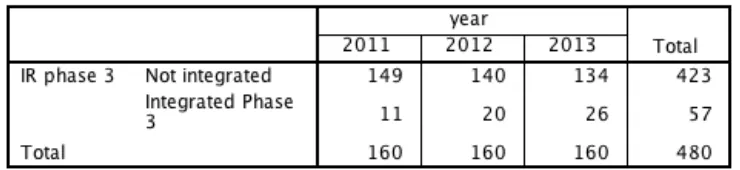
After deleting companies with missing values, the sample included 160 European sustainable companies from the DJSI Europe as can be seen in table 1. The time frame is 3 years and the data of 2011, 2012 and 2013 is used. Of the 480 observations 37,5% were Integrated Reports as can be seen in table 2. Europe was chosen because of reasons for comparability and the fact that 58% of the participants in the Pilot Programme are European (IIRC 2013c).
Table 2: Sample overview Integrated Reporting Phase 3 by year
3.4 Operationalization of variables in the model
The selection and operationalization of the variables used in this study is done based on previous empirical work and the literature search. These variables are frequently used in existing literature and are presumed to have a correlation with our dependent variables (see: Lo & Sheu (2007); Fauver & Naranjo, (2010); Sierra-‐Garcia, Zorio-‐Grima & Garcia-‐Benau (2013); among others). All variables were used in one or more tests of the analysis of the data.
Dependent variable for firm performance 1: Tobin's Q
The financial market usually assesses the value of a firm based on its future profitability (Lo & Scheu, 2007). Under the assumption of a perfect capital market, the best available and unbiased measurement of firm performance and valuation is based on Tobin’s Q. It was decided to follow the efficient market hypothesis this use this as the primary measure for firm value.
Tobin’s Q is calculated by; market value of equity plus book value of assets minus the book value of equity divided by the book value of assets (Fauver & Naranjo, 2010).
𝑇𝑜𝑏𝑖𝑛!𝑠 𝑄 = !"#$%& !"#$% !" !"#$%&!!""# !"#$% !" !""#$"!!""# !"#$% !" !"#$%&
!""# !"#$% !" !""#$"
Dependent variable for performance 2: Return on assets (ROA)
3.5 Hypotheses
The hypotheses that help answering sub-‐question v till vii are formulated as follows: H1. The amount of Integrated Reporting in the sample is increasing.
H2. The companies using Integrated Reporting are getting more advanced in their Integrated Reporting.
H3a. IR companies have higher Tobin’s Q than other DJSI Europe companies.
H3b. IR companies have higher Return On Assets (ROA) than other DJSI Europe companies.
H4a. Firms with more advanced Integrated Reporting have higher Tobin's Q than firms with less advanced levels of Integrated Reporting.
H4b. Firms with more advanced Integrated Reporting have higher ROA than firms with less advanced levels of Integrated Reporting.
4
Data analysis
This is Phase C of the thesis, which answers sub-‐questions v till vii. The questions are answered by testing the hypotheses formulated in phase B. The control variables from the research design are considered in the hypotheses tests. Based on the answers on the sub-‐questions the main research question is answered in the conclusions and discussion part.
Sub-‐questions to be answered in this part:
v. Is there a tendency towards Integrated Reporting?
vi. Is Integrated Reporting more than a buzzword and will it therefor continue to develop in the near future?
vii. Do companies that use Integrated Reporting in our sample perform better than those that do not?
4.1 Assumptions
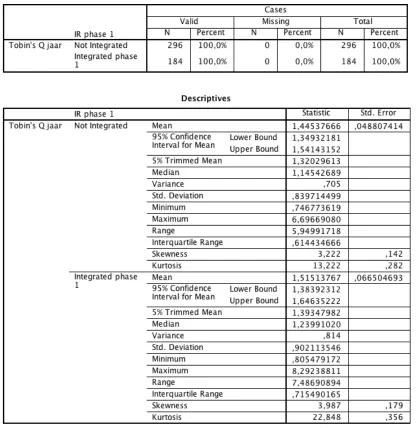
Prior to statistical analysis the data first the assumptions have to be checked to decide which test is appropriate. Many of the statistical procedures used in the literature are based on parametric tests; based on the normal distribution (Field, 2009; De Veaux et al., 2012). The assumptions for parametric tests are that the data is normally distributed (Saphiro-‐Wilk test, normal distribution if p < 0,5), that there is homogeneity of variance (Levene's test) and that the data measurements are independent and are measured at least at interval level. Table 3 shows some descriptives that help decide whether or not parametric tests can be used.
Table 3: Sample descriptives
regression analysis to see if it would produce any significant output which was not the case.
4.2 The tendency towards and the evolvement of Integrated Reporting With a quick overview of the distribution of Integrated Reporting phases in the sample immediately enough information is available to answer the first two hypotheses: H1. The amount of Integrated Reporting in the sample is increasing.
H2. The companies using Integrated Reporting are getting more advanced in their Integrated Reporting.
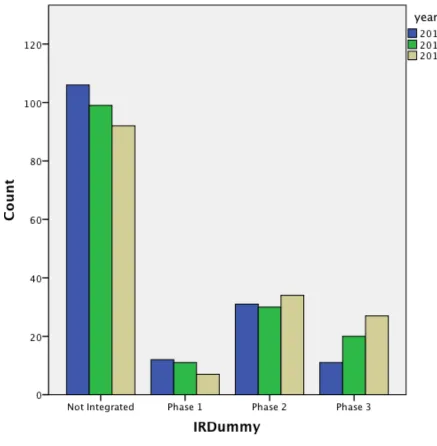
To illustrate the data used in answering hypothesis 1 and 2 figure 5 is produced. The first thing that is notable is the fact that the amount of companies not using Integrated Reporting has declined every year in the sample. This is in line with the literature study and gives enough reason to accept hypothesis one: there is enough evidence to state that the amount of companies using Integrated Reporting in the sample is increasing. If this tendency continues, most companies in the sample will be using a form of Integrated Reporting within 10 years.
The increase in phase 3 of Integrated Reporting tells that companies are also getting more advanced in Integrated Reporting. Companies reporting in phase 1 have decreased which suggest companies are advancing to the next phases; and the amount of
companies in phase 2 have also increased. Those companies might transition from phase 2 to phase 3 in the future; which is a common sign that was detected in this sample. All together, it is expected that the development of Integrated Reporting is still in an early phase. The development over the next years will be crucial; if companies lose faith in the usefulness they might abandon Integrated Reporting. However, the tendency seems to be in favor of Integrated Reporting and that is why it is expected that Integrated Reporting is going to gain ground in the next decade.
Figure 5: Phases of IR by Year
4.3 Linking Integrated Reporting to financial performance
To answer the last research question concerning the financial performance of
companies using Integrated Reporting the following hypotheses are tested with more sophisticated statistical techniques:
H3a. IR companies have higher Tobin’s Q than other DJSI Europe companies.
H4a. Firms with more advanced Integrated Reporting have higher Tobin's Q than firms with less advanced levels of Integrated Reporting.
H4b. Firms with more advanced Integrated Reporting have higher ROA than firms with less advanced levels of Integrated Reporting.
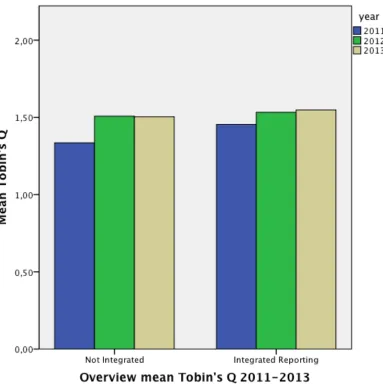
Figure 6: Overview mean Tobin's Q 2011-‐2013
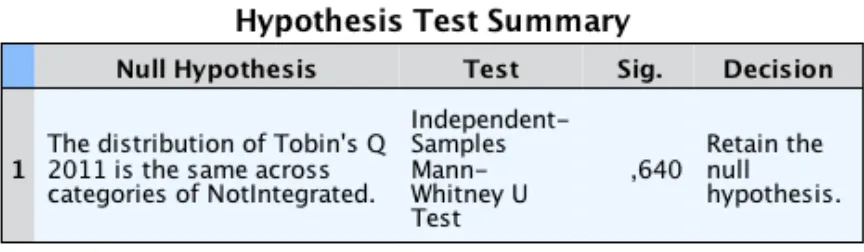
the distribution. Significance levels of the Mann-‐Whitney U test range from .138 until .737, so even at an arbitrary alpha of 10% (α = .10) the null hypothesis cannot be rejected; using ANOVA and regression (although the assumptions were not completely fulfilled) led to the same conclusion. The effects of Integrated Reporting were tested in 3 years; 2011, 2012, 2013. For all of those years no significant variations within the
sample were found. To improve the power of the test a bivariate dummy for Integrated Reporting that only separated IR and non-‐IR companies instead of distinguishing between phases of Integrated Reporting is also used. This still led to the same
conclusion to retain the null hypothesis. The decision for all hypothesis 3 and 4 was thus to retain the null hypothesis. Examples of SPSS output include:
Table 4: Tobin's Q 2013 and IR-‐phases
5
Conclusions and discussion
5.1 Conclusions
The research question in this thesis was: "What is Integrated Reporting and is it a value-‐ increasing voluntary disclosure practice for DJSI-‐listed European companies?" The literature review gave insight in how and why companies are involving in Sustainability Reporting and in the motives for and benefits of Integrated Reporting. Phase A gives an answer to the first part of the research question: "What is Integrated Reporting?”
Integrated reporting is a new form of voluntary disclosure that helps companies disclose true value. The content of Phase A of the thesis helps in understanding the content of Integrated Reports and the guiding principles that are used when preparing and interpreting Integrated Reports and understanding the whole Integrated Reporting phenomenon. After analyzing the collected data from RobecoSAM's Dow Jones
Sustainability Index Europe hypothesis 1 and 2 were confirmed: companies are more and more involving in Integrated Reporting and the extent to which they are giving information and the way they present their information is evolving. If the detected sign continues in the same pace most of the companies will be publishing an advanced Integrated Report within 10 years. This suggests that Integrated Reporting is not just a buzzword, in all sectors and leading companies within the sectors Integrated Reporting is used more every year.
The literature review gave us some indications on why Integrated Reporting could create value. However, in an attempt to answer the second part of the research question: "Is Integrated Reporting a value increasing voluntary disclosure practice?" evidence for hypothesis 3 and 4 was not found within this sample. Studying 480 financial reports of the top sustainability performers in Europe made it clear that companies in the sample are not in an advanced stadium of integratedness at the moment. This might have an influence on our conclusions. The finding that companies are not in an advanced
In the sample there are only 19 companies that are in phase 3 of Integrated Reporting, which is the most advanced and transparent stage. These companies showed not to be different in financial performance. This also applies at companies reporting in other stages of Integrated Reporting.
5.2 Discussion
As humans are known to resist change since decades, there are opponents to Integrated Reporting. Those opponents include entrepreneurs, managers, accountants and
academics (Coch & French, 1948; Flower, 2014). Known complaints are: it will only cost me money; this is only for large companies; disclosing information hurts my competitive position, an Integrated Report is just a combination of a Sustainability Report and a Financial Report. We hope that people that have those complaints will read this report and give Integrated Reporting a serious consideration. This is because we have seen that there are a lot of advantages to Integrated Reporting.
In this thesis we focused on Integrated Reporting from the perspective of managers, owners and investors in listed companies. The presumed advantage is however not just for large and listed firms, since medium and small enterprises might also benefit from Integrated Reporting. The same benefits of transparency apply when SME's need a loan from a bank for instance; if they are able to communicate how they intend to create value of the small, medium and long-‐term banks will be more willing to invest (more) in their corporations. Drs. de Brie, managing director of Rabobank Enschede-‐Haaksbergen, also acknowledged this presumed benefit at the Symposium on Integrated Reporting in Enschede, 11th of September 2014. Integrated Reporting may have no measurable financial benefits at the moment but it might have within a few years, and the early adopters will benefit from being prepared for the future and having a seat on the table while the framework is being developed.
gain popularity and importance in the near future. There are however some
shortcomings in the IR framework that make Integrated Reporting quite open-‐ended. Those open ends include the lack of key performance indicators, sustainability
guidelines and auditing. This makes the Integrated Report as transparent as a company might like and therefore vulnerable for signaling purposes and manipulation. Stated otherwise: "the potential for strategic disclosure from the part of management is high (Eccles & Serafeim, 2014)".
Based on this report, Integrated Reporting is advised only to companies that have sincere motives for being more transparent and sustainable. Integrated thinking will help them in making corporate decisions and communicating with stakeholders. This might also include a perceived friendliness to interested security analysts (especially interesting for low profile companies). In this case information asymmetry between informed and uninformed investors is reduced (Hillier et al., 2010). Companies
implementing Integrated Reporting for pure financial reasons or signaling will probably fail to achieve their objectives. Especially when they get caught hiding value relevant information. They will risk being perceived as untrustworthy, which will certainly have a negative impact on firm value (Bachoo, Tan & Wilson, 2013). Using Integrated
Reporting for signaling motives only is therefor not advised.
6
References
Association of Chartered Certified Accountants (2014). Call for research proposals:
Integrated Reporting. Retrieved March 21, 2014, from
https://www.caaa.ca/_files/file.php?fileid=fileOBtrgNapMM&filename=file_CFP_IR.pdf
Babbie, E. R. (2012). The practice of social research. Belmont: Wadsworth Publishing Company.
Bachoo, K., Tan, R., & Wilson, M. (2013). Firm Value and the Quality of Sustainability Reporting in Australia. Australian Accounting Review, 23(1), 67-‐87.
Barney, J., Wright, M., & Ketchen, D. J. (2001). The resource-‐based view of the firm: Ten years after 1991. Journal of Management, 27(6), 625-‐641.
Black Sun (2012). Understanding Transformation: building the business case for Integrated Reporting. Retrieved March 20, 2014, from http://www.theiirc.org/resources-‐ 2/other-‐publications/building-‐the-‐business-‐case-‐for-‐integrated-‐reporting.
Bohlhoff, M., & Starnitzky, T. (2014) Integrated Reporting is worth more than the sum of its parts. Guardian Professional. Retrieved April 2014, from http://gu.com/p/3pfqq.
Botosan, C. A. (1997). Disclosure level and the cost of equity capital. Accounting Review, 72(3), 323-‐349.
Botosan, C. A., & Plumlee, M. A. (2005). Assessing alternative proxies for the expected risk premium. Accounting Review, 80(1), 21-‐53.
Busco, C., Frigo, M. L., Quattrone, P., & Riccaboni, A. (2013). Redefining corporate accountability through integrated reporting. Strat Finance, 8(August), 33-‐41.
Appendix A: Integrated Reporting Index
(A) Guiding principles: Score
1. Strategic focus / future orientation 1 2 3 2. Connectivity of information 1 2 3
3. Stakeholder relationships 1 3 3
4. Materiality 1 2 3
5. Conciseness 1 2 3
6. Reliability / completeness 1 2 3 7. Consistency / comparability 1 2 3
Sub-‐total (A):
(B) Content elements Score
1. Organizational overview / external environment 1 2 3
2. Governance 1 2 3
3. Business model 1 2 3
4. Risks / opportunities 1 3 3 5. Strategy / resource allocation 1 2 3
6. Performance 1 2 3
7. Outlook 1 2 3
8. Basis of presentation
Sub-‐total (B):
Total (IRindex)
Explanation guiding principles (A)
business model and future performance?
8. Basis of presentation: How does the organization determine what matters to include in the integrated report and how are such matters quantified or evaluated?