Technical Article
Visualization of primordial germ cells in vivo
using GFP-nos1 3’UTR mRNA
TAIJU SAITO*
,1, TAKAFUMI FUJIMOTO
2, SHINGO MAEGAWA
3, KUNIO INOUE
4, MINORU TANAKA
5,
KATSUTOSHI ARAI
2and ETSURO YAMAHA
11Nanae Fresh-Water Laboratory, Field Science Center for Northern Biosphere, Hokkaido University, Nanae, Japan, 2Laboratory of
Breeding Science, Graduate School of Fisheries Sciences, Hokkaido University, Hakodate, Japan, 3Department of Biology, University of
Pennsylvania, Philadelphia, USA, 4Department of Biology, Faculty of Science, Kobe University, Kobe, Japan and 5Laboratory of
Molecu-lar Genetics for Reproduction, National Institute for Basic Biology, Okazaki, Japan
ABSTRACT In some teleost fish, primordial germ cells (PGCs) inherit specific maternal cytoplas-mic factors such as vasa and nanos 1 (nos1) mRNA. It has been shown that the 3’untranslated regions (UTRs) of vasa and nos1 have critical roles for stabilization of these RNAs in zebrafish PGCs. In this study, to determine whether this role of the nos 1 3’UTR is conserved between teleost species, we injected artificially synthesized mRNA, combining green fluorescent protein (GFP) and the zebrafish nos 1 3’UTR (GFP-nos 1 3’UTR mRNA), into the fertilized eggs of various fish species. The 3’UTR of the Oryzias latipes vasa homologue (olvas ) mRNA was assayed in the same manner. We demonstrate that the PGCs of seven teleost species could be visualized using GFP-nos 1 3’UTR mRNA. GFP-olvas 3’UTR mRNA did not identify PGCs in herring or loach embryos, but did enable visualization of the PGCs in medaka embryos. Our results indicate that the 3’UTR of the zebrafish nos1 mRNA can promote maintenance of RNAs in the PGCs of different fish species. Finally, we describe and compare the migration routes of PGCs in seven teleost species.
KEY WORDS: primordial germ cell (PGC), nanos1, vasa, migration, visualization
Introduction
Primordial germ cells (PGCs) are cells that differentiate into gametes, forming sperm in males and eggs in females. In many animals, PGCs migrate during embryonic development from the position where they are specified toward the genital ridge (re-viewed by Molyneaux and Wylie, 2004). Their developmental properties make them an attractive system for studying cell fate specification, differentiation and migration (reviewed by Raz, 2002). Many of the studies of PGC differentiation have been carried out in Drosophila because of the availability of suitable mutations for genetic analyses. Recently, large-scale mutation analyses have been performed using zebrafish and medaka with the result that many mutations affecting PGC migration have been isolated (Raz, 2003; Sasado et al., 2004). Comparative studies between species, however, are also important for a more com-plete understanding of the properties of PGCs. Thus it is neces-sary to have a description of the developmental dynamics of PGCs in a wide variety of species.
Recently, PGCs have received considerable attention as use-ful materials in the preservation of genetic resources and for
*Address correspondence to: Dr. Taiju Saito. Nanae Fresh-Water Laboratory, Field Science Center for Northern Biosphere, Hokkaido University, Nanae, 041-1105, Japan. Fax: +81-138-65-2239. e-mail: taiju@hokudai-nanae.jp
Abbreviations used in this paper: GFP, green fluorescent protein; PGC, primordial germ cell; UTR, untranslated region.
0214-6282/2006/$25.00
© UBC Press Printed in Spain
www.intjdevbiol.com
developmental technology as they can provide gametes from germ-line chimeras (Ciruna et al., 2002; reviewed by Saito and Yamaha, 2004; Yoshizaki et al., 2004). Gametes derived from donor PGCs have been obtained from the recipient host following intraspecies transplantation of blastomeres (Lin et al., 1992; Wakamatsu et al., 1993). Sperm derived from rainbow trout PGCs have been obtained from masu salmon as the surrogate host together with the host sperm (Takeuchi et al., 2004). Moreover, transplantation of embryonic grafts containing goldfish PGCs into the blastoderm of host embryos resulted in the recovery of fertility in sterile goldfish x common carp hybrids (Yamaha et al., 2003). Consequently, only sperm derived from the donor goldfish PGCs were obtained in these chimeras. In this context, interspecies germ line chimeras will be useful for a range of applied technolo-gies. It will be essential therefore to be able to visualize PGCs in a large variety of species in order to ensure selection of viable PGCs for transplantation.
artificial mRNAs constructed by fusing a green fluorescent protein (GFP) sequence to either the 3’UTR of zebrafish nos1 or the 3’UTR of Oryzias latipes vasa homologue (olvas) (Köprunner et al., 2001; Kurokawa et al., 2006). PGCs have also been visualized in several salmonid species following microinjection of similar mRNA constructs into fertilized eggs, for example vasa-3’UTR RNA into eggs of the rainbow trout, Nibe croaker (Nibea mitsukurii) and zebrafish (Yoshizaki et al., 2005). Although this is a simple method for observation of PGC dynamics during early develop-ment, it is not known how widely the function of these sequences is conserved between fish species. To address this, GFP-nos1 3’UTR mRNA or GFP-olvas 3’UTR mRNA was injected into a variety of fish species in this study. If the 3’UTR of the zebrafish nanos gene is functional, it is anticipated that the PGCs will be labeled by GFP in the injected embryos as occurs in zebrafish embryos. To investigate the relationship between phylogenetic distance and function of the 3’UTR of zebrafish nanos gene, we compared seven teleost species. The species analyzed were chosen such that the main clades of the phylogenetic tree of the Clupeocephala were covered: Clupeiformes (herring, Clupea pallasii), Cypriniformes (zebrafish, Danio rerio; pearl danio, Danio
albolineatus; goldfish, Carassius auratus; loach, Misgurnus anguillicaudatus), Beloniformes (medaka, Oryzias latepis) and Perciformes (ice goby, Leucopsarion petersii). Similarly, GFP-olvas 3’UTR mRNA was microinjected into fertilized eggs of the loach, zebrafish and medaka. In this study, we describe the developmental effects of microinjection of the mRNA and addi-tionally describe the migration routes of PGCs in all seven species.
Experimental Protocols
Preparation of embryos
Zebrafish were kept at the Nanae Fresh-Water Laboratory, Hokkaido University. Parent fish were maintained at 26~28°C under a 16 hour light / 8 hour dark photoperiod. Embryos were obtained from natural matings. Dechorionation and culture procedures were carried out as described by Nagai et al. (2001). Pearl danio were kept at the Nanae Fresh-Water Labo-ratory and embryos were obtained as for zebrafish. Dechorionation and culture methods were also identical to those of zebrafish. The developmental stages of the pearl danio
Fig. 1. The visualization of bright cells using GFP-nos1 3’UTR mRNA in embryos of various fish species during the somitogenesis period. (A,B) zebrafish. (C,D) pearl danio. (E,F) goldfish. (G,H) loach. (I,J) herring. (K,L) medaka. (M,N) ice goby. (B, D, F, H, J, L and N) are fluorescent views of (A, C, E, G, I, K and M), respectively. (O) Ice goby embryo at the early somitogenesis period in which GFP-nos1 3’UTR mRNA was injected. (P,Q)
Higher magnification of the area indicated by the box in (O). (P) GFP- tagged cells. (Q) The vasa in situ hybridization view. Note that the same cells are identified by GFP-tagging and vasa in situ hybridization. Arrows indicate the bright cells. Arrowhead in (L) indicates ectopic bright cells.
B
C
D
E
F
G
H
I
J
K
L
M
N
O
P
Q
have not yet been described. Therefore, staging of the embryos was accomplished by observation of the numbers of blas-tomeres and somites and the proportion of epiboly.
The loaches used in this study were obtained from the Loach Farming Cooperation of Kitamura during the spawning season from June to July. Fertilization, dechorionation and culture of loach embryos were carried out as described by Fujimoto et al. (2004).
Goldfish were kept in the Nanae Fresh-Water Laboratory, Hokkaido University. Embryos were obtained using the method of Yamaha and Yamazaki (1993). Developmental stages of goldfish were determined using the criteria suggested by Yamaha et al. (1999) and Kajishima (1960). Dechorionation and culture methods were as described by Yamaha et al. (1986) and Otani et al. (2002), respectively.
Medaka were kept at the Nanae Fresh-Water Laboratory, Hokkaido University. Medaka embryos were obtained by natu-ral mating of adult fish whose breeding condition was main-tained using a 16 hour light / 8 hour dark photoperiod at 26~28°C. Culture and staging of medaka embryos were per-formed in accordance with Iwamatsu (2004).
Adult herring were obtained from the National Center for Stock Enhancement, Akkeshi, Hokkaido. Eggs and sperm were collected from these fish and insemination was carried out on a polypropylene sheet. Inseminated eggs were transferred to plastic dishes filled with filtered seawater at 4°C. The herring eggs adhered strongly to the dishes shortly after transfer. The seawater in the dishes was replaced 10 min after fertilization. The chorions of fertilized herring eggs were softened using a urea solution (1.0% urea, 0.1% trypsin in filtered seawater) for a few hours at 4°C prior to microinjection. Embryos were cultured at 4°C. To aid observation, the softened chorions were removed manually using fine forceps under a stereomicro-scope.
Adult ice gobies used in this study were purchased from local dealers. Maturation, fertilization, dechorionation and culture methods were as described by Saito et al. (2001). Staging of
embryos was carried out in accordance with Arakawa et al. (1999).
Construction and synthesis of mRNA
Capped sense GFP-nos1 3’UTR and GFP-olvas 3’UTR mRNA was synthesized in vitro using the mMESSAGE MA-CHINE kit (Ambion).
Microinjection of mRNA
mRNA was microinjected into the blastodiscs of ice goby and medaka embryos, or into the yolk just under the blastodisc of goldfish, zebrafish, pearl danio, loach and herring embryos at the one- to four-cell stage. In the medaka and herring, the injection microneedles penetrated through the chorion and the mRNA solution was injected into the egg cytoplasm. This type of microinjection can result in the backflow of perivitelline space fluid when ‘simple’ pulled micropipettes are used. To prevent backflow, ‘breaking micropipettes’ were prepared according to Kishimoto (1986). Briefly, a glass microneedle was drawn from glass capillary tube (Drummond) with a Narishige needle puller. The microneedle was held horizontally and its tip inserted into a 1 mm loop heater of platinum wire (0.3 mm thick in diameter). By heating, a constriction was formed in the wall of the microneedle so that the inside diameter was reduced to about 1-5 µm. The constriction was formed at about 3~5 mm from the tip of the needle. Microinjection of dechorionated embryos was performed using simple pulled micropipettes. Prior to microin-jection, the tips of both types of microneedle were broken using forceps under a stereomicroscope to create an inner diameter opening of 5 µm. We did not determine the quantity of mRNA injected into each embryo.
Following microinjection, the proportions of embryos that developed normally in zebrafish, pearl danio, goldfish, loach, medaka and herring were similar to those of controls (Table 1). However, normal development occurred in a smaller proportion of microinjected ice goby embryos than in controls (Table 1). A small number of unfertilized and deformed embryos were dis-carded. GFP-fluorescence was observed using a fluorescence stereomicroscope (Olympus SZ-12).
Histological observation of herring embryos
For histological analysis, herring embryos were fixed with Bouin’s fixative for 2 h and embedded in resin according to the manufacturer’s recommended protocol (Technovit 7100: Kulzer). Serial 5 µm sections were cut and stained with hematoxylin and eosin (HE). PGCs were identified by their location and charac-teristic appearance, in particular round shape, large nucleus and relatively large size as observed in other fish (Braat et al., 1999; Kazama-Wakabayashi et al., 1999; Nagai et al., 2001). PGCs were also identified by location: at the 16-dpf stage, they were present in the area of the upper body cavity where the genital ridge is formed.
Whole mount in situ hybridization using vasa probe
In order to confirm that GFP-tagged cells are PGCs, we compared the locations of GFP- tagged cells and vasa mRNA expressing cells using whole mount in situ hybridization (WISH) in GFP-injected embryos of the ice goby. The ice goby was chosen because it is the species phylogenetically most distant
Species Experimental Number of Number of embryos Number of embryos group embryos developing normally with bright cells
zebrafish control 82 69 (84.2%)
-injected 126 103 (81.7%) 103 (100%)
pearl danio control 96 85 (88.5%)
-injected 217 205 (94.0%) 202 (98.5%)
loach control 73 66 (90.4%)
-injected 199 182 (91.5%) 181 (99.5%)
goldfish control 60 53 (88.3%)
-injected 132 117 (88.6%) 117 (100%)
medaka control 15 15 (100%)
-injected 43 43 (100%) 42 (97.7%)
ice goby control 51 43 (84.3%)
-injected 42 25 (59.5%) 25 (100%)
herring control 154 135 (87.7%)
injected 125 106 (84.8%) 106 (100%)
DEVELOPMENT OF EMBRYOS AND IDENTIFICATION OF BRIGHT CELLS IN FISH SPECIES FOLLOWING MICROINJECTION OF
GFP-NOS 1 3’UTR mRNA INTO 1- TO 4-CELL STAGE EMBRYOS
Fig. 2. The migration of loach bright cells visualized by GFP fluorescence. (A,D) 90%-epiboly. (B,E) 1-somite stage. (C,F) 7~8-somite stage. (G,I) 35-somite stage. (H,J) 2-dpf. (D, E, F, I and J) are fluorescent views of (A, B, C, G and H), respectively. Scale bar indicates 100 µm.
to zebrafish in this study. WISH was carried out as described by Saito et al. (2004) using an antisense vasa probe from ice goby containing 0.38 Kb DEAD-box regions.
Results
The appearance of fluorescent cells following microinjection of mRNA
We examined GFP expression patterns in developing embryos after microinjection of GFP-nos1 3’UTR mRNA either into the blastodisc (ice goby and medaka) or into the yolk just under the blastodisc (goldfish, zebrafish, pearl danio, loach and herring) of one- to four-cell stage embryos.
GFP was expressed from the blastula stage in all injected embryos. Thereafter, at the 50%-epiboly stage to at least the somitogenesis stage, a limited number of cells showed stronger fluorescence (bright cells) than those surrounding them. Bright cells were observed in almost all injected embryos of all the fish species (Table 1). Remarkably, bright cells appeared during devel-opment in species as phylogenetically distant to zebrafish as herring (Clupeiformes), medaka (Beloniformes) and ice goby (Perciformes). The distributions of bright cells in somitogenesis stage embryos of each fish species are illustrated in Fig. 1. The numbers of bright cells at this stage differed between embryos even within species (Table 2). With regard to herring, the numbers of bright cells were not counted because the cells formed dense aggregations that made accurate enumeration difficult. Although
the relative level of GFP expression was very low in somatic cells compared to bright cells, a superficially high level of GFP expres-sion was observed in the embryonic body. We presume that this is caused by the thickness of the embryonic body. GFP-expression in somatic cells diminished during development but was main-tained in bright cells.
In ice goby embryos, vasa mRNA expressing cells were local-ized at the same position as bright cells (Fig. 1O-Q). Thus, the GFP-tagging method is able to identify PGCs in species as phylogentically distant as the ice goby and the zebrafish.
Microinjection of GFP-olvas 3’ UTR mRNA into one- to two-cell
Weidinger et al., 1999). Bright cells appeared after the 50%-epi-boly stage and clustered around both sides of the trunk at the level of the first somites. Thereafter, these cells migrated posterior-ward and settled at the junction of the yolk extension (zebrafish, Fig.1A, B; pearl danio, Fig. 1C, D).
The migration route of bright cells in the loach embryo is shown in Fig. 2. Bright cells appeared at the marginal region of the blasto-derm at the 50%-epiboly stage. These cells were localized on both sides of the dorsal axis at the
A
B
C
D
E
F
G
H
I
J
stage loach and zebrafish embryos did not differ-entiate somatic cells and PGCs (data not shown). In contrast, the PGCs of medaka embryos showed strong GFP expression following microinjection of this mRNA.
Migration routes of bright cells in different fish species
To determine whether the bright GFP-nos1 cells were PGCs, we compared the migration routes of bright cells and PGCs in each species. In zebrafish and pearl danio embryos, the migration routes and final location of the bright cells were similar to those already described for PGCs in the zebrafish embryo (Yoon et al., 1997; Species* Number of Average number of S.D. Range
embryos bright cells
zebrafish 34 21.2 8.9 5-53
pearl danio 35 24.8 8.4 5-43
loach 41 16.1 6.9 0-29
goldfish 33 43.2 22.1 6-90
medaka 33 22.5 14.8 3-54
ice goby 25 13.5 5.9 4-24
THE NUMBERS OF BRIGHT CELLS SEEN IN EMBRYOS OF DIFFERENT FISH SPECIES DURING THE
SOMITOGENESIS STAGE
TABLE 2
90%-epiboly stage (Fig. 2A, D). At the 1-somite stage, bright cells were mainly clustered around both sides of the first somite region (Fig. 2B, E). During the segmen-tation period, the clusters of cells on both sides of the trunk migrated to a more posterior position than in the zebrafish (Fig. 2C, F, G and I). At the hatching stage (2 dpf at 20°C), the PGC clusters on both sides reached the posterior half of the yolk extension (Fig. 2H, J). However, a few bright cells were localized at a distance from the main clusters in some embryos (Fig. 2J arrowhead). Finally, bright cells migrated axial-ward and arrived at the upper part of the gut where the genital ridge is located.
In goldfish embryos, bright cells appeared during epiboly. These cells aligned on both sides of the trunk at the early segmentation period (Fig. 1E, F). They then aggregated at the junction of the yolk extension at the late somitogenesis period, although they were more widely distributed than in zebrafish embryos. This migration pattern of bright cells in goldfish em-bryos is similar to the dynamics of PGCs previously observed using vasa gene expression in goldfish embryos (Otani et al., 2002). However, in some gold-fish embryos, bright cells formed clusters as in zebragold-fish at the level of the first somite region during the early somitogenesis period and migrated as clusters toward the junction of the yolk ball and yolk extension.
The migration route of bright cells in the medaka embryo is shown in Fig. 3. In medaka embryos, bright cells appeared at the marginal region of the blasto-derm after the mid-gastrula stage (Fig. 3A, D). These cells were mainly located around both sides of the dorsal axis at the late-gastrula stage (Fig. 3B, E). During the neurula and early segmentation period, these cells aligned on both sides of the trunk (Fig. 3C, F, G and J). Thereafter, these cells migrated
posterior-Fig. 3. The migration of medaka bright cells visualized by GFP fluorescence. (A,D)
Mid-gastrula stage (stage-15). (B,E) Late-gastrula stage (stage-16). (C,F) Early-neurula stage (stage17). (G,J) 4-somite stage (stage-20). (H,K)16-somite stage (stage-24). (I,L)
34-somite stage (stage-29). (D, E, F, J, K and L) are fluorescent views of (A, B, C, G, H and I), respectively. Scale bar indicates 500 µm.
A
B
C
D
E
F
G
H
I
J
K
L
10- to 20-somite stage, these cells migrated axial-ward and aggre-gated under the trunk (Fig. 5C-E, J-L). Thereafter, until the 30-somite stage, these cells re-aligned on both sides of the gut (Fig. 5F, M). These cells then migrated toward the dorsal part of the gut (Fig. 5G, N). The migration route of the bright cells is similar to the dynamics of PGCs observed by vasa gene expression (data not shown) and that reported for PGCs in a histological analysis of ice goby embryos (Saito et al., 2002).
Discussion
Identification of bright cells by mRNA injection
When GFP-nos1 3’UTR mRNA was microinjected into fertil-ized eggs, cells showing bright GFP fluorescence were observed from the epiboly stage to the early segmentation period in all fish species used in this study. The migration route of these bright cells in goldfish, zebrafish, medaka, loach and ice goby were identical to those of PGCs in each species (Otani et al., 2002; Yoon et al., 1997; Tanaka et al., 2001; Saito et al., 2002; and author’s unpublished data). In herring, the final localized position of bright cells was identical to that found for PGCs by histological observation, suggesting that the bright cells are PGCs. In pearl danio, the migration pattern of PGCs has not been reported. ward (Fig. 3H, K). Finally, the bright cells clustered on both sides
at the level of the 10th to 12th somites (Fig. 3I, L). However, a few bright cells were localized at an ectopic region during embryogen-esis in some embryos (Fig. 1L and 3K, arrowheads).
The migration route of bright cells in herring embryos is shown in Fig. 4. Bright cells clustered around both sides of the first somite region at the tail bud stage (Fig. 4A, E). Clusters of these cells migrated axial-ward and aggregated under the trunk during the early somitogenesis period (Fig. 4A-H). Thereafter, these cells re-aligned on both sides of the embryonic body (Fig. 4I, J). Finally, they migrated to the dorsal part of the gut (Fig. 4K, L). In 17 of 274 (6.2%) embryos, some bright cells showed a sparse localization posterior to the main aggregation (Fig. 4M, N line). We also examined HE-stained histological sections of embryos from the 14 dpf to hatching stages and found that PGCs were present in the upper part of the gut. These cells aggregated within a narrow area whose location was similar to that of the bright cells at the same stages of development (Fig. 4O, P).
However, bright cells in this species migrated along a similar route as PGCs in the zebrafish. In the ice goby, the species phylogenetically most distant to zebrafish in this study, vasa mRNA was expressed in the GFP-tagged bright cells of microinjected em-bryos, suggesting that the bright cells are PGCs. Moreover, GFP-expression diminished in somatic cells but not bright cells during development in all the species used here, suggesting that there is a differ-ence between somatic cells and bright cells in the stability of injected mRNA, or of GFP, or of both mRNA and GFP. From our observations, we con-clude that the bright cells are PGCs and hereafter describe them as such.
PGCs were visualized by GFP-nos1 3’UTR mRNA in all seven species used in this study. It has been shown in zebrafish that nos1 3’UTR-containing mR-NAs are stabilized in PGCs but subject to rapid degradation in somatic cells (Köprunner et al., 2001). Our results indicate that the function of the nos1 3’UTR is widely conserved across fish species. How-ever, information on the nos1 gene in fish is re-stricted to zebrafish. Therefore, to support our sug-gestion that nos1 3’UTR is widely conserved across fish species, we need to compare the nos1 3’UTR sequences in a wide range of fish species. In contrast to GFP-nos1 3’UTR mRNA, GFP-olvas 3’UTR mRNA did not enable visualization of PGCs in either zebrafish or loach. It is known that the 3’UTR of vasa in both zebrafish and medaka has a critical role in the stabi-lization (or maintenance) of vasa mRNA in germ cells (Wolke et al., 2002; Tanaka et al., submitted). Our results indicate that the mechanism for maintenance of medaka vasa 3’UTR in germ cells or its degrada-tion in somatic cells does not funcdegrada-tion in zebrafish and loach embryos. This suggests that the machin-ery for maintenance of vasa 3’UTR is not conserved in fish species, unlike that for the nos1 3’UTR. It is reasonable to suppose that this difference is caused by a functional difference of vasa 3’UTR in each species. In this connection, Knaut et al. (2002) have already shown that zebrafish vasa 3’UTR contains elements that contribute to germplasm localization. Medaka vasa 3’UTR lacks these regions. Inoue et al. (2005) and Peng et al. (2006) estimated the time of divergence within actinopterygians based on whole
concentration of mRNA in each PGC was different. Indeed, in some blastula embryos, it was observed that only part of the blastodisc was labeled with GFP (data not shown). This strongly suggests an uneven dispersion of the injected mRNA in the blastodisc.
Injected ice goby embryos showed a lower rate of viability than other species. This may reflect an inter-species difference in sensitivity to microinjection.
Migration route of PGCs
Recently, it has been suggested that the molecules required for PGC migration and specification are highly conserved across a wide range of organisms (reviewed by Wylie, 1999; Extavour
Fig. 4. The migration of herring bright cells visualized by GFP fluorescence and location of PGCs in transverse sections of herring embryos. (A,E) Tail-bud stage.
(B,F) 6-somite stage. (C,G)15-somite stage. (D,H) 22-somite stage. (I,J) 12-dpf. (K-N) 16-dpf embryo. (E, F, G, H, I, J, L and N) are fluorescent views of (A, B, C, D, I, K and M), respectively. The locations of bright cells are indicated by the arrows and by the line in the images showing the fluorescent view. (O,P) Transverse section of the position where bright cells were aggregated in 16-dpf embryos. (P) Higher magnifi-cation of the area indicated by the box in (O). Arrows and arrowheads in (O,P) indicate PGCs. Abbreviations: da, dorsal aorta; g, gut; no, notochord. Scale bar in (J and N) indicates 400 µm. Scale bar in (O and P) indicates 100 µm.
mitochondrial genome sequences. They reported that the di-vergence time between the Clupeocephala (the group that includes the seven species used here) and other species was either 230/277 or 307 million years ago, depending on the data set used (Inoue et al., 2005; Peng et al., 2006). The results reported here suggest that the function of the nos1 3’UTR was established prior to the time of divergence and has been conserved thereafter. This is not the case for the vasa 3’UTR, suggesting that the two mRNAs differ in functional importance during early embryogenesis.
Variable numbers of PGCs were visualized in each embryo. It is likely that this variability is the result of uneven dispersion of mRNA in the blastodisc after microinjection and that the
A
B
C
D
E
F
G
H
I
J
K
L
M
N
O
and Akam, 2003; Santos and Lehmann, 2004). If PGC migra-tion in fish is based on a conserved mechanism, comparative studies will provide important information on this process. The migration routes of PGCs have been identified histologically, or biochemically using whole mount in situ hybridization to vasa mRNA. In this study, the migration routes of PGCs were identified for the first time in loach, ice goby, herring and pearl danio. We provide a schematic description of the patterns of PGC migration in these fish species (including some informa-tion from previous reports) in Fig. 6. The distinguishing differ-ences between the fish are: (1) the localization pattern of the PGCs at the pre-somite stage; (2) the distribution pattern lateral to the embryonic body during the early segmentation period; (3) the direction of subsequent movement from the lateral position toward the dorsal axis during the segmentation period; and (4) the final positions of the PGCs.
At the bud stage, the PGCs were located laterally along the embryonic body in all fish species examined in this study. In zebrafish embryos, it was shown that PGCs adjacent to the dorsal axis are repulsed lateral-wards during the epiboly to tail bud stages (Weidinger et al., 1999). During the same period in the floating goby, PGCs were aligned along the embryonic body at a fixed distance to the dorsal axis, suggesting that the embryonic body also repulses PGCs (Saito et al., 2004). In the medaka mutant akatsuki, which lacks a notochord, PGCs were observed under the body axis at the early segmentation period, suggesting that lateral repulsion of PGCs is due to the differen-tiation of midline tissue (Sasado et al., 2004). It seems quite probable that same mechanism work in all fish species exam-ined in this study.
During the early segmentation period PGCs in zebrafish, loach, pearl danio and herring form aggregated clusters lateral to the embryonic body, while PGCs in medaka, goldfish and
Fig. 5. The migration of ice goby bright cells visualized by GFP fluorescence. (A,H) 90%-epiboly stage. (B,I) 5-somite stage. (C,J) 10-somite stage. (D,K) 15-somite stage. (E,L) 20-somite stage. (F,M)
30-somite stage. (G,N) 5-dpf stage. (H, I, J, K, L, M and N) are fluorescent views of (A, B, C, D, E, F and G), respectively. Scale bar indicates 100 µm.
gobies form elongated loose align-ments. In zebrafish embryos, these clus-tered positions are believed to repre-sent intermediate targets of migration during the early segmentation period, with the PGCs subsequently migrating from there to their final targets ( W e i d i n g e r et al., 2002). The chemoattractant signal SDF-1a is ex-pressed along the migration route of PGCs (Doitsidou et al., 2002). In con-trast, we did not observe putative inter-mediate targets, similar to those in zebrafish, during PGC migration in gold-fish and gobies. In gobies and herring, the direction of the subsequent migra-tion paths of PGCs during the mid-segmentation period is different to that of zebrafish, pearl danio, loach, gold-fish and medaka. Gobies and herring PGCs, on both sides of the trunk, mi-grated toward the embryonic body dur-ing the segmentation period. PGCs in the dorsal trunk region aggregated at a slightly posterior position and thereaf-ter re-distributed to both sides of the
gut. In the floating goby, the timing of PGC re-distribution after the 20-somite stage corresponded to the formation of the definite gut (Saito et al., 2004). It seems probable that the newly patterned organ affects PGC localization. Although the mecha-nism of the dorsal-ward migration of PGCs in gobies and herring is unknown, mesoendodermal cells under the embry-onic body may play an important role. In the other fish species used in this study, PGCs migrated in a posterior direction during the mid-segmentation period. In these species, chemoattractant systems may control the posterior migration in a similar fashion to those in the zebrafish. It is likely that the differences in migration patterns between each fish species reflect differ-ences in spatiotemporal patterns of PGC guidance signals in each species. It will be necessary to elucidate the molecular mechanisms of PGC migration, in particular the relationship in various fish species between the patterns of expression of genes responsible for the PGC guidance signal(s) and pattern-ing events.
The position of the gonads, the final destination of migrating PGCs, varies between fish species. Interestingly, the migration routes were limited to regions above the yolk ball and yolk extension in all species, although a few ectopic PGCs were observed in the trunk and head regions in all species. It is likely that the yolk ball and its covering mesoendodermal germ layer provide PGCs with favorable fields of signals. Indeed, in many fish species, positional closeness between PGCs and the yolk syncytial layer (YSL) and endodermal cells have been ob-served during migration (goldfish - Kazama-Wakabayashi et al., 1999; zebrafish - Nagai et al., 2001; ice goby and floating goby - Saito et al., 2002, Saito et al., 2004). Therefore, more studies will be required to identify molecular factors that control PGC migration and to correlate these with associated histologi-cal observations.
A
B
C
D
E
F
G
In this study, we compared the migration patterns of PGCs in seven species of fish using microinjected GFP-nos1 3’UTR mRNA to identify the PGCs. The Clupeocephala is divided into main four groups: Clupeomorpha (including Clupeiformes; her-ring), Ostariophysi (including—Cypriniformes; zebrafish, pearl danio, goldfish and loach), Protacanthopterygii and Neoteleostei (including Beloniformes and Perciformes; medaka and ice goby, respectively). However, we could not discern any rela-tionship between the migration patterns of the PGCs and the phylogenetic distance between the species. Possibly, any such relationship might become evident if we screened a lot of fish species. PGC visualization with GFP will provide information of importance to the study of the mechanisms of migration of fish
PGCs and will also have applications in the study of other aspects of PGC development. A greater understanding of PGC migration will be obtained through screening of mutations and genes in zebrafish and medaka and the comparative observa-tion of GFP-tagged PGCs. The high evoluobserva-tionary divergence of fish species and the fact that they have extrauterine develop-ment make fish a valuable model for the investigation of PGC formation and migration during embryogenesis.
In conclusion, the PGCs of pearl danio, goldfish, loach, herring, medaka and ice goby could be visualized using GFP-nos1 3’UTR mRNA. This result suggests that the function of the nos1 3’UTR is highly conserved in teleosts. By injection of the construct into early embryos, the migration routes of PGCs
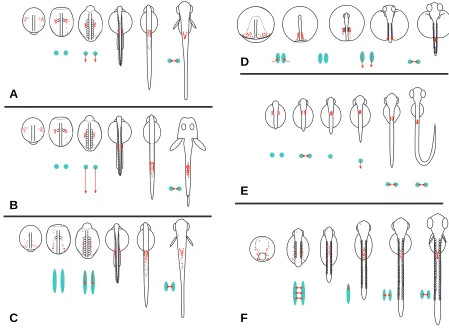
Fig. 6. Schematic illustration showing a comparison of migration patterns of PGCs in embryos of different fish species. Red dots indicate PGCs. Green circles /ellipsoids and red arrows respectively indicate the distribution patterns and migratory directions of PGCs at each developmental stage. (A) Zebrafish and pearl danio. PGCs cluster around both sides of the trunk at the level of the first somites at the 1-somite stage. They migrate posterior-ward during the early segmentation period. Finally, these cells settle at the junction of the yolk extension. (B) Loach. Migration pattern of PGCs is similar to that of zebrafish and pearl danio until the early segmentation period. However, the clusters of cells on both sides of the trunk migrate to a more posterior position than in the zebrafish. (C) Goldfish. PGCs align on both sides of the trunk at the early segmentation period. These cells aggregate at the junction of the yolk extension at the late segmentation period. However, these cells are more widely distributed than in zebrafish embryos. In the some goldfish embryos, PGCs formed clusters as in zebrafish at the level of the first somite region during the early somitogenesis period; these clusters were maintained when the cells migrated toward the junction of yolk ball and yolk extension (illustration not shown here). (D)
Medaka. PGCs are mainly located around both sides of the dorsal axis at stage 16. These cells are widely clustered around both sides of the trunk during stages 17 to 21 and thereafter, migrate posterior-ward. (E) Herring. PGCs cluster around both sides of the first somite region at the tail bud stage. Clusters of these cells migrate axial-ward and aggregate under the trunk during the early segmentation period. Thereafter, these cells re-align on both sides of the embryonic body and migrate to the dorsal part of the gut. (F) Ice goby and floating goby. PGCs align on both sides of the trunk from the head to tail bud region during the early segmentation period. These cells migrate axial-ward and thereafter, re-align on both sides of the gut. Finally, they migrate toward the dorsal part of the gut.
A
B
C
D
E
were determined for these fish species. GFP-tagged PGCs from transgenic trout lines have been separated from somatic cells using a cell sorting machine (Kobayashi et al., 2004). Similarly, use of GFP-nos1 3’UTR mRNA will enable separation of migrating PGCs from somatic cells in a wide variety of fish species. Visualization of PGCs tagged with GFP-nos1 3’UTR mRNA will be a powerful technique not only for studying the mechanisms of PGC formation, migration and differentiation, but also for investigating the induction of germ line chimerism.
Acknowledgements
We thank Mr. Shizuo Kimura, Ms. Misae Takagi and the members of the Nanae Fresh-Water Laboratory, Field Science Center for North-ern Biosphere, Hokkaido University for advice and help with breeding of the fish. We also thank Mr. S. Takeyama, Center for Stock Enhance-ment of Oysters, Akkeshi, Hokkaido, for providing the excellent experi-mental conditions for the experiments on manipulation of herring eggs. This study was supported in part by the 21st COE program for Graduate
School of Fisheries Sciences of Hokkaido University and a Grant-in Aid for Scientific Research (B) from JSPS to E. Yamaha (No. 16380124) and T. Saito (No. 17780146).
References
ARAKAWA, T., KANNO, Y., AKIYAMA, N., KITANO, T., NAKATSUJI, N. and NAKATSUJI, T. (1999) Stages of Embryonic Development of the Ice Goby (Shiro-uo), Leucopsarion petersii. Zoolog. Sci. 16: 761-773.
BRAAT, A.K., ZANDBERGEN, T., VAN DE WATER, S., GOOS, H.J. and ZIVKOVIC, D. (1999) Characterization of zebrafish primordial germ cells: morphology and early distribution of vasa RNA. Dev. Dyn. 216: 153-167.
CIRUNA, B., WEIDINGER, G., KNAUT, H., THISSE, B., THISSE, C., RAZ, E. and SCHIER, A.F. (2002) Production of maternal-zygotic mutant zebrafish by germ-line replacement. Proc. Natl. Acad. Sci. USA 99: 14919-14924.
DOITSIDOU, M., REICHMAN-FRIED, M., STEBLER, J., KÖPRUNNER, M., DÖRRIES, J., MEYER, D., ESGUERRA, C.V., LEUNG, T. and RAZ, E. (2002) Guidance of primordial germ cell migration by the chemokine SDF-1. Cell
111: 647-659.
EXTAVOUR, C.G. and AKAM, M. (2003) Mechanisms of germ cell specification across the metazoans: epigenesis and preformation. Development 130:
5869-5884.
FUJIMOTO, T., KATAOKA, T., OTANI, S., SAITO, T., AITA, T., YAMAHA, E. and ARAI, K. (2004) Embryonic stages from cleavage to gastrula in the loach Misgurnus anguillicaudatus. Zoolog. Sci. 21: 747-755.
IWAMATSU, T. (2004) Stages of normal development in the medaka Oryzias latipes. Mech. Dev. 121: 605-618.
KAJISHIMA, T. (1960) The normal developmental stage of the goldfish, Carassius auratus. Japan J. Ichthyol. 8: 20-28.
KAZAMA-WAKABAYASHI, M., YAMAHA, E. and YAMAZAKI, F. (1999) The elimination and duplication of lower part of blastoderm effects on the number of primordial germ cells in goldfish. Fish. Sci. 65: 577-582.
KISHIMOTO, T. (1986) Microinjection and cytoplasmic transfer in starfish oo-cytes. Method Cell. Biol. 27: 379-394.
KNAUT, H., STEINBEISSER, H., SCHWARZ, H. and NÜSSLEIN-VOLHARD, C. (2002) An evolutionary conserved region in the vasa 3’UTR targets RNA
translation to the germ cells in the zebrafish. Curr. Biol. 12: 454-466.
KOBAYASHI, T., YOSHIZAKI, G., TAKEUCHI, Y. and TAKEUCHI, T. (2004) Isolation of highly pure and viable primordial germ cells from rainbow trout by GFP-dependent flow cytometry. Mol. Reprod. Dev. 67: 91-100.
KÖPRUNNER, M., THISSE, C., THISSE, B. and RAZ, E. (2001) A zebrafish
nanos-related gene is essential for the development of primordial germ cells. Genes. Dev. 15: 2877-2885.
KUROKAWA, H., AOKI, Y., NAKAMURA, S., EBE, Y., KOBAYASHI, D. and TANAKA, M. (2006). Time-lapse analysis reveals different modes of
primor-dial germ cell migration in the medaka Oryzias latipes. Dev. Growth Differ. 48:
209-221.
LIN, S., LONG, W., CHEN, J. and HOPKINS, N. (1992) Production of germ-line chimeras in zebrafish by cell transplants from genetically pigmented to albino embryos. Proc. Natl. Acad. Sci. USA. 89: 4519-4523.
MOLYNEAUX, K. and WYLIE, C. (2004) Primordial germ cell migration. Int. J. Dev. Biol. 48: 537-544.
NAGAI, T., YAMAHA, E. and ARAI, K. (2001) Histological Differentiation of Primordial Germ Cells in Zebrafish. Zoolog. Sci. 18: 215-223.
OTANI, S., MAEGAWA, S., INOUE, K., ARAI, K. and YAMAHA, E. (2002) The germ cell lineage identified by vas-mRNA during the embryogenesis in
goldfish. Zoolog. Sci. 19: 519-526.
RAZ, E. (2002) Primordial germ cell development in zebrafish. Semin. Cell. Dev. Biol. 13: 489-495.
RAZ, E. (2003) Primordial germ-cell development: the zebrafish perspective.
Nat. Rev. Genet. 4: 690-700.
SAITO, T., KAMIMOTO, M., MIYAKE, A., YAMAHA, E., SUZUKI, T., NAKATSUJI, N. and NAKATSUJI, T. (2001) Mesoderm formation by isolated and cultivated 8-cell stage blastomeres of the teleost, Leucopsarion ptersii (shiro-uo). Int. J. Dev. Biol. 45: 661-668.
SAITO, T., OTANI, S., NAGAI, T., NAKATSUJI, T., ARAI, K. and YAMAHA, E. (2002) Germ cell lineage from a single blastomere at 8-cell stage in shiro-uo (ice goby). Zoolog. Sci. 19: 1027-1032.
SAITO, T., OTANI, S., FUJIMOTO, T., SUZUKI, T., NAKATSUJI, T., ARAI, K. and YAMAHA, E. (2004) The germ line lineage in ukigori, Gymnogobius species
(Teleostei: Gobiidae) during embryonic development. Int. J. Dev. Biol. 48:
1079-1085.
SAITO, T. and YAMAHA, E. (2004) Aspects and prospective of surrogate propagation in teleost fish. J. Anim. Genet. 31: 47-55.
SANTOS, A.C. and LEHMANN, R. (2004) Germ cell specification and migration in Drosophila and beyond. Curr. Biol. 14: R578-R589.
SASADO, T., MORINAGA, C., NIWA, K., SHINOMIYA, A., YASUOKA, A., SUWA, H., HIROSE, Y., YODA, H., HENRICH, T., DEGUCHI, T., IWANAMI, N., WATANABE, T., KUNIMATSU, S., OSAKADA, M., OKAMOTO, Y., KOTA, Y., YAMANAKA, T., TANAKA, M., KONDOH, H. and FURUTANI-SEIKI, M. (2004) Mutations affecting early distribution of primordial germ cells in Medaka (Oryzias latipes ) embryo. Mech. Dev. 121: 817-828.
TAKEUCHI, Y., YOSHIZAKI, G. and TAKEUCHI, T. (2004) Biotechnology: surrogate broodstock produces salmonids. Nature 430: 629-630.
TANAKA, M., KINOSHITA, M., KOBAYASHI, D. and NAGAHAMA, Y. (2001) Establishment of medaka (Oryzias latipes ) transgenic lines with the
expres-sion of green fluorescent protein fluorescence exclusively in germ cells: a useful model to monitor germ cells in a live vertebrate. Proc. Natl. Acad. Sci. USA. 98: 2544-2549.
WAKAMATSU, Y., OZATO, K., HASHIMOTO, H., KINOSHITA, M., SAKAGUCHI, M., IWAMATSU, T., HYODO-TAGUCHI, Y. and TOMITA, H. (1993) Genera-tion of germ line chimeras in medaka (Oryzias latipes). Mol. Marine. Biol. Biotech. 2: 325-332.
WEIDINGER, G., WOLKE, U., KÖPRUNNER, M., KLINGER, M. and RAZ, E. (1999) Identification of tissues and patterning events required for distinct steps in early migration of zebrafish primordial germ cells. Development 126:
5295-5307.
WEIDINGER, G., WOLKE, U., KÖPRUNNER, M., THISSE, C., THISSE, B. and RAZ, E. (2002) Regulation of zebrafish primordial germ cell migration by attraction towards an intermediate target. Development 129: 25-36.
WOLKE, U., WEIDINGER, G., KÖPRUNNER, M. and RAZ, E. (2002) Multiple levels of posttranscriptional control lead to germ line-specific gene expres-sion in the zebrafish. Curr. Biol. 12: 289-294.
WYLIE, C. (1999) Germ cells. Cell 96: 165-174.
YAMAHA, E., USUI, K., ONOZATO, H. and HAMADA, K. (1986) A method for dechorionation in goldfish, Carassius auratus. Bull. Japan. Soc. Sci. Fish. 52:
291-298.
YAMAHA, E., MIZUNO, T., MATSUSHITA, K. and HASEBE, Y. (1999) Devel-opmental staging in goldfish during the pre-gastrula stage. Nippon. Suisan. Gakkaishi. 65: 709-717.
YAMAHA, E., MURAKAMI, M., HADA, K., OTANI, S., FUJIMOTO, T., TANAKA, M., SAKAO, S., KIMURA, S., SATO, S. and ARAI, K. (2003) Recovery of fertility in male hybrids of a cross between goldfish and common carp by transplantation of PGC (primordial germ cell)-containing graft. Genetica 119: 121-131.
YOON, C., KAWAKAMI, K. and HOPKINS, N. (1997) Zebrafish vasa homologue RNA is localized to the cleavage planes of 2- and 4-cell-stage embryos and is expressed in the primordial germ cells. Development 124: 3157-3165.
YOSHIZAKI, G., TAKEUCHI, Y., KOBAYASHI, T. and TAKEUCHI, T. (2004)
Primordial germ cells: A novel tool for fish bioengineering. Fish. Physiol. Biochem. 28: 453-457.
YOSHIZAKI, G., TAGO, Y., TAKEUCHI, Y., SAWATARI, E., KOBAYASHI, T. and TAKEUCHI, T. (2005) Green fluorescent protein labeling of primordial germ cells using a nontransgenic method and its application for germ cell transplan-tation in salmonidae. Biol. Reprod. 73: 88-93.