CSEIT17258 | Received : 26 August 2017 | Accepted : 06 Sep 2017 | September-October-2017 [(2)4: 73-81]
International Journal of Scientific Research in Computer Science, Engineering and Information Technology © 2017 IJSRCSEIT | Volume 2 | Issue 5 | ISSN : 2456-3307
73
Assessment of Land use/Land Cover Changes Using Geospatial
technique at Osian-Mandore, Jodhpur (Rajasthan)
Basudeb Roy
1, Shruti Kanga
*2, Suraj Kumar Singh
31
Centre for Climate Change and Water Research, Suresh Gyan Vihar University, Jaipur, Rajasthan, India
*2
Centre for Climate Change and Water Research, Suresh Gyan Vihar University, Jaipur, Rajasthan, India 3
Centre for Sustainable Development, Suresh Gyan Vihar University, Jaipur, Rajasthan, India
ABSTRACT
Land use/ land cover change detection technique is extremely useful segment in understanding the connections of the human exercises of condition and along these lines, it is important to screen the progressions. Quick, uncontrolled, and unlawful urbanization joined by inadequate foundation has caused debasement of timberlands and fruitless terrains in the area. The study performed clearly depict that the information accumulated and handled in this investigation will give a premise to future feasible urban arranging and administration exercises. In this paper, arrive utilize change progression were examined by the consolidated utilization of satellite remote detecting and geological data frameworks (GIS). We grouped images into six land-utilize sorts: cropland, forestland, field, water, urban as well as developed land, and fruitless land. The outcomes demonstrate the huge lessening in desolate land was for the most part because of transformation to grassland. Cropland expanded related with changes from prairie and fruitless land. The scene has turned out to be more ceaseless, clustered and more homogeneous. The investigation shows that the reconciliation of satellite remote detecting and GIS was a powerful approach for breaking down the course, rate and spatial example of land-utilize change. The fast industrialization and urbanization of a region require snappy readiness of real land utilize/arrive cover (LU/LC) maps keeping in mind the end goal to recognize and maintain a strategic distance from abuse and harm of the scene past reasonable advancement limits. Remote detecting innovation fits well for long haul checking and appraisal of such impacts. The goal of this examination was to identify arrive utilize/arrive cover changes, and to evaluate the idea of future change following development of the global waterfront street which crosses the investigation region.
Keywords: Land use, Land cover, Satellite imagery, GIS, Image classification
I.
INTRODUCTION
Change recognition is the way toward distinguishing contrasts in the condition of a protest or marvel by watching it at various circumstances [1-5]. Auspicious and exact change identification of surface elements gives the premise to better understanding the connections and associations amongst human and normal marvels to appropriately oversee and utilize assets. Remote detecting information are essential sources broadly utilized for change location in late decades [5-8]. Satellite remote detecting has broadly connected and perceived as an intense and powerful instrument for distinguishing land-utilize and arrive
composite picture change identification are the two most generally utilized strategies in the change discovery thinks about that transcendently concentrate on giving the learning of how much, where, and what kind of land-cover change has happened. Urban organizers and chiefs in the administration and arranging of urban space can use spatially precise and convenient data on landcover change designs that supply required data on the past and the present condition of improvement and on the idea of changes that have happened. In this way, through monotonous satellite scope and the coordination of satellite and spatial information, arrive cover change examinations can be quickened. The requirement for fundamental land-cover data is basic to both logical examinations and basic leadership exercises [19-21]. In transient sizes of decades, human-instigated exercises are the essential factors in forming scene change, some because of particular administration practices and others to social, political, and monetary powers that control arrive cover [22]. Appraisal of the long haul effects of land-cover change is imperative for enhancing ecological administration works on with respect to both the land and water assets [23]. Such applications that give picture representations incite the need to encourage the related local and additionally national specialists to re-evaluate and reassess proper administration systems.
In the light of developing human needs and the tremendous changes people are making to biological systems, it is basic that astute decisions made in the utilization and protection of these environments. The test of viably dealing with Earth's biological communities and the outcomes of disappointment will keep on increasing amid the twenty first century [24]. To address this difficulty, individuals must have a superior comprehension and attention to the way their ways of life and exercises influence the biological community benefits on which they depend, and leaders require considerably more prominent access to logical information to settle on all around educated choices. To put it plainly, we should offer nittier gritty and solid data as a powerful influence for asset administration choices at all scales—worldwide, national and neighbourhood.
The significance of mapping land-utilize classes and observing their progressions with time has generally perceived in mainstream researchers. Remote Sensing
(RS) and Geographical Information Systems (GIS) are imperative instruments for considering land-utilize designs and their flow. Considering changes in arrive utilize design utilizing remotely detected information depends on the examination of time-successive information. Change discovery utilizing satellite information can take into consideration auspicious and predictable evaluations of changes in arrive utilize inclines over vast zones and has the extra preferred standpoint of simplicity of information catch into a GIS [25-27]. As of late, remote detecting with multi-worldly high determination satellite information has turned into a solid device for observing perspectives, for example, vegetation cover, soil corruption, urban development and all the more for the most part for most sorts of LU/LC changes [28-30]. As opposed to ground-based earthbound information securing, profitable learning can be analysed in a moderately brief time and practical way.
the order, causes and effects of the urbanization procedure. Inspiration to demonstrate urban scene elements emerges from the way toward inspecting what, where and to what degrees scene change has happened, and moreover, to see how and why the progressions can happen.
The main objectives of the study is to prepare GIS database for various thematic layers viz. road, railways, settlement, drainage, land use/ land cover, village and transport network. Thereafter land use/ land cover analysis & mapping 2015-2016 using two-seasons (Kharif & Rabi) satellite data. Finally land use/ land cover change analysis between the years 2011 to 2016.
II.
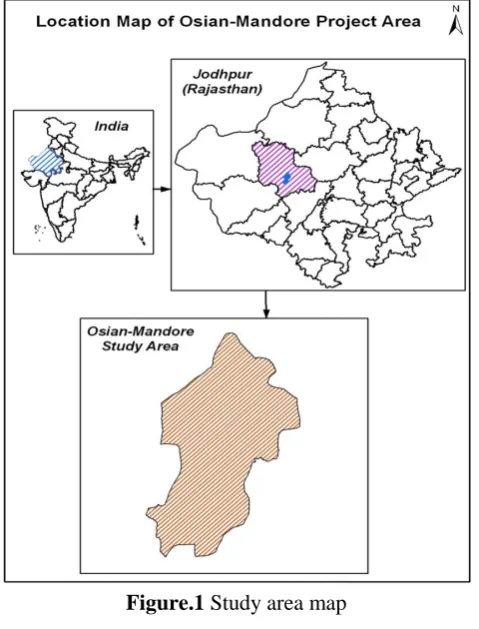
STUDY AREAOsian–Mandore are a tehsil in Jodhpur district of Rajasthan state. It belongs to Jodhpur division; it is located 60 km towards North from district head quarter Jodhpur. Osian–Mandore tehsil are bounded by Jodhpur tehsil towards South, Balesar tehsil towards West, Bhopalgarh tehsil towards East. Osian-Mandore study area constitutes of 12 villages of Mandore Block and 21 villages of Osian Block in Jodhpur district of Rajasthan. The total study area covering these villages is around 589.24 sq. km (Figure: 1).
Figure.1 Study area map
III.
METHODS AND MATERIAL
In this study, satellite data of Resourcesat-2 LISS-III (23.5m resolution, Table 2), LISS-IV (5.8m resolution) and LANDSAT-8 (30 m resolution, Table 1) of 2015-16 of two seasons (Kharif and Rabi) were used for preparing thematic maps. GIS database have been prepared for land use / land cover map of 2015-16 and its change analysis with 2011-12.
TABLE 1
LANDSAT DATA CHARACTERSICTICS
TABLE 2
IRS RESOURCESAT-2 DATA CHARACTERSICTICS
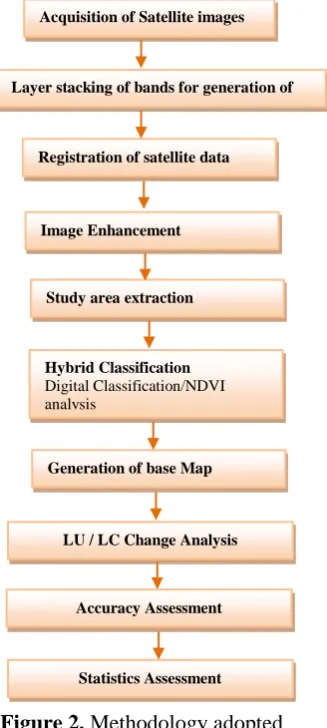
during the study is acquisition of satellite data, processing of satellite data, classification and analysis, map generation, report and statistics generation. The systematic steps of methodology are shown in the Figure 2. In the procedure, all the bands of LISS-III and LISS-IV were considered for layer stacking. The nature of these different bands had to be considered to make a decision as to which three-band combination would be most helpful for classification and visual interpretation. Similarly, in the layer stacking of Landsat data 3 bands viz.; Green 3), Red (Band-4) and NIR (Near Infrared) (Band-5) are considered for the better visual interpretability of the image and NDVI analysis. Image enhancement involves techniques for increasing the visual distinctions between features in a scene. The objective is to create new image from the original image data in order to increase the amount of information that can be visually interpreted from the data. There are no simple rules for producing the single best image for a particular application. Often several enhancements made from the same raw image are necessary. Contrast stretching has been carried for
Figure 2. Methodology adopted
image enhancement. Registration is the process of making image data into real coordinate system using a
geo-reference image. Ground control points (GCP) are given to the raw satellite data with reference to another registered image. The Universal Traverse Mercator (UTM) projection system (Zone-43) with WGS-84 as a datum has been used. The methodology attempted here is based on hybrid (visual and digital) classification of Resourcesat-2 LISS-III, LISS-IV and LANDSAT-8 data using standard False Color Composite (FCC) form. Image characteristics like tone / color, texture, pattern, shape, size, location, shadow, association are used for identifying the features. NDVI based digital classification is performed based on spectral separability for vegetation and water. The Kharif and Rabi crops are extracted and aggregated digitally and further integrated to land use / land cover after raster to vector conversion. Based on the identified ground features in the study area, the land use / land cover classification system up to Level-III has been adapted. In the present study, to delineate the Kharif, Rabi and colours bands for each pixel in the image as follows:
NDVI = (NIR - Red) / (NIR + Red)
As a result, vigorously growing healthy vegetation has low red-light reflectance and high near-infrared reflectance, and hence, high NDVI values. This relatively simply algorithm produces output values in the range of -1.0 to +1.0. Negative NDVI values (approaching -1) – deep water Close to zero NDVI values (-0.1-0.1) – barren areas (rock, sand or snow), Low positive NDVI values (0.2 to 0.4) –Sparse vegetation (shrub and grassland), High NDVI values (approaching 1) – Dense Vegetation (Forest, Crop etc).
IV. RESULTS AND DISCUSSION
A. Land use / land cover
The Land use / Land cover analysis has been performed using above mentioned hybrid classification technique based on digitally enhanced and geo-referenced satellite imagery (IRS Resourcesat-2 and Landsat-8) and further Land use / Land cover maps are prepared. The Land use / Land cover classification has Generation of base Map
LU / LC Change Analysis
Accuracy Assessment
Statistics Assessment Acquisition of Satellite images
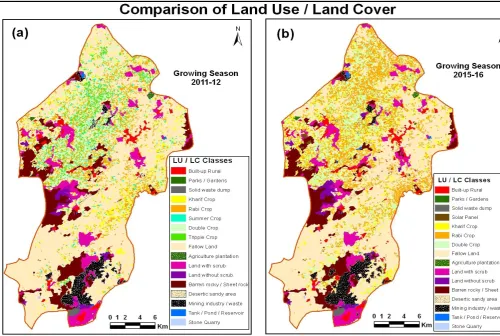
validated /modified through high-resolution data (LISS-IV). Total area of Land Use / Land Cover in Osian-Mandore study area are shown and The Land use / Land cover analysis is performed using LISS-III, LISS-IV and LANDSAT-8 satellite data and further changes analysis with respect to year 2011-12 has been carried out shows the land use / land cover map of study area for the year 2015-16 year. Comparisons of two different year’s (2011-12 to 2015-16) land use / land cover map are shown in figure. 3.
B. Built-up
It is defined as an area of human habitation developed due to intensive non-agricultural use. The major categories discernible on the satellite data in the study area includes Residential is identified and mapped. The total built-up land in the study area is 14.48 Sq. Km. (2.46%) in year 2011-12 and 17.11 Sq. Km. (2.90%) in year 2015-16. The spatial locations of the settlement are shown in base map along with connecting roads.
C. Agricultural Land
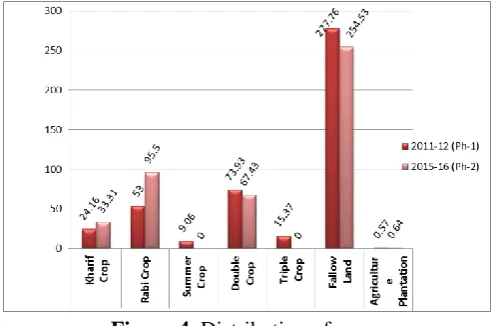
Agricultural land use by and large is dependent on agro-climatic condition prevalent in the area. Different Land use pattern has been observed in the study area. In the present study, the agricultural land includes kharif crop, rabi crop, double crop, fallow land and agriculture plantation. Total cropland area in 2011-12 is 453.85 Sq. Km (77.02%) and 451.41 Sq. Km. (76.61%) in 2015-16. The area estimated under kharif crop, rabi crop, double crop, triple crop, fallow land and agriculture plantation in 2011-12 are 24.16 Sq. Km. (4.10%), 53.00 Sq. Km. (8.99%), 9.06 Sq. Km. (1.54%), 73.93 Sq. Km (12.55%), 15.37 Sq. Km. (2.61%), 277.76 Sq. Km. (47.14%), and 0.57 Sq. Km. (0.10%), respectively. The LU / LC area in 2015-16 under kharif crop, rabi crop, double crop, fallow land and agriculture plantation are 33.31 Sq. Km. (5.65%), 95.50 Sq. Km. (16.21%), 67.43 Sq. Km. (11.44%), 254.53 Sq. Km. (43.20%) and 0.64 Sq. Km (0.11%) respectively (figure.4).
Figure 3. Land use / land cover graphical analysis
D. Wastelands
Wasteland is described as the degraded land caused due to lack of appropriate water and soil management because of natural causes. The wastelands categories in the present study area are land with scrub, land without scrub, barren rocky/sheet rock, desert sandy area and mining industry/ waste. The total area covering wastelands in 2011-12 is 119.91 Sq. Km. (20.35%) and 119.26 Sq. Km. (20.24%) in 2015-16 respectively. The area estimated under land with scrub, land without scrub, barren rocky/sheet rock, desert sandy area and mining industry/ waste in 2011-12 are 39.62 Sq. Km. (6.72%), 3.77 Sq. Km. (1.15%), 52.86 Sq. Km. (8.97%), 1.30 Sq. Km. (0.22%) and 19.36 Sq. Km. (3.29%) respectively. The LU / LC area in 2015-16 under land with scrub, land without scrub, barren rocky/sheet rock, desert sandy area and mining industry/ waste are 36.91 Sq. Km. (6.26%), 8.79 Sq. Km. (1.49%), 49.82 Sq. Km. (8.45%) and 1.30 Sq. Km. (0.22%) and 22.44 Sq. Km. (3.81%) respectively
E. Waterbodies
Figure 5. Comparative Land use / land cover changes between the years 2011-12 and 2015-16
Very few surface water bodies exist in the study area due to arid region. Few streams / channels are going to Osian-Mandore Study area some Pond and reservoir are identify on satellite image of 2011-12 & 2015-16 through LISS-IV data. Tank / Pond as water bodies are seen in the study area covering 0.88 Sq. Km. (0.11%) in 2011-12 and 1.35 Sq. Km. (0.23%) in 2015-16.
F. Stone Quarry
Stone quarry is belong to others category. Stone quarry are seen in the study area covering 0.11 Sq. Km. (0.02%) in 2011-12 and no change of 2015-16 year.
Land use / land cover changes between the years 2011-12 and 2015-16 - Comparative analysis of area statistics for LU/LC units in Osian-Mandore study area is done between 2011-12 and 2015-16 (Figure. 5; Table 3). It shows marginal increase in built-up land (2.63 sq. km) and wasteland is decreased by 0.65 sq. km. in the last 4 years interval. However, there is a decrease in
total agricultural land by 2.44 sq. km with the increase
in surface water bodies by 0.47 sq. km.
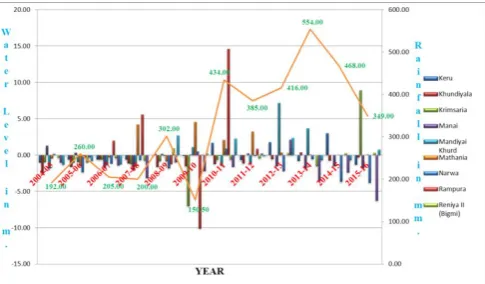
G. Relation between Ground Water Fluctuation and Rainfall
The trend lines indicate good correlation by most of the villages: viz. Barli, Krimsaria, mandiyai Khurd, Khundiyala and Mathania. which shows a perfect match between rainfall and water level fluctuation with +ve recharge, but an opposite trend is observed by Binjwadiya, Bhainser Chawandyali and Reniya II. All these relationship indicate that rainfall has a direct bearing on the variation in water level (figure 6 &7).
TABLE 3. LAND USE / LAND COVER CHANGE STATISTICS FOR OSIAN-MANDORE AREA BETWEEN 2011 - 2016
Figure 7. Ground Water Level v/s Rainfall map
V. Conclusion
The target of this investigation was to inspect the landcover changes in the second biggest authoritative region, using an assortment of information sources, including satellite images, standard scale 1:25000 topographic maps and different topical maps together with ground truth with the possibility of numerically confirming quick urbanization with absence of framework and partner its unfavourable consequences
affirm the discoveries of different creators that human exercises impacts affect the scene development in this locale and the strategies of land administration function admirably. The examination of the outlines showed the quick transformation of timberlands and infertile land to urban territories because of the engaging quality of the area. High spatial determination panchromatic and multispectral information from IKONOS-II, Quick Bird-2, hyperspectral information from Hyperion installed Terra-1, Resourcesat-1,and from future Earth perception missions, to be specific Cartosat-1 and 2 and Orbview-3, may additionally improve our capacity to think about the transient conduct of land-utilize/arrive cover designs at a bigger scale, which is required for cultivate level land-utilize arranging.
IV. REFERENCES
[1] Singh A, "Review Article Digital change detection
techniques using remotely-sensed data,"
International Journal of Remote Sensing, 10:6, 989-1003, 1989
[2] Belal, AA and Moghanm, FS, "Detecting urban
growth using remote sensing and GIS techniques in Al Gharbiya governorate, Egypt," Egypt. J. Remote Sens. Space Sci. 14 (2), 73-79, 2011.
[3] Jensen, JR, "Digital Change Detection.
Introductory Digital Image Processing: A Remote Sensing Perspective," Prentice-Hall, New Jersey, pp. 467-494, 2004.
[4] Singh, SK and Kanga, S, "Role of Geoinformatics in Site Suitability Analysis of Infrastructures using PRA Approach," American International Journal of Research in Science, Technology, Engineering & Mathematics, 1(18):81-85, 2017.
[5] Haack, BN and Rafter, A, "Urban growth analysis and modeling in the Kathmandu Valley, Nepal," Habit. Int. 30 (4), 1056-1065, 2006.
[6] Kanga, S, Sharma, LK, Nathawat, MS and Sharma,
SK, "Geospatial approach for forest fire risk modeling: a case study of Taradevi Range of Shimla forest division in Himachal Pradesh (India)," Indian Forester, 137 (3), 296-303, 2011.
[7] Kanga, S, Sharma LK, Pandey, PC and Nathawat
MS, "GIS Modelling Approach for Forest Fire Risk
Assessment and Management," International
Journal of Advancement in Remote Sensing, GIS and Geography, Vol 2. 30-44, 2014.
[8] Pandey, AC, Singh, SK, Nathawat, MS and Saha,
D, "Assessment of surface and subsurface
waterlogging, water level fluctuations and
lithological variations for evaluating ground water prospects in Ganga Plains," International Journal of Digital Earth. Vol. 6, No. 3, pp. 276 - 296, 2013. Indicators of Bilaspur District, H.P. (India),"
Journal of Arts, Science and Commerce
International Refereed Research Journal, 2(10): 48-55, 2017.
[11] Singh, S. K. "Geospatial Technique for Land
use/Land cover mapping using Multi-Temporal Satellite Images: A case study of Samastipur
District (India)," Environment & We An
International Journal of Science & Technology, Vol.11, Issue 2-4, 2016, pp. 75-85, 2016.
[12] Singh, SK, Saklani, B, Prakash, S, Chauhan, R and
Gupta H, "Geospatial Approach for Decentralised
Planning at Rajhana Panchayat, Himachal
Pradesh," International Journal of Advancement in Remote Sensing, GIS and Geography, Vol. 2, No. 2, pp. 27- 43, 2014.
[13] Singh SK, Kumar V and Kanga S, "Land use/land cover change dynamics and river water quality assessment using geospatial technique: a case study of Harmu river, Ranchi (India)," International Journal of Computer Sciences and Engineering, Vol.5, Issue.3, pp.17-24, 2017.
[14] Prakash, A and Gupta, RP, "Land-use mapping and
change detection in a coal mining area—a case study in the Jharia coalfield, India," International Journal of Remote Sensing. 19, 3, 391-410, 1998.
[15] Singh, SK and Pandey, AC, "Geomorphology and
the controls of geohydrology on waterlogging in
Gangetic Plains, North Bihar, India,"
Environmental Earth Sciences. Vol. 71, Issue. 4, pp. 1561- 1579, 2014.
[16] Singh, SK, Pandey, AC, Rathore, VS and
Nathawat, MS, "Evaluating factors responsible for contrastic signature of wasteland development in northern & southern Ganga plains (Bihar State, India) with focus on waterlogging," Arabian Journal of Geosciences. Vol. 7, Issue 10, pp. 4175-4190, 2014.
[17] Iverson, LR, "Land-use changes in Illinois, USA: the influence of landscape attributes on current and historic land use," Landsc. Ecol. 2: 45-61, 1988.
[18] Riebsame, W.E., Parton, W.J., Galvin, K.A., Burke,
[19] Singh, SK, Chandel, V, Kumar, H and Gupta H, "RS & GIS based urban land use change and site suitability analysis for future urban expansion of Parwanoo Planning area, Solan, Himachal Pradesh (India). International Journal of Development Research, Vol. 4, Issue 8, pp. 1491-1503, 2014.
[20] Singh, SK, "Land evaluation for sustainable
landuse by geospatial techniques: Assessment of wasteland in Gaya district (Bihar), India". In Debjani roy (Eds.) Environmental Degradation: Challenges and Remedies, 2016, pp. 82-99.
[21] Munsi, M, Malaviya, S, Oinam, G and Joshi PK,
"A landscape approach for quantifying land-use and land-cover change (1976-2006) in middle Himalaya," Regional Environmental Change 10: 145-155, 2009.
[22] Prakash, A. and Gupta, RP, "Land-use mapping
and change detection in a coal mining area - a case study in the Jharia coalfield, India," International Journal of Remote Sensing 19: 391-410, 1998.
[23] Weng, Q, "Land use change analysis in the
Zhujiang Delta of China using satellite remote sensing, GIS and stochastic modelling," Journal of Environment Management 64: 273-284, 2002. [24] Gupta, RP, "Remote Sensing Geology,"
Springer-Verlag: Berlin-Heidelberg, 1991.
[25] Alberti, M, Weeks, R and Coe, S, "Urban land cover change analysis in Central Puget Sound," Photogrammetric Engineering and Remote Sensing, 70(9), 1043 - 1052, 2004.
[26] Kanga, S, Sharma, LK, Pandey, PC, Nathawat, MS
and Sharma, SK, "Forest fire modeling to evaluate potential hazard to tourism sites using geospatial approach," Journal of Geomatics, Vol., 7, 93-99, 2013.
[27] Kanga S, "Geospatial techniques for Land use Land
cover mapping using satellite data: A case study of Bilaspur District (Himachal Pradesh)". In Avishek K., et al., (Eds.) Construction management, Mechanization and Environmental sustainability. White Falcon Publishing, pp. pp. 251-258, 2017, 2017.
[28] Yuan, F, Bauer, ME, Heinert, NJ and Holden, G,
"Multi-level land cover mapping of the Twin Cities (Minnesota) metropolitan area with multi-seasonal Landsat TM/ETM+ data," Geocarto International, 20(2), 5 - 14, 2005.
[29] Coppin, P, Jonckheere, I, Nackaerts, K, Muys, B
and Lambin, E, "Digital change detection methods in ecosystem monitoring: A review," International Journal of Remote Sensing, 25(9), 1565 - 1596, 2004.
[30] Fuller, RM, Smith, GM and Devereux BJ, "The
characterization and measurement of land cover change through remote sensing: Problems in operational applications," International Journal of Applied Earth Observation and Geoinformation, 4, 243 - 253, 2003.
[31] Singh, SK, Kumar, S and Kanga S, "Land use/land
cover change dynamics and river water quality assessment using geospatial technique: a case study of Harmu river, Ranchi (India)". International Journal of Scientific Research in Computer Science and Engineering, Vol.5, Issue.3, pp.17-24, 2017.
[32] Kanga S, "Forest cover and land use mapping using
remote sensing and GIS Technology". Suresh Gyan Vihar University Journal of Climate Change and Water, Vol. 1 (2) Feb 2017 pp. 13-17, 2017.
[33] Sinha, S, Nathawat, MS, Sharma, LK, Kumar, P,
Kanga, S and Pandey, PC, "Remote estimation of land surface temperature for different LULC features of a moist deciduous tropical forest region," In: Mukherjee, S., Gupta, M. & Srivastava, P.K. (Eds.). Remote Sensing Techniques in Earth
Sciences, Springer Springer International
Publishing, pp. 57-68. Doi: 10.1007/9783-319-05906-8_4, 2014.
[34] Stow, DA and Chen, D, "Sensitivity of
multitemporal NOAA-AVHRR data for detecting
land cover changes," Remote Sensing of
Environment 80, 297-307, 2002.
[35] Rogerson, PA, "Change detection thresholds for remotely sensed images," Journal of Geographical Systems 4, 85-97, 2002.
[36] Mas, JF, "Monitoring land-cover changes: a
comparison of change detection techniques," International Journal of Remote Sensing 20, 139-152, 1999.
[37] Kanga, S., Sharma, LK, Pandey, PC, Nathawat, MS
and Sinha, S, "Geospatial approach for allocation of potential tourism gradient sites in a part of Shimla District in Himachal Pradesh," India. Journal of GIS Trends, 2(1), 1-6, 2011.
[38] Singh, SK, Mishra, SK and Kanga S, "Delineation