Automatically Identifying Periodic Social Events from Twitter
Florian Kunneman
Centre for Language Studies Radboud University
f.kunneman@let.ru.nl
Antal van den Bosch
Centre for Language Studies Radboud University
a.vandenbosch@let.ru.nl
Abstract
Many events referred to on Twitter are of a periodic nature, characterized by roughly constant time intervals in between occur-rences. Examples are annual music fes-tivals, weekly television programs, and the full moon cycle. We propose a sys-tem that can automatically identify peri-odic events from Twitter in an unsuper-vised and open-domain fashion. We first extract events from the Twitter stream by associating terms that have a high prob-ability of denoting an event to the exact date of the event. We compare a timeline-based and a calendar-timeline-based approach to detecting periodic patterns from the event dates that are connected to these terms. After applying event extraction on over four years of Dutch tweets and scanning the resulting events for periodic patterns, the calendar-based approach yields a pre-cision of0.76on the 500 top-ranked peri-odic events, while the timeline-based ap-proach scores0.63.
1 Introduction
As a popular communication channel for both sharing news, experiences, and intentions, Twitter has been found to provide an accurate reflection of many aspects of the real world (Bollen et al., 2011; Zhao et al., 2011). For example, the peri-odicity of daily life can be exposed by visualiz-ing the frequency of hashtags such as ‘#breakfast’ and ‘#goodmorning’ (Preo˜tiuc-Pietro and Cohn, 2013). In addition, real-world events can be auto-matically detected by signaling a sudden rise and fall of word occurrences in tweets (Petrovi´c et al., 2010; McMinn et al., 2013). We propose a sys-tem that can identifyperiodicevents from Twitter: provided with a continuous stream of raw tweets, it returns an overview of periodic social events.
Surprisingly, this topic of periodicity has not yet been studied in the context of events mentioned on Twitter, while the identification of periodicity in recurring events has obvious gains for a sys-tem that detects events in the Twitter stream. De-tected periodicity patters can be used to predict fu-ture events before they are referred to on Twitter. For instance, if World Food Day is detected on the 16th of October for a number of consecutive years, it can be expected and put on the calendar for the next year.
The rich set of references to the real world made on Twitter make it a suitable platform to mine for periodic patterns in relation to events of any type. At the same time, the non-standard language and large amount of streaming messages make it a challenging task. We facilitate this task by ap-plying an event extraction approach that identifies terms that might represent a social event, and that relates them to a frequently and explicitly men-tioned date of the event. After this first event ex-traction stage, periodicity detection can be applied to the clean date sequences linked to event terms.
2 Related Work
Finding periodic patterns is a valuable task in many contexts of sequential data, such as DNA or protein sequences (Zhang et al., 2007), market basket data (Mahanta et al., 2008), and complex signals such as sound (Sethares and Staley, 1999). Elfeky et al. (2005) distinguish between ‘seg-ment periodicity’ and ‘symbol periodicity’. The first refers to the repetition of a specific sequence, while the second refers to single symbols in a se-quence that recur at roughly constant time inter-vals. The latter is what we aim to detect.
Several patterns of periodicity have been ana-lyzed in social media. Chu et al. (2012a) aim to distinguish bots from human user accounts on Twitter, and find that the periodicity of tweet post-ings is a strong indicator to recognize bots. They
estimate periodicity by the entropy rate of post intervals, where a low entropy points to a non-random, periodic pattern. Chu et al. (2012b) adopt this entropy-based periodicity feature to help dis-tinguish spam campaigns from proper campaigns on Twitter. Fan et al. (2014) analyze temporal pat-terns in topics discussed on Weibo, and find that the topic ‘business’ displays a highly periodic pat-tern. Yang et al. (2013) aim to classify Twitter users in predefined categories. They find that the periodicity pattern of words linked to a category is a strong indication, as users tend to mention their topic of interest at similar times of the day and week. At the word level, Preo˜tiuc-Pietro et al. (2013) apply Gaussian processes to model the pe-riodicity of hashtag mentions. They use this infor-mation to predict hashtag frequencies at any hour. The automatic identification of periodic patterns related to events has not been applied in the con-text of Twitter. The detection of single events, on the other hand, is a popular strand of research. Many studies have leveraged the notion of bursti-ness, the sudden rise and fall of word frequency, to find events from Twitter. Either by looking at the rapid growth of tweet clusters (Petrovi´c et al., 2010; McMinn et al., 2013; Diao et al., 2012) or words with peaky behavior (Weng and Lee, 2011; Li et al., 2012). The explicit reference to events in tweets has also been shown to help find scheduled events; social events in particular (Ritter et al., 2012). A possible reason the aforementioned ap-proaches have not been employed to search for pe-riodically recurring events, is that it requires a lon-gitudinal effort to increase the chances of observ-ing periodic behavior. To this end, we make use of TwiNL (Tjong Kim Sang and van den Bosch, 2013), a database of IDs of Dutch tweets gathered from December 2010 onwards.
3 Approach
3.1 Open-domain Event Extraction
Our approach to event extraction is similar to Rit-ter et al. (2012). The approach relies on ex-plicit references to a future point in time com-bined with terms, and favors date–term pairs with a strong connection. We apply this approach to Dutch tweets, though most of its components are language-independent.
3.1.1 Tweet Processing
Each incoming tweet from a stream is initially scanned for future referring time expressions. We manually specified a set of rules that focus on a future date in time as expressed in the Dutch lan-guage. Examples of the English equivalents of these rules are displayed in Table 1.1
Category Examples (English) Date Sept. 13th 2014 Exact in a month Weekday this Wednesday
Table 1: Examples of the three types of rules for the extraction of time expressions
The set of rules can be divided in three cate-gories that each relate to different types of con-version of the time expression into a date. The ‘Date’ category of rules consists of the different variations of date mentions, and link directly to a future date. The ‘Exact’ rules comprise a variety of phrase combinations that specify an exact num-ber of days remaining to the event. The ‘Weekday’ rules match a mention of a weekday, preceded by a future referring phrase like ‘deze’ (‘this’) or ‘vol-gende week’ (‘next week’).
Tweets found to have a future referring time ex-pression are subsequently scanned for meaning-ful words and wordn-grams that might denote an event. We refer to suchn-grams as ‘event terms’ henceforth. As off-the-shelf named entity taggers display a poor performance when applied on the non-standard language in social media (Ritter et al., 2011), as alternative we applied the common-ness metric (Meij et al., 2012) and extracted any hashtag as event term.
Commonness is formulated as the prior proba-bility of a conceptc(then-gram) to be used as an anchor textqin Wikipedia (Meij et al., 2012):
Commonness(c, q) = P|Lq,c|
c0|Lq,c0| (1)
WhereLq,cdenotes the set of all links with an-chor textqpointing to the Wikipedia page titledc, andPc0|Lq,c0| is the sum of occurrences ofq as
an anchor text linking to other concepts.
50% 75% 100% Mutual F-score
Ngram 0.52 - 0.42 0.89
Commonness 0.87 0.80 0.63 0.90
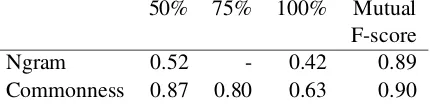
Table 2: Precision@250 of output identified as event by human annotators
minimal percentage of annotators that agreed on the event status. A majority of 75% of the anno-tators agrees that 80% of the output represents an event. In comparison, only 52% of the top-250 output of then-gram baseline system was rated as event by at least one of two annotators. We also scored the inter-annotator agreement by Mutual F-score, which provides an insight into the agree-ment for the positive (event) class. On average, annotators yield an F-score of 0.9 on classifying the event class if the decisions of another annota-tor are seen as the gold standard.
3.2 Online Extraction of Events
The approach described above extracts events from a fixed set of tweets. To apply the event extraction in a streaming fashion, the procedure should be repeated for any new batch of tweets. We chose to work with a window size of one month. We set the step size to one day, to en-sure that events are extracted from any monthly periodic sequence. For each daily event extraction step, the top-2500 events are selected.
This overlapping sliding window setting leads to a large amount of duplicate events in the output. To build a calendar of unique events, a merging procedure is performed after each event extraction. The events in the output are each compared with the existing set of events with the same date. If over 10% of the tweets in the new event overlap with an existing event, the events are merged by adding any new tweets and event terms to the ex-isting event. New events that do not overlap with an existing event are added as a new event.
3.3 Periodicity Detection
The event extraction procedure results in a set of events represented as one or more event terms linked to a date. Next, periodic events can be found by scanning for events that are linked to at least three dates, between which two periods of time occur that are roughly equal.
We compare two approaches to finding periodic
patterns from the date sequence related to an event term: a timeline-based approach and a calendar-based approach. We refer to them as ‘PerTime’ and ‘PerCal’.
3.3.1 PerTime
PerTime leverages the intervals between se-quences of at least three dates. Any date sequence that has roughly similar intervals is seen as peri-odic. The intervals are measured at the level of days. We estimate the similarity by computing the relative standard deviation over the intervals, RSD:
RSD= xs¯ ∗100% (4)
TheRSD relates the averagex¯to the standard deviations, returning the standard deviation as the percentage of the average values in a set. The RSD is a sensible approach to scoring the peri-odicity of date intervals, as any deviation in big intervals, such as 365 days, is less penalized than the deviation in smaller intervals, such as 7 days. We set the minimum interval length to 6 days, en-suring weekly events as the minimal periodicity.
3.3.2 PerCal
Rather than looking for regular intervals between dates, PerCal searches for similarities between the dates in a sequence. An event term like ‘Christmas Day’ would be mostly linked to ‘25 December’. Likewise, an event term might recur with ‘the third Saturday of May’. The calendar-based approach scans a date sequence for such repetitions.
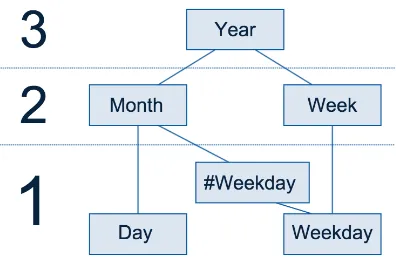
Figure 1: Diagram of included calendar fields and their relation on three levels.
like ‘every six months’ or ‘every two years’, by specifying a step size that relates to the field that is described by ‘every’. For example, h *2,1,-,-,Sunday,2idenotes ‘every two years on the second Sunday of January’, and h2011,*,-,1,-,-i denotes ‘every first day of the month in 2011’.
The relationship between the included calen-dar fields is illustrated in Figure 1. The scheme has three levels of granularity. On the first level are ‘day’ (1–31), ‘weekday’ (Monday–Sunday) and ‘#weekday’ (1–5). The ‘day’ field relates to ‘month’ (1–12) at the second level; any com-bination between the two values can be made. ‘#weekday’ has a connection to both ‘weekday’ and ‘month’, and represents the index of a week-day in a month (for example: thethirdWednesday of October). Finally, ‘weekday’ connects directly to ‘week’ (1–53), which enables relations like ‘ev-ery Wednesday’ or ‘Monday on week 40’. At the top level is the ‘year’ field, so as to describe yearly patterns or patterns during a specific year.
A periodic calendar pattern can be detected by ascending the hierarchy of calendar fields and looking for regularities. Like PerTime, weekly pe-riodicity is the smallest pattern that is searched for. Starting from the lower-level fields (day, weekday and the weekday-#weekday combination), the al-gorithm scans whether any of the values of these fields occurs three times or more (the minimum requirement for a periodic pattern). If this require-ment is met, the dates that contain this value are selected and passed on to the higher level: month (if the day or the weekday-#weekday combination is periodic) or week (if the weekday is periodic). Because the patterns we look for can describe ei-ther a sequence on this second level (like ‘every two months’ or ‘every week’) or a sequence of
years on the third level, we scan both for a se-quence and a repetition of the month or the week values on this second level. If a sequence is found, the pattern is finalized. If a repetition is found, the algorithm proceeds to find a yearly pattern.
A sequence of weeks, months or years might have steps of unequal size. In such a case we describe the pattern with the smallest step size found. Any date between larger steps is denoted as a missing date. In the sequence ‘2014/03/04 – 2014/04/04 – 2014/06/04’ there is a monthly sequence of step size ‘1’, with a missing date ‘2014/05/04’.
Some patterns show stronger periodicity than others. As mentioned above, a sequence might contain missing dates, decreasing the evidence for periodicity. In addition, not all dates linked to an event term may combine into a pattern. Following Li et al. (2001), we quantify these two inconsisten-cies asconfidence andsupport estimates. Confi-dence is estimated by dividing the dates that could fill in a pattern (from the first date to the last) by the number of dates that are actually seen. Sup-port is the percentage of all dates that are linked to an event term that satisfy the pattern. To ob-tain an overall score of the quality of a pattern, we calculate the average of these two metrics.
PerCal searches for periodic patterns at different levels. As a result, it may find multiple patterns in the same date sequence. If two patterns overlap, the one with the highest overall score is selected.
3.3.3 Clustering of Periodic Terms
To de-duplicate output from both the PerTime and PerCal approaches, we cluster event terms with a periodic sequence together. For both approaches, we aggregate all tweets linked to the periodic pat-tern of an event term, to form big documents. Any pair of terms with 90% overlapping dates for Per-Time and any pair with a similar pattern for PerCal were tested as clusters. Clustering was applied in the same fashion as described at the end of Sec-tion 3.1.2. The threshold for clustering was set to a cosine similarity above0.5.
4 Experimental Set-up 4.1 Data
bil-lion tweets in total. After processing these tweets, 24,162,633 were found to have a matching time expression.
4.2 Procedure
We applied the event extraction module on the span of tweets as specified in Section 3.2, with a sliding window of a month and a daily sliding frequency. Events were merged if they were ex-tracted from (partly) the same tweet IDs. After all tweets were processed, a calendar was filled with 94,526 events.
Periodicity detection is applied to single event terms; we kept a log of the dates linked to each term. We searched for periodic patterns in this log by starting with events that took place in 2014. For both PerTime and Percal, whenever a date in 2014 or later was appended to an event term log, the approach was applied to the updated date se-quence. If a periodic pattern was already found for an event term, it was overwritten with the pat-tern that was extracted from the updated sequence. We clustered terms with a similar periodic pattern after all events were processed.
4.3 Evaluation
We ranked the periodic event patterns returned by the two approaches by their respective metrics to score periodicity: RSD for PerTime and the aver-age value of support and coveraver-age for PerCal. One of the authors manually assessed the top-500 pat-terns from both rankings, deciding for each out-put whether it represents a regularly recurring se-quence of events, rather than events or event terms that share a coincidental temporal regularity. The terms, dates, and tweets linked to each output, and if needed the Google search engine, were con-sulted to guide this decision.
In order to acquire a sense of agreement for the annotations, a second author annotated the top-200 events of the two systems. The mutual F-score of positive annotations was0.92 for the PerTime output and0.93for the PerCal output.
5 Results
PerTime assigned a periodicity score to 5,301 events out of the total of 94,526 events. PerCal found 7,018 periodic patterns5. The precision and
5A dataset with the tweet ID’s that relate to all 94,526 events, as well as the periodic event patterns that were found by both systems, will be made publicly avail-able from http://cls.ru.nl/˜fkunneman/data_
recall of their top-500 output are presented in Ta-ble 3. 315 correct periodic events were confirmed from the output of PerTime, and 379 from the out-put of PerCal, resulting in precision-at-500 scores of0.63and0.76, respectively. We approximated a recall score by comparing the periodic event terms that were found by both approaches (637 in total), and calculating which percentage of these was re-turned by either of them. The recall scores are lower than the precision scores, due to an overlap of only 116 events (18%) between PerTime and PerCal.
Precision Recall PerTime 0.63 0.52 PerCal 0.76 0.69
Table 3: Periodicity detection quality after manual evaluation of the top-500 deteced periodic events by the two approaches.
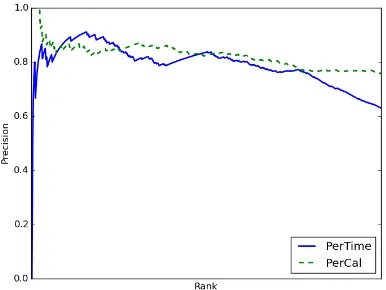
Precision-at-curves of the top-500 rankings are given in Figure 2. For PerTime, the RSD at rank 500 is10.2days. A perfect RSD score of0.0was maintained up to rank 81. The ranks of events with equal scores were randomly shuffled. The curve shows a progressing decay towards the end. The temporally increasing precision at rank 200 is due to the detection of a number of periodic events that are characterized by changing intervals, such as Easter and Pentecost, and share the same non-perfect RSD score.
For PerCal, the pattern score at rank 500 is0.65. In contrast to PerTime, precision is decreasing at a slower rate with lower-ranked events.
Figure 2: Precision-at-curves for PerTime and PerCal
Event term(S) Dates Timeline pattern Calendar pattern Periodic events #trendrede 2011/09/13,2012/09/11, 364 -364 - 364 h*,9,-,-,Tuesday,2i
found by both 2013/09/10, 2014/09/09
approaches #valentinesday 2013/02/14, 2014/02/14, 365 - 365 h*,2,-,14,-,-i
2015/02/14
Periodic events romantische muziek 2011/08/14, 2012/08/12, 364 - 378 - 364 -only found by 2013/08/25, 2014/08/24
timeline paaszondag 2011/04/24, 2012/04/08, 350 - 357 -
-approach 2013/03/31, 2014/04/20, 385 - 350
2015/04/05
Periodic events #7hloop 2011/11/20, 2012/11/18, 364 - 728 h*,11,-,-,Sunday,3i
only found by 2014/11/16
calendar fortarock 2011/07/02, 2012/06/02, 336 - 160 - 204 - h*,-,22,-,Saturday,-i
approach 2012/11/09, 2013/06/01, 364 - 371
2014/05/31, 2015-06-06
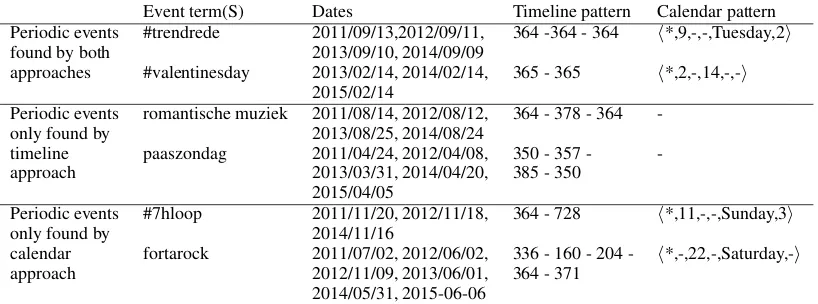
Table 4: Examples of periodic events in the top 500 output of the timeline and calendar approach
6 Analysis
Examples of detected periodic events are given in Table 4. To give an idea of the strength of both approaches, a distinction is made between events that are only found by one of them, or by both. An example of a periodic event found by both approaches is ‘#valentinesday’. Events like this, linked to a fixed date, are characterized by equal yearly intervals (only allowing for a minor devia-tion of 366 instead of 365 days in leap years).
The event ‘romantische muziek’ (referring to the ‘Day of Romantic Music’) is not found by PerCal, which is due to an inconsistent pattern of dates. PerTime can typically deal with such small inconsistencies. The event described by ‘paaszondag’ (‘Easter Sunday’) follows the lu-nisolar calendar, while the calendar approach fol-lows a Gregorian calendar scheme6. Again,
Per-Time only penalizes the inconsistencies in day in-tervals, without discarding the event altogether.
While PerTime can deal with inconsistencies in the intervals between dates, PerCal displays a higher tolerance towards missing dates. An exam-ple is ‘#7hloop’ (a running event in The Nether-lands), which was not found by the event extrac-tion module in 2013. The resulting interval of 728 days (two years) at this point results in a poor peri-odicity score for PerTime. PerCal, having detected the overall pattern, gives a smaller penalty for the missing entry in 2013. The support for these days is1.0, while the confidence is0.75, leading to an overall score of 0.88. Similarly, noisy date se-quences in which only part of the dates form a pe-riodic pattern can only be dealt with by PerCal. 6To find events like Easter, the framework of PerCal could be extended by including a lunisolar scheme or other existing schemes.
PerTime assigns a low overall periodicity score to the date sequence associated with ‘Fortarock’ (a music festival in The Netherlands), due the irreg-ular intervals.
7 Conclusion
We have presented a framework that extracts a cal-endar of events from the Twitter stream and detects periodic event sequences in this calendar. Apply-ing the procedure to over 4 years of Dutch tweets, a timeline-based and calendar-based approach to periodicity detection yield a precision-at-500 of 0.63and0.76, respectively.
As far as we know this is the first work that deals with the task of periodic event detection on Twitter data, which serves to extract long-range patterns from Twitter, detect periodic events among those patterns, and predict events before they are men-tioned on Twitter. Although we obtained encour-aging results, there is room for improvement. To clarify whether the event extraction approach that we applied is most suitable as a first step before pe-riodicity detection, other approaches to event de-tection or extraction, such as burstiness, may be applied as well during this stage for comparison.
The calendar-based approach may be extended in a knowledge-driven way with schemes that de-scribe the lunisolar calendar, the lunar calendar, as well as other historical and religious calendars, so as to enable the detection of periodic patterns that relate to Easter, the Ramadan, and Hindu festivals for example.
Acknowledgements
Networks Analysis and Mining (ASONAM), pages 684–691. IEEE.
Minghua Zhang, Ben Kao, David W. Cheung, and Kevin Y. Yip. 2007. Mining periodic patterns with
gap requirement from sequences. ACM
Transac-tions on Knowledge Discovery from Data (TKDD), 1(2):7.