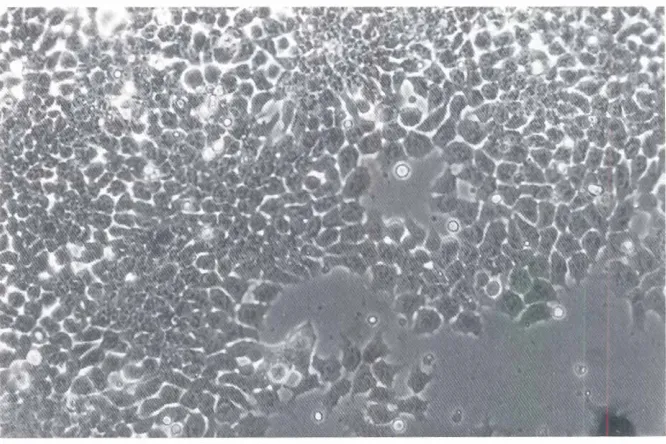
The F9 EC cell line as a model for the analysis of differentiation
Full text
Figure


Related documents
Figure 2.13 Eight available feedback paths from a single phase in an eight-phase mixer first receiver architecture with fully-differential
Beauveria bassiana (Balsamo) Vuillemin has established pathogenicity against house flies, Musca domestica L., and stable flies, Stomoxys calcitrans L., and is able to be grown
253.. of the indictment, it did not include any reference to the immediately pro- ceeding general parties instruction. The court held that in view of these
plan must: be consistent with National Contingency and Area Contingency Plans; identify the tanker person-in-charge during a discharge; ensure that sufficient private
Passed time until complete analysis result was obtained with regard to 4 separate isolation and identification methods which are discussed under this study is as
International Journal of Scientific Research in Computer Science, Engineering and Information Technology CSEIT195263 | Received 03 March 2019 | Accepted 12 March 2019 | March April 2019 [
Starting on your semi-log plot at the distance traveled (x axis, 72 mm), move straight up until you intersect with your drawn line. Now go straight left until you hit the y axis,
