Quality Estimation for Synthetic Parallel Data Generation
Raphael Rubino
?, Antonio Toral
†, Nikola Ljubeˇsi´c
‡, Gema Ram´ırez-S´anchez
? ?Prompsit Language Engineering, Elche, Spain†CNGL – School of Computing, Dublin City University, Ireland
‡Department of Information and Communication Sciences, University of Zagreb, Croatia {rrubino, gramirez}@prompsit.com, [email protected], [email protected]
Abstract
This paper presents a novel approach for parallel data generation using machine translation and quality estimation. Our study focuses on pivot-based machine translation from English to Croatian through Slovene. We generate an English–Croatian version of the Europarl parallel corpus based on the English–Slovene Europarl corpus and the Apertium rule-based translation system for Slovene–Croatian. These experiments are to be considered as a first step towards the generation of reliable synthetic parallel data for under-resourced languages. We first collect small amounts of aligned parallel data for the Slovene–Croatian language pair in order to build a quality esti-mation system for sentence-level Translation Edit Rate (TER) estiesti-mation. We then infer TER scores on automatically translated Slovene to Croatian sentences and use the best translations to build an English–Croatian statistical MT system. We show significant improve-ment in terms of automatic metrics obtained on two test sets using our approach compared to a random selection of synthetic parallel data.
Keywords:Under-resourced Languages, Synthetic Corpora, Machine Translation, Quality Estimation
1.
Introduction
Previous work on synthetic parallel data generation relies on the use of machine translation (MT) to translate source text into the target language for a given language pair in or-der to obtain a new parallel corpus. This resource can then be used as training material for SMT, or any other appli-cation that requires parallel data. However, one important limitation of thisartificialresource is its translation quality. As it is directly related to the performance of data-driven systems, the need for estimating the translation quality of synthetically built corpora seems obvious.
This paper applies quality estimation (QE) techniques for the generation of synthetic parallel data. Our case study is on the English–Croatian language pair with the Slovene language as pivot. We first train a Slovene–Croatian QE system by collecting limited amounts of parallel data for these languages from diverse sources. Then, the source side of the corpus is translated using the Apertium rule-based MT (RBMT) system (Forcada et al., 2011). The translated text is compared to its reference (the target side of the cor-pus) at the sentence level using TER (Snover et al., 2006). With these scores as labels, a regression model is built on feature vectors representing the sentence pairs (source– translation). Using the regression model, TER scores are inferred on automatically translated Slovene to Croatian sentences taken from the English–Slovene Europarl paral-lel corpus (Koehn, 2005). The best translations are used to build an English–Croatian statistical MT (SMT) system.
After giving an overview of previous work in the areas of pivot-based MT and QE in Section 2., the first part of our study is to build and evaluate a QE model for Slovene to Croatian, described in Section 3. We then present the SMT setup for translating from English to Croatian and the re-sults obtained using synthetic data in Section 4. Finally, we conclude and give details about future work in Section 5.
2.
Previous Work
2.1.
Synthetic Data for Pivot-based MT
Pivot-based MT refers to the use of an intermediate lan-guage, called pivot language (PL), to translate from the source- (SL) to the target language (TL). Differently than typical MT systems, which translate directly from SL to TL, pivot-based systems translate sequentially from SL to PL and then from PL to TL. The main motivation for build-ing pivot-based MT systems is the lack of language re-sources for a language pair SL–TL, in contrast with the availability of such resources for both language pairs SL– PL and PL–TL.
This is our case as our aim is to translate from English to Croatian, but to do so we use Slovene as a pivot. Our bilingual resources are for the English–Slovene language pair (Europarl parallel corpus) and for Slovene–Croatian (RBMT system).
Pivot-based strategies in MT can be classified into three cat-egories (Wu and Wang, 2009): phrase table multiplication (also known as triangulation), transfer (also referred to as cascade) and synthetic corpus.
The synthetic corpus approach (Gispert and Mari˜no, 2006; Bertoldi et al., 2008; Utiyama et al., 2008) is the one we work upon. In this method a SL–TL corpus is obtained using the SL–PL or the PL–TL corpora. One way to do this is to translate the PL sentences in the SL–PL corpus into TL with the PL–TL system. Another possibility is to translate the PL sentences in the PL–TL corpus into SL with the SL– PL system. Obviously, both methods could be applied and the two resulting synthetic corpora be merged into a single SL–TL corpus.
In this paper we extend the synthetic corpus approach to pivot-based MT by filtering the resulting synthetic corpus with QE.
2.2.
Quality Estimation and Applications
ref-erence. Since the first work conducted on QE for MT at the word and sentence levels, this task has grown in interest and performance in the past few years. (Gandrabur and Foster, 2003; Ueffing et al., 2003; Blatz et al., 2003) Recent eval-uation campaigns helped defining QE baselines and state-of-the-art systems, based on supervised learning using vec-torial representations of source sentences and their trans-lations associated with quality scores or labels. (Callison-Burch et al., 2012; Bojar et al., 2013) The usefulness of fea-ture types is directly related to the QE task itself,i.e.varies according to the quality scores or labels to estimate. (Shah et al., 2013) However, it was shown that the 17 baseline features suggested by the WMT12 QE shared task organ-isers perform well on several QE tasks. (Callison-Burch et al., 2012; Rubino et al., 2013) In the work presented in this paper, the QE baseline is inspired by this tried-and-tested feature set.
The type of machine learning algorithm used to train QE models is also well studied in the literature. For instance, Quirk (2004) report good results using linear regression, while partial least squares or decision trees show the best performance in the study conducted by Specia et al. (2009) and by Soricut et al. (2012) respectively. Amongst all the studies on QE for MT previously published, it appears that support vector machines (SVMs) tend to be the most pop-ular machine learning approach, this is why we decided to settle on SVMs in the work presented in this paper. The current performance of QE for MT allows researchers to integrate this technique in the MT pipeline, for instance as a way to rank or combine several MT systems’ out-put (S´anchez Mart´ınez, 2011; Okita et al., 2012; Avramidis, 2013) or to improve SMT performances in specific do-mains (Banerjee et al., 2013).
3.
Quality Estimation for Slovene-Croatian
The QE setup designed for our experiments on synthetic parallel data generation is presented in this Section. We first introduce the data and tools required to build and evaluate the QE models in Subsection 3.1., followed by the feature sets described in Subsection 3.2. extracted from the text data. Finally, the QE models evaluation results are detailed in Subsection 3.3..
3.1.
Dataset and Tools
In order to build and evaluate QE models for the Slovene– Croatian language pair, we collect three parallel corpora for these languages:
• the EAC Translation Memory (noted EAC)1 contain-ing573translation units,
• the EU Bookshop parallel corpus (notedEUb)2 con-taining4,222sentence pairs,
• a small Slovene–Croatian parallel corpus obtained from a translation agency3 (noted slhr) containing 2,286sentence pairs.
1http://ipsc.jrc.ec.europa.eu/index.php?
id=784 2
http://bookshop.europa.eu 3http://www.ciklopea.com
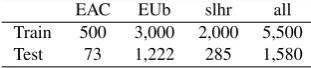
We first consider these corpora individually to build and evaluate three QE models, before concatenating the data (notedall) into one corpus and building our final QE model. This way, four QE models are trained, and evaluated on four test sets. We present the four corpora used for our QE ex-periment in Table 1. For each of the parallel corpora, the source sentences are translated from Slovene to Croatian using the Apertium RBMT system for this language direc-tion.4 Source sentences, their translations and references are then tokenised and lowercased using the tools provided with the Moses MT system (Koehn et al., 2007). The tool TERCOM5provides us with the sentence-level TER scores. This scores can be used as labels to train and evaluate our QE models. Finally, sentence triplets are randomised and the corpus is split in two parts: a training and a test set.
EAC EUb slhr all Train 500 3,000 2,000 5,500 Test 73 1,222 285 1,580
Table 1: Number of sentences in each configuration for the three different corpora used in our experiments. The col-umnallis the concatenation of the three other corpora.
Based on source sentences, their translations and their cor-responding sentence-level TER scores, we train regression models that aim to predict sentence-level TER scores on unseen data. However, using words directly, orn-grams, as features for QE usually leads to large and sparse vectors which complicates the supervised learning step. In order to generalise well and avoid training data overfitting, we extract a tried-and-tested set of features described in Sec-tion 3.2. using an in-house feature extractor tool-kit. We consider this first set of 15 features as our baseline. We then extend this feature set in order to improve the QE per-formance and measure its impact on the synthetic parallel data selection.
Regression models are trained using the-SVR implemen-tation available in the LibSVM toolkit (Chang and Lin, 2011). SVM parameters, namelyc,γand, are optimised based on a5-fold cross-validation approach using the train-ing set. The best parameter triplet is chosen accordtrain-ing to several metrics: Mean Average Error (MAE), Root Mean Square Error (RMSE), Pearson’s correlation coefficient (r) and the total number of support vectors. In our experiments, minimising the MAE and RMSE is not as crucial as max-imising the Pearson’s correlation coefficient, as the aim of our work is to predict TER scores following a similar dis-tribution as the reference ones.
3.2.
Quality Estimation Features
The features extracted from each sentence pair, i.e. source sentences and their translations, are inspired from the base-line feature set suggested by the WMT2012 QE shared task organisers (Callison-Burch et al., 2012). The full baseline set initially contains17features,2of them being dependent on the MT system. As Moses was the MT system used by
4https://svn.code.sf.net/p/apertium/svn/
trunk/apertium-hbs-slv/ 5
the shared task organisers and the2system dependent fea-tures are extracted from GIZA word-alignment tables, we decide to exclude these features from our feature set and keep a baseline set as independent as possible from the MT system used.
The15baseline features are described below:
- 6 Surface Featuressource and target segment lengths, number of punctuation marks, average source word length and average target word occurrence.
- 2 Language Model Features 3-gram log-probabilities of source and target segments according to Kneser-Ney-discounted LMs built with the SRILM toolkit (Stolcke et al., 2011) using the slWaC6 and hrWac7 monolingual corpora (Ljubeˇsi´c and Erjavec, 2011) for source and target LMs respectively.
- 7 n-gram Frequency Features The number of source segment unigrams seen in a reference corpus (slWaC) plus
6 features based on the most and least frequent source
n-gram (n∈ [1; 3]) quartiles. The reference corpus is the corpus used to extract the LM features.
In order to improve the QE performance and to measure its impact on synthetic-data-based SMT, we extend the base-line feature set to189features including the baseline ones. This extended set contains:
-36Surface Featuresuppercased-lowercased letters ratio, untokenised items, special characters, source and target fea-tures ratio.
-90Language Model Featuressource and target1 to5 -gram perplexity and log-probability according to LMs and backward-LMs (based on Raybaud et al. (2011)), as well as source and target features ratio.
- 63n-gram Frequency Featuressource and target uni-grams seen in a reference corpus (slWaC and hrWaC re-spectively), plus1to5-gram frequencies in each of the fre-quency quartiles, as well as source and target features ratio.
3.3.
Quality Estimation Evaluation
To evaluate the regression model, we infer TER scores at the sentence-level for each pair of the test set. The evalua-tion metrics are MAE, RMSE and Pearson’s r, but only the correlation coefficient is presented in this paper (Table 2). While MAE and RMSE are error measures (the lower the better) and thus indicate how far on average the predicted scores are from the reference ones, Pearson’s r is a corre-lation measure (the higher the better) and allows us to see whether the prediction follows a similar distribution to that of the reference. This latter score is the most interesting for us and we decide to select the best QE models based on this measure.
We build a regression model using each of the training cor-pora and evaluate them with the different test sets. This evaluation method aims to indicate which training corpus is performing the best on its corresponding test set, but also which corpus leads to a more generalised QE model. The
6
http://nlp.ffzg.hr/resources/corpora/ slwac/
7http://nlp.ffzg.hr/resources/corpora/
hrwac/
0 0.5 1 1.5 2
0 5 10 15 20 25 30
TER
50 Sentences
QE-baseline QE-extended Reference
Figure 1: Smoothed distributions of reference and predicted TER scores with the concatenated data setup (all) using two feature sets.
Pearson’s rresults show that each of the training set per-forms best on its corresponding test set, while theslhr cor-pus leads to the best rscore overall on its corresponding test set with QE model trained on the extended feature set. The data concatenation (system notedall) yields to a higher correlation score on the mixed test set and thus indicates a better generalisation over the training data. This motivates our choice to select this QE model for filtering translated monolingual data and generating a synthetic parallel cor-pus.
When comparing the baseline and the extended feature sets, we observe fluctuating improvements according to Pear-son’s correlation coefficient regarding the training and test-ing corpora. Five data configurations lead to negative cor-relations when using the baseline features while it is not the case with the extended set. Using theEUb corpus for training and testing the QE model, extending the feature set does not lead to significant improvement (with p ≤ 0.01
using the bootstrap resampling method). For the other cor-pora, the extended feature set improves over the baseline set when the train and test sets are taken from the same corpus. Figure 1 shows the distributions of TER scores for the ref-erence, the baseline and the extended QE setups, with the concatenated training and testing datasets (notedall). Bet-ter predictions are done by the extended QE model when the TER reference scores are low, while the baseline QE model tends to predict scores around the reference average. We decide to keep two QE models for the rest of our exper-iments, one using the baseline feature set and one using the extended set, both trained on the concatenated corpora.
4.
Synthetic-data-based SMT
Baseline Feature Set Extended Feature Set Train/Test EAC EUb slhr all EAC EUb slhr all
EAC 0.2779 -0.0659 0.0227 -0.0081 0.4361 0.0881 0.0514 0.1844 EUb -0.0949 0.2333 0.0801 0.1847 0.2595 0.2373 0.2497 0.2235 slhr 0.0160 -0.0790 0.4021 -0.0459 0.3053 0.1941 0.6646 0.2297 all 0.0198 0.1210 0.2221 0.2024 0.3964 0.1280 0.5237 0.3127
Table 2: Pearson’srobtained on the three corpora and the data concatenation using the baseline and the extended feature sets. Results in bold indicates the highest correlation between the prediction and the reference amongst training corpora for a given test set.
presents the dataset used to train and evaluate the SMT sys-tems, followed by the evaluation results in Subsection 4.2.
4.1.
Dataset
The synthetic parallel corpus is generated by translating the target side of the Europarl English–Slovene parallel corpus into Croatian using the Apertium RBMT system. The re-sulting English–Croatian parallel corpus is used to train a phrase-based SMT system with the Moses tool-kit. We do not run any tuning algorithm, and thus do not need a devel-opment set, on the different SMT systems built in order to strictly evaluate the effect of QE-based synthetic data gen-eration. To evaluate the SMT systems, we use two different test sets: Newstest2013 (a subset from WMT’13 test set manually translated into Croatian) and SETimes8. Details about the training and testing datasets are presented in Ta-ble 3.
Sentences Words
Train
English 621k 16.5M Slovene 621k 14.2M
Test
Newstest2013 (source) 1k 19.4k SETimes (source) 2k 51.5k
Table 3: Number of sentences and words in the training and testing data used for the SMT system.
4.2.
SMT Systems Evaluation
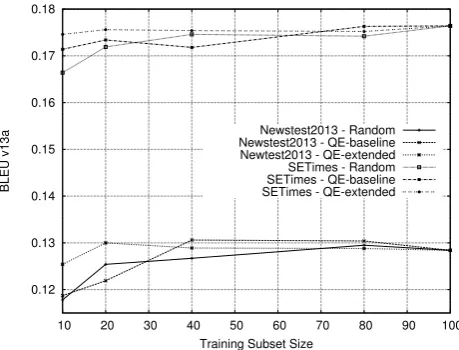
Based on the QE model presented in Section 3., we infer TER scores at the sentence-level for each translated sen-tence from the parallel training data presented in Table 3. Translations are then ranked from the lowest to the high-est TER score and we extract four subsets of this corpus, keeping10,20,40and80%of the overall amount of words in the parallel corpus. To compare our approach to a base-line, we randomly select subsets of the translated corpus with similar amount of words. We repeat the random-based experiments three times and average the obtained results. The SMT systems are then evaluated based on the trans-lated test sets scored with BLEU(Papineni et al., 2002) ver-sion13a, TER (using TERCOM) and METEOR (Lavie and Denkowski, 2009).
The BLEUscores are presented in Figure 2 and show that the extended QE models lead to the highest scores for 10 and 20% of the training data. For the test setSETimes, the
8http://nlp.ffzg.hr/resources/corpora/
setimes-hr
extended QE model also leads to the highest score for 40% of the training data, while the baseline QE model is better for this subset size on theNewstest2013test set. This par-ticular result can be explained by the fact that only a few subset sizes are evaluated and the maximum BLEUscore obtained by the extended QE model may be higher than the one obtained by the baseline QE model. Overall, the two QE setups show better results compared to the random setup for smaller training data. These results are explained by the ability to select the best translations provided by the RBMT first when using a QE-based approach compared to a random selection of the translations.
0.12 0.13 0.14 0.15 0.16 0.17 0.18
10 20 30 40 50 60 70 80 90 100
BLEU v13a
Training Subset Size
Newstest2013 - Random Newstest2013 - QE-baseline Newtest2013 - QE-extended SETimes - Random SETimes - QE-baseline SETimes - QE-extended
Figure 2: BLEUscores obtained by the random and the two QE setups on the two test sets, depending on training data subset sizes.
The TER scores are presented in Figure 3 and show con-sistent results based on the BLEUscores described previ-ously. With 10 and 20% of the training data, the extended QE model leads to lower TER scores compared to the baseline QE model and the random approach. For New-stest20130, the lowest TER score is obtained by the ex-tended QE model with 40% of the training data, while 80% of the training data is necessary to obtain the lowest TER score onSETimeswith the QE models. For this latter test set, the TER results are similar to the BLEUones where 80% of the training data appears to lead to the best score, once again explainable by the limited number of evaluated subset sizes.
0.695 0.7 0.705 0.71 0.715 0.72
10 20 30 40 50 60 70 80 90 100
TER
Training Subset Size
Newstest2013 - Random Newstest2013 - QE-baseline Newtest2013 - QE-extended SETimes - Random SETimes - QE-baseline SETimes - QE-extended
Figure 3: TER scores obtained by the random and the two QE setups on the two test sets, depending on training data subset sizes.
improvement of this result which indicates that no useful
parallel data is found over20% of the training data size. For the test set SETimes, the best METEOR score is ob-tained by the extended QE model using10%of the training data. With20and40%of the training data, the extended QE model still leads to the highest METEOR score com-pared to the baseline QE model and the random approach, while the baseline QE model is better than the two other systems using80%of the training data which is similar to the results obtained on theNewstest2013test set.
0.165 0.17 0.175 0.18 0.185 0.19 0.195
10 20 30 40 50 60 70 80 90 100
METEOR
Training Subset Size
Newstest2013 - Random Newstest2013 - QE-baseline Newtest2013 - QE-extended SETimes - Random SETimes - QE-baseline SETimes - QE-extended
Figure 4: METEOR scores obtained by the random and the two QE setups on the two test sets, depending on training data subset sizes.
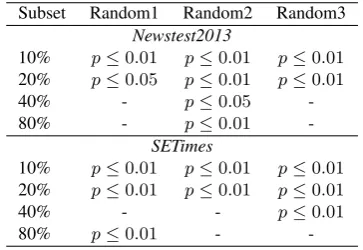
As shown by the evaluation done with three automatic met-rics, the QE-based approach leads to better results with smaller amount of training data compared to the random selection of synthetic parallel instances. In order to vali-date these results, we perform statistical significance tests on BLEU between the random and the QE-based sys-tems, using the paired bootstrap resampling method sug-gested by (Koehn, 2004). We use the toolkit provided by
Subset Random1 Random2 Random3
Newstest2013
10% p≤0.01 p≤0.01 p≤0.01
20% p≤0.05 p≤0.01 p≤0.01
40% - p≤0.05 -80% - p≤0.01
-SETimes
10% p≤0.01 p≤0.01 p≤0.01
20% p≤0.01 p≤0.01 p≤0.01
40% - - p≤0.01
80% p≤0.01 -
-Table 4: Significance levels when comparing BLEUscores obtained by the extended QE-based system and the random systems. Thep-values are calculated when the QE-based system reaches higher BLEUscores than the random sys-tems.
CMU9, which is based on the scriptmteval-v13areleased by NIST10. We compare the extended QE-based approach with the three random systems individually (which were av-eraged previously to compute automatic metrics) consider-ing two significance levels (p-values): 0.05and0.01. The results are presented in Table 4 and confirm our statement that the QE-based approach leads to better translations ac-cording to BLEU, compared to selecting random training instances, when the size of the training subset is below40%
of the synthetic training corpus.
As the amount of the synthetic training data increase, the performances of the random and QE-based systems become non-significantly different and the QE-based systems never outperform significantly the system trained using the full synthetic parallel corpus. It appears that the QE-based sys-tems do no benefit from the remaining 80% of the QE-ranked parallel corpus. In order to verify that BLEUreally reflects the translation quality, a native Croatian evaluator reviewed and assigned two scores at the sentence-level for theNewstest2013corpus. The evaluator has access to the English source sentence and its translation performed by three SMT systems: the random and extended QE-based systems trained on40%of the parallel data, as well as the systems trained on the full synthetic corpus. Each transla-tion is evaluated on a1to10scale according to the fluency and adequacy criteria.
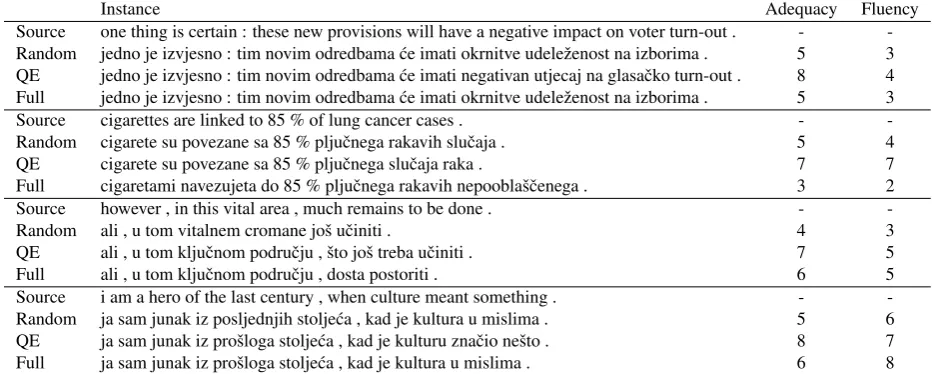
The results given by the human evaluator confirm what is observed using BLEU and only a few instances of New-stest2013are better translated using the QE-based approach compared to the full system. Four examples of the QE-based system outperforming the two other ones are pre-sented in Table 5, along with their fluency and adequacy scores. The first example shows an almost perfect transla-tion obtained with the QE-based system, only turn-out is not translated from English to Croatian. In the second ex-ample, the translation obtained with the full system is the worst, while the QE-based one is slightly better than the random system. The third and fourth examples show how the QE-based approach generates better translations com-pared to the random system with the same amount of data.
9
http://www.ark.cs.cmu.edu/MT/
10
Instance Adequacy Fluency Source one thing is certain : these new provisions will have a negative impact on voter turn-out . - -Random jedno je izvjesno : tim novim odredbama ´ce imati okrnitve udeleˇzenost na izborima . 5 3 QE jedno je izvjesno : tim novim odredbama ´ce imati negativan utjecaj na glasaˇcko turn-out . 8 4 Full jedno je izvjesno : tim novim odredbama ´ce imati okrnitve udeleˇzenost na izborima . 5 3 Source cigarettes are linked to 85 % of lung cancer cases . - -Random cigarete su povezane sa 85 % pljuˇcnega rakavih sluˇcaja . 5 4 QE cigarete su povezane sa 85 % pljuˇcnega sluˇcaja raka . 7 7 Full cigaretami navezujeta do 85 % pljuˇcnega rakavih nepooblaˇsˇcenega . 3 2 Source however , in this vital area , much remains to be done . - -Random ali , u tom vitalnem cromane joˇs uˇciniti . 4 3 QE ali , u tom kljuˇcnom podruˇcju , ˇsto joˇs treba uˇciniti . 7 5 Full ali , u tom kljuˇcnom podruˇcju , dosta postoriti . 6 5 Source i am a hero of the last century , when culture meant something . - -Random ja sam junak iz posljednjih stolje´ca , kad je kultura u mislima . 5 6 QE ja sam junak iz proˇsloga stolje´ca , kad je kulturu znaˇcio neˇsto . 8 7 Full ja sam junak iz proˇsloga stolje´ca , kad je kultura u mislima . 6 8
Table 5: Examples of source sentences and their translations obtained with the systems trained on the full synthetic corpus (notedFull), 20% of the synthetic data extracted randomly (notedRandom) and with the extended QE approach (noted
QE).
We assume that the full system is not significantly different than the QE one because our approach quickly reaches a plateau by using most of thegoodquality synthetic data in the first20%.
5.
Conclusion
This paper has presented a first step to the generation of synthetic parallel data for under-resourced languages us-ing QE. We departed from the synthetic corpus approach to pivot-based MT and extended it by filtering the resulting corpus with QE.
The case study presented deals with translation from En-glish to Croatian through Slovene. We have built a syn-thetic English–Croatian parallel corpus using an English– Slovene parallel corpus and a Slovene–Croatian RBMT system. A QE system has been used to filter the resulting synthetic corpus. To that end, we have built a QE system for Slovene→Croatian that estimates sentence-level TER scores. The sentence pairs of the English–Croatian syn-thetic corpus are then ranked according to their estimated scores according to the QE model and variable subsets are used to train SMT systems.
We show a significant improvement of the translation qual-ity atp≤0.01using the QE-based approach compared to a random selection of training instances. However, the dif-ference between these two setups becomes statistically in-significant when the synthetic training data subset exceeds
20%of the available parallel data. Also, the QE-based ap-proach does not significantly outperform an SMT system trained on the full synthetic corpus.
We assume that further improvements of the QE system, based on the extraction of a larger diversity of features and on automatic feature selection, could lead to some improve-ments of the SMT system. Improving the translation qual-ity of the Slovene–Croatian RBMT output or using a larger English–Slovene parallel corpus would also impact the sults obtained in this study, and more experiments are re-quired to claim for the robustness of our approach. As future work, we would like to investigate the use of a
more diverse feature set, containing linguistic information such as part-of-speech and syntax, which were shown to perform well in recent QE studies. Several aspects of the QE setup are still unclear, for instance the performance of individual features or feature subsets. It is possible that some features are noisy or redundant which motivates an automatic feature evaluation and selection approach.
Acknowledgements
The research leading to these results has received fund-ing from the European Association for Machine Trans-lation through its 2011 sponsorship of activities program and from the European Union Seventh Framework Pro-gramme FP7/2007-2013 under grant agreement PIAP-GA-2012-324414 (Abu-MaTran).
6.
References
Avramidis, E. (2013). Sentence-level ranking with quality estimation. Machine translation, 27(3-4):239–256. Banerjee, P., Rubino, R., Roturier, J., and van Genabith, J.
(2013). Quality estimation-guided data selection for do-main adaptation of smt. InMachine Translation Summit XIV, pages 101–108.
Bertoldi, N., Barbaiani, M., Federico, M., and Cattoni, R. (2008). Phrase-Based Statistical Machine Transla-tion with Pivot Languages. InProc. of the International Workshop on Spoken Language Translation, pages 143– 149, Hawaii, USA.
Blatz, J., Fitzgerald, E., Foster, G., Gandrabur, S., Goutte, C., Kulesza, A., Sanchis, A., and Ueffing, N. (2003). Confidence Estimation for Machine Translation. In
JHU/CLSP Summer Workshop Final Report.
of the Seventh Workshop on Statistical Machine Transla-tion, pages 10–51.
Chang, C.-C. and Lin, C.-J. (2011). Libsvm: a library for support vector machines. ACM Transactions on Intelli-gent Systems and Technology (TIST), 2(3):27.
Forcada, M. L., Ginest´ı-Rosell, M., Nordfalk, J., O’Regan, J., Ortiz-Rojas, S., P´erez-Ortiz, J. A., S´anchez-Mart´ınez, F., Ram´ırez-S´anchez, G., and Tyers, F. M. (2011). Aper-tium: a free/open-source platform for rule-based ma-chine translation.Machine Translation, 25(2):127–144. Gandrabur, S. and Foster, G. (2003). Confidence
Estima-tion for TranslaEstima-tion PredicEstima-tion. In CoNLL, pages 95– 102.
Gispert, A. D. and Mari˜no, J. B. (2006). Statistical machine translation without parallel corpus: bridging through spanish. InProcessdings of LREC 5th Workshop on Strategies for developing Machine Translation for Mi-nority Languages, pages 65–68.
Koehn, P., Hoang, H., Birch, A., Callison-Burch, C., Fed-erico, M., Bertoldi, N., Cowan, B., Shen, W., Moran, C., Zens, R., et al. (2007). Moses: Open source toolkit for statistical machine translation. InProceedings of the 45th Annual Meeting of the ACL on Interactive Poster and Demonstration Sessions, pages 177–180.
Koehn, P. (2004). Statistical significance tests for machine translation evaluation. InEMNLP, pages 388–395. Koehn, P. (2005). Europarl: A parallel corpus for
statisti-cal machine translation. InMT summit, volume 5. Lavie, A. and Denkowski, M. J. (2009). The meteor
met-ric for automatic evaluation of machine translation. Ma-chine Translation, 23(2-3):105–115, September. Ljubeˇsi´c, N. and Erjavec, T. (2011). hrWaC and slWac:
Compiling web corpora for Croatian and Slovene. In Habernal, I. and Matousek, V., editors,Text, Speech and Dialogue - 14th International Conference, TSD 2011, Pilsen, Czech Republic, September 1-5, 2011. Proceed-ings, Lecture Notes in Computer Science, pages 395– 402. Springer.
Okita, T., Rubino, R., and van Genabith, J. (2012). Sentence-Level Quality Estimation for MT System Com-bination. InML4HMT-12 Workshop, page 55.
Papineni, K., Roukos, S., Ward, T., and Zhu, W.-J. (2002). Bleu: A method for automatic evaluation of machine translation. InProceedings of the 40th Annual Meeting on Association for Computational Linguistics, ACL ’02, pages 311–318, Stroudsburg, PA, USA. Association for Computational Linguistics.
Quirk, C. (2004). Training a Sentence-Level Machine Translation Confidence Measure. InLREC, pages 825–
828.
Raybaud, S., Langlois, D., and Sma¨ıli, K. (2011). ”This Sentence is Wrong.” Detecting Errors in Machine-Translated Sentences. Machine Translation, pages 1–34. Rubino, R., Foster, J., Kaljahi, R. S. Z., Roturier, J., and Hollowood, F. (2013). Estimating the quality of trans-lated user-generated content. In6th International Joint Conference on Natural Language Processing (IJCNLP), pages 1167–1173.
S´anchez Mart´ınez, F. (2011). Choosing the Best Machine Translation System to Translate a Sentence by Using Only Source-language Information. InEuropean Asso-ciation for Machine Translation, pages 97–104.
Shah, K., Cohn, T., and Specia., L. (2013). An inves-tigation on the effectiveness of features for translation quality estimation. InMachine Translation Summit XIV, pages 167–174.
Snover, M., Dorr, B., Schwartz, R., Micciulla, L., and Makhoul, J. (2006). A study of translation edit rate with targeted human annotation. In Proceedings of associa-tion for machine translaassocia-tion in the Americas, pages 223– 231.
Soricut, R., Bach, N., and Wang, Z. (2012). The SDL Lan-guage Weaver Systems in the WMT12 Quality Estima-tion Shared Task. InWMT, pages 145–151.
Specia, L., Turchi, M., Cancedda, N., Dymetman, M., and Cristianini, N. (2009). Estimating the Sentencel-Level Quality of Machine Translation Systems. In EAMT, pages 28–35.
Stolcke, A., Zheng, J., Wang, W., and Abrash, V. (2011). Srilm at sixteen: Update and outlook. InProceedings of IEEE Automatic Speech Recognition and Understanding Workshop, page 5.
Ueffing, N., Macherey, K., and Ney, H. (2003). Confi-dence Measures for Statistical Machine Translation. In
MT Summit.
Utiyama, M., Finch, A., Okuma, H., Paul, M., Cao, H., Ya-mamoto, H., Yasuda, K., and Sumita, E. (2008). The NICT/ATR Speech Translation System for IWSLT 2008. InProc. of the International Workshop on Spoken Lan-guage Translation, pages 77–84, Hawaii, USA.