Vol. 5, Issue 5, May 2016
Diagnosed Transformer Insulating Oil with
On & Off – Line Data Simultaneously
Ming-Jong Lin1, Jeeng-Min Ling2
Department of Electronic Engineering, Southern Taiwan University of Science and Technology, Tainan City, Taiwan (R.O.C)1
Department of Electrical Engineering, Southern Taiwan University of Science and Technology, Tainan City, Taiwan (R.O.C)2
ABSTRACT: The transformer plays an important role in electrical power systems and thedegradation of transformer’s
insulating oilwill affect the transformer performance.Currently, thewidely used diagnostic approaches of transformer insulating oil are divided into “on-line monitoring – instantly detecting” and “off-line – periodic detecting” categories. In the on-line monitoring methodology, thetransformer’s insulating oil is being checked all the time; its main function is to explore the abnormal symptoms in the first time. This paper described a diagnostic method, an abnormal message was picked from on-line monitor, and then diagnosed the insulating oil which was taken from off-line via decomposition chromatography (ASTM -D3612) As a result, and it achieves the purpose of dual detecting so more accurate of diagnosis to reduce maintenance costs. In this paper, the ANSI/IEEE C57.104 specification is proposed to be used as a diagnosticmerit. Based on the ANSI/IEEE C57.104 specification,a mechanism is therefore established to diagnose on-line monitored data. The advantage of diagnostic method, transforms the data of monitor to the ANSI/IEEE C57.104 specification to developa program to compare with the data of on and off - line to generate the diagnosis of the text of the ANSI/IEEE C57.104 specification and figures of comparing. Validity of the developed diagnosis method is verified by some practical cases. This paper used existing equipment to do the most effective and accurate diagnosis from the periodic detecting of prevents maintenance change to the condition based maintenance.
KEYWORDS:Immersed-Oil Transformer, Dissolved Gas Analysis (DGA), On-line Monitor, Condition Based
Maintenance (CBM).
I.INTRODUCTION
Electrical technicians must deal with a large amount of data which was taken from on–line monitor on transformer’s monitoring so that they can diagnose the transformer’s operating condition. If a failure of transformer occurs, it will lead to trip and affect the power system of reliability. What, Dissolved Gas Analysis is a well-known and practical technique to diagnose the incipient fault in transformer’s insulating oil. Several diagnostic techniques have been proposedsince 1950’s such as Total Combustible Gas, Doernenburg Ratio Method, Rogers Ration Method, Duval Triangle Method, and the Linear SVM Methodetc. From limited the testing of laboratory up to site on-line monitor. Among of thosediagnostic approaches has a pro and coin in, but the ANSI/IEEE C57.104 specification is regards criterion certain. As to how to be effective and accurate analysis is an important task for the technician. After lengthy research and investigation, the optimistic approach was developed from the routine analytic works. When transformer has been operated a long time, the insulating oil should be inspected from Chromatography instrument to identify dissolved gas analysis, such as ethane (C2H6), hydrogen (H2), methane (CH4), carbon dioxide (CO2), ethylene (C2H4),
acetylene (C2H2), carbon monoxide (CO), nitrogen (N2), and oxygen (O2). From the relative proportion of these gases,
incipient faults can be detected; thus, the quality of the insulating oil is linked to the security of the electricity supply. An accurate diagnosis is not only associated with the time and cost of maintenance, but also avoids the occurrence of transformer faults. On based the reason, we research a lot of information from the factory of electrical equipment which had produced “on-line monitor” [1].This paper compiles the character of the on-line monitor and the ANSI/IEEE C57.104 specification and the applicative program of MATLAB to establish an optimistic diagnosis tool.
II.GASES FROM INSULATING OIL
Vol. 5, Issue 5, May 2016
the transformer insulating oil. The symptom of electrical fault, mal-fault, and aging were formed, depending on the complexity of the construction and these concentrated such H2, CH4, C2H6, C2H4, C2H2, CO,and CO2. The relationship
is been linked the fault status with the kind of gas which is listed in Table 1.
Table1.Gases Occurring in Insulating Oil
Gases of generation H2 CH4 C2H6 C2H4 C2H2CO CO2
Electrical-fault
Insulating oil
Corona PDs ☆ ○
Arc + sparking ☆ ○ ☆
Insulating paper ○
Mal-fault
Insulating oil
Low temperature ○ ☆ ☆
Mid & high temperature ○ ○ ☆
700 ℃or higher ○ ☆ ○
Insulating paper ☆ ○
Aging
Insulating oil ○ ☆
Insulating paper ○ ☆ ☆: High importance ○: Medium importance
III. SPECIFICATION TRANSFORMATIONS FOR ON-LINE MONITORING
The ANSI/IEEE C57.104 specification is widely adopted as the criteria for diagnosing transformer insulating oil [2]. The specification of eachgas content value is divided into four conditions – danger, abnormal, attention, and normal which is listed in Table 2, then these gases content value again are transformed into the new specification of monitoring by the proper rate of senor character, on the basis of the ANSI/IEEE C57.104 specification, we can infer the quantities of monitoring criteria that must equal one, although the monitor only analysed H2, C2H4, C2H2, and CO; thus, the
results of the diagnosis are somewhat of difference.
Table2. ANSI / IEEE C57.104 Specification
Name Content
value(ppm) Property Name
Content
value(ppm) Property
H2
> 1801 Danger
CH4
>1001 Danger
> 701 Abnormal >401 Abnormal
> 101 Attention >121 Attention
< 100 Normal <120 Normal
C2H6
>151 Danger
C2H4
> 201 Danger
> 101 Abnormal > 101 Abnormal
>66 Attention > 51 Attention
<65 Normal < 50 Normal
C2H2
> 35 Danger
CO
> 1400 Danger
> 10 Abnormal > 571 Abnormal
> 2 Attention > 351 Attention
Vol. 5, Issue 5, May 2016
Table 3. Monitor Specification
Property
Composite of Gases
Total(ppm) H2*1+CO*0.15+C2H2*0.08+C2H4*0.015
Danger 1801*1+1400*0.15+35*0.08+201*0.015 > 2016
Abnormal 701*1+571*0.15+10*0.08+101*0.015 > 789
Attention 101*1+351*0.15+2*0.08+51*0.015 > 155
Normal 100*1+350*0.15+1*0.08+50*0.015 < 154
For clarification, the monitor specification wasagain classified into fourintervals-Normal, Attention, Abnormal, and Danger, as listed in Table 3.
IV. DIAGNOSIS FLOW CHART
The Transformer insulating oil was monitored on-line around the clock (instant) for diagnosis.A message was sent to technician as the value of on-line monitor excelled 155 ppm. Technicians relied on the abnormal message to take the transformer insulating oil from off-line while sent it via Chromatography instrument to dissolve, after according gases concentration to double check up what condition in.
The transformer’s insulating oil
On-line Monitor
Display value >155 ppm off-line data
Via decomposition Chromatography
The advantages of diagnostic program by MATLAB
1. The data of monitor transforms to the ANSI/IEEE C57.104 specification. 2.To compare with the testing’s value and the danger of level of the
ANSI/IEEE C57.104 specification
The result of diagnosis is shown with text and comparative figures
Figure 1. Diagnosis flow chart
These steps can fulfil the policy of the condition based maintenance. This study is provided an applicative program of MATLAB to compare and analyse with the monitor’s value and the ANSI/IEEE C57.104 specification to generate the texts and comparative figure of diagnosis immediately. The flow chart was shown in Figure 1.
V. MONITOR SENSOR
The monitor sensor is a patented device, which can detect by its constructive character to analysethe content of H2,
C2H2, C2H4, and CO, etc. from inside the transformer insulating oil for diagnosis.
Vol. 5, Issue 5, May 2016
1.Sensor Transformation
The basic principle of the on-line monitoring operation is illustrated in the schematic diagram of Figure 2, which shows that the hydrogen emitted from the oil permeates through a membrane and reacts with the atmospheric oxygen, resulting in the generation of a small current, the value of current depend on the concentration of H2, C2H2, C2H4, and
CO by the equation of composite of gases to sum up. This current through R produces a voltage source ( ), which .is amplified by electronic circuits, and translated into a quantity on the display and memory in [3].
Figure 2. Monitoring principle schematic diagram [3] 2.Detection Gases
The on-line monitor is currently one of the most popular diagnostic devices for transformer insulating oil in power system. Though the monitor sensor only takes those gases -H2, CO, C2H2, and C2H4, etc. but it must rely upon the special
character of matter todetect operated-transformer insulating oil instantly.
The quantity of each gas is composed from different ratio which is shown in Table 4 [4 - 5]. In the fig 1, it shows the graph of time Vs throughput of receiving packet. Throughput is the average rate of successful message delivery over a communication channel.
Table4. Detection Gases for Monitor Sensor
Gas Concentration
Hydrogen (H2) 100 %
Carbon monoxide (CO) 15 ± 3 %
Acetylene (C2H2) 8 ± 2 %
Ethylene (C2H4) 1.5 ± 0.5 %
Ⅵ. DIAGNOSTIC PROGRAM
An optimistic diagnosis program was designed for the accuracy of diagnosis so that the gases were taken from the off-line while the on-off-line monitor sent an abnormal message. In addition to the original display, this program adds more than a textual analysis and graphical comparison, the figure was shown two lines – red and blue, the red line for the danger of level in the ANSI/IEEE C57.104 specification, the blue line for the value of testing [6].
This program of MATLAB software is not only easy to preform, but meets the ANSI/IEEE C57.104 specification Teflon Membrane Porous electrodes
Air(O2)
Transformer Oil H2
Electrolyte (50%H2,SO4)
I
Vol. 5, Issue 5, May 2016
requisitely. In this study, the most significant feature is the diagnostic result shown by texts and figures in Table 5[7]. Table5. Report Form of Diagnosis unit: ppm
Case Result of Diagnosis for texts and figures State
A
T = the value of the (H2+CO+C2H2+C2H4);T = 938.8
MT = the value of monitor; MT = 398.7
H2 = 323.0; CO = 459.0; C2H2 = 69.8; C2H4 = 87.0
H2 ==【Attention】
CO ==【Attention】
C2H2 ==【Danger】
C2H4 ==【Attention】
NVTC Ace
Ⅶ. VERIFICATION
For ensuring the diagnostic approach took some case to verification that will describe below: 1.Some cases
For comparison, took three out form a huge cases, these represents were A, B, and C cases. These reports of maintenance and the result of diagnosis from the applicative program to go on analyze and compare which were shown clearly in Table 6.
Table 6. Some Cases and Results of Diagnosis unit: ppm
Case Result of Diagnosisfor texts and figures State
A
T = the value of the (H2+CO+C2H2+C2H4);T = 938.8;
MT = the value of monitor; MT = 398.7
H2 = 323.0; CO = 459.0; C2H2 = 69.8; C2H4 = 87.0
H2 ==【Attention】
CO ==【Attention】
C2H2 ==【Danger】
C2H4 ==【Attention】
NVTC Ace
( (H2)0 (CO) (C2H2) (C2H4)
100 200 300 400 500 600 700 800
the Red Line for Danger of the ANSI/IEEE C57.104 Specification; the Blue Line for testing
p
p
m
( (H2)0 (CO) (C2H2) (C2H4)
100 200 300 400 500 600 700 800
the Red Line for Danger of the ANSI/IEEE C57.104 Specification; the Blue Line for testing
p
p
Vol. 5, Issue 5, May 2016
B
T = the value of the (H2+CO+C2H2+C2H4);T = 887.6 ;
MT = the value of monitor; MT = 194.0
H2 = 174.0; CO = 68.0; C2H2 = 2.6; C2H4 = 643.0
H2 ==【Attention】
CO ==【Normal】
C2H2 ==【Attention】
C2H4 ==【Danger】
Screw melting
C
T = the value of the (H2+CO+C2H2+C2H4);T = 73.1
MT = the value of monitor; MT =13.3 H2 = 11; CO = 7.0; C2H2 =7.1;C2H4 = 48.0
H2 ==【Normal】
CO ==【Normal】
C2H2 ==【Attention】
C2H4 ==【Normal】
Normal
2. Verification
For verific
ation,
the data of on–line monitor was taken from the transformer of substation in Taiwan Power Company. The resultof each data was careful processed via the program to diagnose.From an enormous amount of the data of on-line monitor, three cases were takenfor representto prove the diagnostic tool is feasible and practical. Those cases, one was normal condition and the others abnormal condition that they were shown to describe the overhaul of transformer before and after. Then, the recordingpatterns of data of the on-line monitor were recorded from abnormal to normal condition or normal to abnormal condition, asshown below.
Case A,the quantity of monitor from 100 to rise up to 400 ppm was found on January 28, 2015, because the quantity exceeded 155 ppm, so that the equipment emitted an alarm of message to the technician,as shown in figure 4,. Next the sample of insulating oil was taken from transformer and sent to laboratory detection for dissolved gas analysis, the result of diagnosis, H2, CO2, C2H4 of content belonged attention and C2H2 belonged danger level from the data of dissolved gas
analysis, it must to shot down to repair instantly. The result of maintenance,a fault-mark with Ace on a contractor wasfound.
( (H2)0 (CO) (C2H2) (C2H4)
100 200 300 400 500 600 700 800
the Red Line for Danger of the ANSI/IEEE C57.104 Specification; the Blue Line for testing
p
p
m
( (H2)0 (CO) (C2H2) (C2H4)
100 200 300 400 500 600 700 800
the Red Line for Danger of the ANSI/IEEE C57.104 Specification; the Blue Line for testing
p
p
Vol. 5, Issue 5, May 2016
Figure 4. Record form of monitor for case A
Then Case B was diagnosed the quantity of monitor that sustained 300 ppmon October 19, 2012, the process of on-line monitor detected alike Case A to inform technician thus the transformer was shut down to repair which was a screw yielded melting of failure as after repair the quality down from previous 300 to 20 ppm. As shown in Figure 5.
Figure 5. Record form of monitor for case B
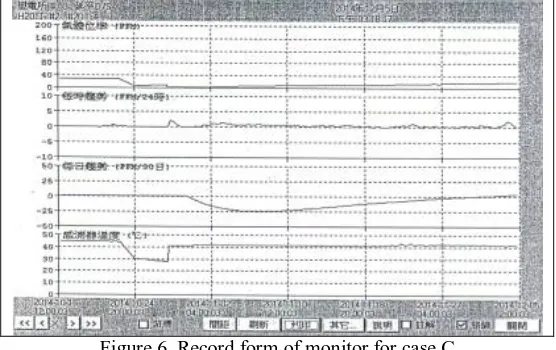
Case C was a transformer that operated at normal of condition from the display of on-line monitor the quantity of monitorwas10 ppmon November 25, 2014.As shownin figure 6.
Figure 6. Record form of monitor for case C
Vol. 5, Issue 5, May 2016
Figure 7.The point of Incipient fault for case B
Ⅷ. ADVANTAGES
Except the original function, the optimal program has been dedicated to the text of diagnosis and the figure of comparison for the ANSI/IEEE C57.104 specification to analyze and diagnose. Before and after, the comparative analysis of diagnosis was described belowin Table 7:
Table7. Compare with before and after for the diagnosis of insulating oil Before the diagnosis of
insulating oil
After the diagnosis of
insulating oil Difference
Display data Display data Same
Data Storage Data Storage Same
Provides alarm Provides alarm Same
/ Text Provided diagnostic text
/ Graphics Comparison
Provide comparative figure for dangerous values of ANSI/IEEE C57.104
specification After the diagnosis of insulating oilfor text and figures and monitor T = (H2+CO+C2H2+C2H4)= 938.8; MT = 398.7;H2 =
323.0; CO = 459.0; C2H2 = 69.8; C2H4 = 87.0
H2 ==【Attention】CO ==【Attention】
C2H2 ==【Danger】C2H4 ==【Attention】
The window of monitor shows 400 ppm (Case A)
( (H2)0 (CO) (C2H2) (C2H4)
100 200 300 400 500 600 700 800
the Red Line for Danger of the ANSI/IEEE C57.104 Specification; the Blue Line for testing
p
p
Vol. 5, Issue 5, May 2016
Ⅸ. SUMMARY
The on–line monitoris instantly diagnostic equipment on transformer insulating oil that its main function is to explore the abnormal symptoms in the first time;next taking the data from off-line to go on double checkat the same time, the goal of diagnosis is more effective and accurate to perform dissolved gasanalysis. Although it can only detect H2, CO,
C2H2, andC2H4 but it is consistent with the ANSI/IEEE C57.104 specification was used as a comparative analysis so that
can show the text and figure of the result of diagnosis. The program is verified from some practical cases of fault-transformer in Taiwan Power Company. From this study, we can recognize that isa feasible,accurate, and effectivediagnosis tool on transformer insulating oil.From previously described, this study can fulfill the policy of diagnosis from the periodic detecting of prevents maintenance change to the condition based maintenance. So that I predict on–line and off-line dissolved gas analysis simultaneouslywill be a trend in detection oftransformer insulating oil in the future.
ACKNOWLEDGMENT
The author would like to acknowledgethat the relevant information of this paper was provided by the department of the supply, Jianan Power Supply Branch, and Research Institute of Taiwan Power Company.
REFERENCES
[1]https://www.gedigitalenery.com/products/brochures/MD/Hydran_201Ti
[2]IEEE C57.104 .,“IEEEGuide for the Interpretationof Gases Generated in Oil - Immersed Transformers”, Minutes of WG Meeting Nashville, Tennessee, USA, March 13, 2012.
[3] Abu, Bakar. Norazhar., and Abu, Siada.Ahmed., “High Voltage PowerTransformer Dissolved Gas Analysis,Measurement and InterpretationTechniques”, High Voltage Maintenance Forum (Conference), Nov.27-28, pp.5, 2013.
[4] Shahbazi.,“Transformer condition monitoring system for smart grid”, Control, Instrumentation and Automation (Conference), 2nd, pp.32-37, 2011.
[5]Bing ha m, R P., “ Mea su r e m en t i n str u m en ts for p o wer qu a lit y m oni tor i ng” , T r a ns mi s si on a nd D i str i bu tio n C on f er en c e a n d Exposition,T&D.IEEE/PES(Journal). 21-24, pp.1-3, 2008.
[6]Ming, Jong. Lin., and Chao ,Tang . Yu ., “C A Pragmatic Approach to Diagnose on Transformer's Insulating Oil with Gas Pattern”, IEEE Transactions on Knowledge and Data Engineering(Conference), Vol.11, pp.94-107, 2009.
[7] https://www.gedigitalenergy.com/md/catalog/hydran201Ti.htm
[8] Y , G . Qi ., L , K . Ming ., G. , B . Sing ., S. , U . Sung .,and S, Xia., “Nan Ke E/S#4ATr Overhaul Report”, Taiwan PowerCompany Institute , Nov.12, pp.12-18, 2012.
BIOGRAPHY
Ming-Jong Linreceived the Junior College degree in Electronic engineering in1977, the Bachelor of degree of Department of Applied Englishin 2002, the Master of degree from the Department of Electrical engineering in 2010from Southern Taiwan University of Science and Technology, Taiwan, andcurrently has taking the Ph.D. degree in Southern Taiwan University of Science and Technology from 2011. So far He has worked as an Electrical engineer in Taiwan Power Company from 1979;His research interests include powertransformer condition monitoring and application ofanalysis to power systems.

![Figure 2. Monitoring principle schematic diagram [3]](https://thumb-us.123doks.com/thumbv2/123dok_us/7777913.1283405/4.595.166.432.227.434/figure-monitoring-principle-schematic-diagram.webp)