ISSN (Print) : 2320 – 3765 ISSN (Online): 2278 – 8875
I
nternational
J
ournal of
A
dvanced
R
esearch in
E
lectrical,
E
lectronics and
I
nstrumentation
E
ngineering
(An ISO 3297: 2007 Certified Organization)
Website: www.ijareeie.com
Vol. 6, Issue 7, July 2017
Use Fuzzy Rules and Experimental Design to
Predict and Improve Output Performance of
Three-Phase Inductive Motor
Hamza R Saad
Ph.D. Candidate, Dept. of System Science and Industrial Engineering, SSIE, Binghamton University,
State University of New York
ABSTRACT: Surface design and Fuzzy logic used to find the best performance for three phase inductive motor. Three factors, voltage, power factor, and current used as inputs and two responses are exploited power P and apparent power S used as dependents. First, thefuzzy logic used to extract 13 rules to predict the output. However, as soon as rules ready the values of apparent power S and real exploited power can be changed according to any change in the input variables but without understanding the real action in the process. The surface design used to enhance and diagnosis these rules in experimental form. In anattempt to modify fuzzy rules in experimental design, independent factors or left hand taken without any change but in dependent responses or right hand, electrical power equations used to get the exact response for understanding the whole process according to experimental design then it validated by thetesting machine. Fuzzy logic follows IF THEN statement but in thedesign of experiment to mimic these rules; the same conception will be used by classifying the response or output to low and high levels according to the required design. For exploited power, values equal or less than 1497.96 W classified as low level and values of equal or greater than 1539W classified as high level, whereas, in apparent power, values equal or less than 1620 VA classified as low level and values equal or greater than 3942 VA classified as ahigh level. For two responses, Apparent power S did not give significant results because of standard errors equal to zero and observed values equal to predicted values. Therefore no residual values found in theresults. However, from theresponse of real exploited power P, power factor and current have a very significant important and interactions as well, whereas, voltage factor gavethe lowest significant and bad interaction between current or power factor. Paper concluded that to improve theperformance of machine power factor can be improved by modifying thecurrent variable.
KEYWORDS, Fuzzy logic, experimental design, three-phase inductive motor, electrical equations
I.INTRODUCTION
In industry field, machines play a vital role in production and manufacturing. Most of the electrical loads in Libyan industry field are inductive loads; this means a power factor is leading, and waste power will be changed according to power factor values. Power factor might be lagging or leading according to loads characteristics. To decreasepower waste, we must improve power factor value. If current andvoltageare in one path, then power factor COS 0 will be 1 and waste will be zero because of real exploited power P is equal to apparent power S.
In this study, power factor supposed to use as a response but it selected as a factor to build a design that gives high energy output by respecting values of current and voltage. When machine works, we have to build many rational guesses. Fuzzy logic is a good method to build rules that relate to real machine situation. Three phase inductive motor has been selected to study machine characteristics and find the optimum performance according to the study of theoutput of fuzzy rules, main effect, and a significant interaction between factors.
ISSN (Print) : 2320 – 3765 ISSN (Online): 2278 – 8875
I
nternational
J
ournal of
A
dvanced
R
esearch in
E
lectrical,
E
lectronics and
I
nstrumentation
E
ngineering
(An ISO 3297: 2007 Certified Organization)
Website: www.ijareeie.com
Vol. 6, Issue 7, July 2017
low, andit has a low response as well because it is different between apparent power and real exploited power. This paper predicted the output using fuzzy logic and experimental design used to diagnosis extracted rules by getting the main effects and interactions.By manipulating in the rules, many results for P and S but this is not enough to understand the process and get the improvements. the experimental design selected as a good tool to understand themachine and find the best factor which makes the improvements.
II.PROBLEM STATEMENT
Machines in Libyan factoriesare slow and old. There is a big gap between real or exploited power (P) and apparent power (S) led to a big waste ofthe energy. Power factor (PF) is very important factor to reduce waste power and improve theefficiency of machines.The fuzzy logic used to predict output and experimental design used to diagnosis rules in experimental form.
III
.
METHODOLOGY1- Extract rules using fuzzy logic voltage, Current, and Power factor as factors or inputs and apparent power, and real or exploited power as responses or dependents). Build membership function to predict the outputs. 2- Electrical equations for apparent power and exploited power used to find output mathematically and validate
data using thereal machine.
3- Use experimental design to diagnosis these rules in experimental form and study the main effects and interactions(design constructed according to the same rules).
ISSN (Print) : 2320 – 3765 ISSN (Online): 2278 – 8875
I
nternational
J
ournal of
A
dvanced
R
esearch in
E
lectrical,
E
lectronics and
I
nstrumentation
E
ngineering
(An ISO 3297: 2007 Certified Organization)
Website: www.ijareeie.com
Vol. 6, Issue 7, July 2017
Figure1, methodology to improve output
IV.FUZZY RULES USING MATLAB
ISSN (Print) : 2320 – 3765 ISSN (Online): 2278 – 8875
I
nternational
J
ournal of
A
dvanced
R
esearch in
E
lectrical,
E
lectronics and
I
nstrumentation
E
ngineering
(An ISO 3297: 2007 Certified Organization)
Website: www.ijareeie.com
Vol. 6, Issue 7, July 2017
Name='power_factor' Range=[0.3 0.95] NumMFs=2
MF1='LOW':'trimf',[0.0434428571428572 0.303542857142857 0.563542857142857] MF2='HIGH':'trimf',[0.691719576719577 0.951719576719577 1.21171957671958] [Input2]
Name='current (I)' Range=[2.4 6] NumMFs=2
MF1='LOW':'trimf',[0.950095238095238 2.39009523809524 3.83009523809524] MF2='HIGH':'trimf',[4.55952380952381 5.99952380952381 7.43952380952381] [Input3]
Name='voltage (V)' Range=[657 675] NumMFs=2
MF1='LOW':'trimf',[649.466666666667 656.666666666667 663.866666666667] MF2='HIGH':'trimf',[667.847619047619 675.047619047619 682.247619047619] [Output1]
Name='apparent_power' Range=[486 3848] NumMFs=2
MF1='LOW':'trimf',[-876.577777777778 468.522222222222 1812.22222222222] MF2='HIGH':'trimf',[2547.75661375661 3892.75661375661 5236.75661375661] [Output2]
Name='exploited_power' Range=[1620 4050] NumMFs=2
MF1='LOW':'trimf',[648.042857142857 1620.14285714286 2592.14285714286] MF2='HIGH':'trimf',[3080.71428571429 4060.71428571429 5030.71428571429]
V. EXTRACTED RULES USING MATLAB
IF (Power factor (PF) is LOW) (current (I) is LOW) and (voltage (V) is LOW) then (apparent power is LOW) (exploited power is LOW)
IF (Power factor (PF) is LOW) (current (I) is HIGH) and (voltage (V) is LOW) then (apparent power is HIGH) (exploited power is LOW)
IF (Power factor (PF) is LOW)(current (I) is HIGH) and (voltage (V) is HIGH) then (apparent power is HIGH)(exploited power is LOW)
IF (Power factor (PF) is HIGH) (current (I)is LOW) and (voltage (V) is LOW) then (apparent power is LOW) (exploited power is LOW)
IF (Power factor (PF) is HIGH) (current (I) is HIGH) and (voltage (V) is LOW) then (apparent power is HIGH) (exploited power is HIGH)
IF (Power factor (PF) is HIGH) (current (I)isHIGH)and(voltage (V)isHIGH)then(apparent powerisHIGH) (exploited powerisHIGH)
IF (Power factor (PF) is HIGH) (current (I)is LOW) and (voltage (V) is HIGH) then (apparent power is LOW) (exploited power is HIGH)
IF (Power factor (PF) is LOW) (current (I)is LOW) and (voltage (V) is HIGH) then (apparent power is LOW) (exploited power is LOW)
IF (Power factor (PF) is LOW) (current (I)is HIGH) and (voltage (V) is HIGH) then (apparent power is HIGH) (exploited power is LOW)
ISSN (Print) : 2320 – 3765 ISSN (Online): 2278 – 8875
I
nternational
J
ournal of
A
dvanced
R
esearch in
E
lectrical,
E
lectronics and
I
nstrumentation
E
ngineering
(An ISO 3297: 2007 Certified Organization)
Website: www.ijareeie.com
Vol. 6, Issue 7, July 2017
IF (Power factor (PF) is HIGH)(current (I)isHIGH)and(voltage (V)isLOW)then(apparent powerisHIGH) (exploited powerisHIGH)
IF(Power factor (PF) is HIGH) (current (I)isHIGH)and(voltage (V)isHIGH)then(apparent powerisHIGH) (exploited powerisHIGH)
IF (Power factor (PF) is HIGH) (current (I)isLOW)and(voltage (V)isHIGH)then(apparent powerisLOW) (exploited powerisHIGH)
VI. CENTRAL DESIGN, NON-FACTORIAL, SURFACE DESIGN
Now, build experimentaldesign with the same rules to diagnosis predicted output performance.the design of experiment (central design, non-factorial, surface design), but some considerations must be taken bygetting the real responses for right-hand rules then classify them low and high level according to the response values.
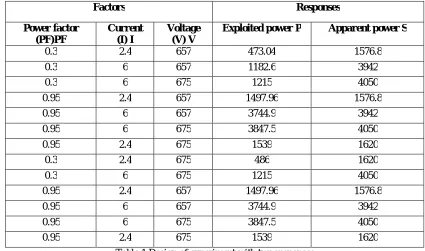
Factors Responses
Power factor (PF)PF
Current (I) I
Voltage (V) V
Exploited power P Apparent power S
0.3 2.4 657 473.04 1576.8 0.3 6 657 1182.6 3942 0.3 6 675 1215 4050 0.95 2.4 657 1497.96 1576.8 0.95 6 657 3744.9 3942 0.95 6 675 3847.5 4050 0.95 2.4 675 1539 1620 0.3 2.4 675 486 1620 0.3 6 675 1215 4050 0.95 2.4 657 1497.96 1576.8 0.95 6 657 3744.9 3942 0.95 6 675 3847.5 4050 0.95 2.4 675 1539 1620
Table 1 Design of experiment with two responses
Values of apparent power and exploited power found using equations of
P = V * I * COSθ………..(1) for exploited power.And
S = V * I …...(2) for apparent power.
And validated using real testing of selected machine.
VII. RESULTS AND DISCUSSION
We did not get any effect from S or apparent power response because of observed values equal to predicted values and no residuals found, then standard errors equal to zero. Thus, we focused the solution on P or real exploited power as output to evaluate interactions and main effects.
ISSN (Print) : 2320 – 3765 ISSN (Online): 2278 – 8875
I
nternational
J
ournal of
A
dvanced
R
esearch in
E
lectrical,
E
lectronics and
I
nstrumentation
E
ngineering
(An ISO 3297: 2007 Certified Organization)
Website: www.ijareeie.com
Vol. 6, Issue 7, July 2017
Factor Effect Std.Err t(6) P -95.% Cnf.Lim
+95.%
Cnf.Lim Coeff.
Std.Err Coeff.
-95.% Cnf.Lim
+95.% Cnf.Lim
Mean/interact 1747.771 2.140527 816.5146 0.000000 1742.534 1753.009 1747.771 2.140527 1742.534 1753.009
(1) PF(L) 1819.137 4.281054 424.9275 0.000000 1808.662 1829.613 909.569 2.140527 904.331 914.806
(2) I (L) 1497.543 4.281054 349.8070 0.000000 1487.067 1508.018 748.771 2.140527 743.534 754.009
(3) V(L) 9046.293 4.281054 10.8134 0.000037 35.817 56.768 23.146 2.140527 17.909 28.384
1L by 2L 780.177 4.281054 182.2395 0.000000 769.702 790.653 390.089 2.140527 384.851 395.326
1L by 3L 25.527 4.281054 5.9628 0.000996 15.052 36.003 12.764 2.140527 7.526 18.001
2L by 3L 23.122 4.135891 5.5905 0.001393 13.002 33.242 11.561 2.067945 6.501 16.621 Table 2 Effect estimates
Power factor (PF) has effect 1819.137, current (I) 1497.543, and voltage (V) 9046.293 with the same standard errors. Voltage has the greatest effect, but also it has the lowest interaction. The best interaction is between current and power factor 1L by 2L. therefore, voltage is an important factor for itself, whereas power factor and currenthavesignificant interactions. However, according to the P value in the table, power factor, Current, and interaction between power factor and current have significant effect whereas less effect came from Voltage whetherthe main effect or its interactions.
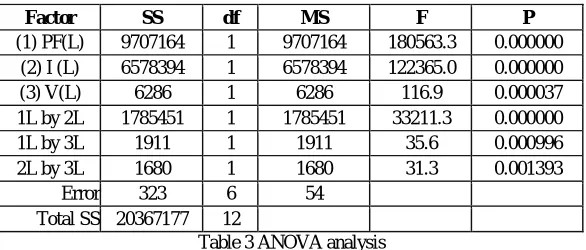
ANOVA;Var.: P; R-sqr=.99998; Adj.99997 3 factors, 1 Blocks, 13 Runs; MS Residual=53.76044
Factor SS df MS F P
(1) PF(L) 9707164 1 9707164 180563.3 0.000000 (2) I (L) 6578394 1 6578394 122365.0 0.000000
(3) V(L) 6286 1 6286 116.9 0.000037
1L by 2L 1785451 1 1785451 33211.3 0.000000
1L by 3L 1911 1 1911 35.6 0.000996
2L by 3L 1680 1 1680 31.3 0.001393
Error 323 6 54
Total SS 20367177 12
Table 3 ANOVA analysis
In ANOVA table, the best sum of square got from power factor, and the worst sum of square got from the interaction between power factor and voltage. Power factor, current, and interaction between power factor and current gave a significant importance. Voltage and its interactions gave a bad important. So, P value doesn’t change from table 2.
Regression.
CoefficientsVar.:P; R-sqr=.99998; Adj:.99997 3 factors, 1 Blocks, 13 Runs; MS Residual=53.76044 DV: Exploited power P
Factor Regression
Coeff. Std.Err t(6) P
-95.% Cnf.Lim
+95.% Cnf.Lim Mean/interact 2101.58 541.9887 3.8775 0.008194 775.38 3427.78
(1) PF(L) -2908.15 486.8106 -5.9739 0.000987 -4099.33 -1716.96
(2) I (L) -476.06 85.3025 -5.5808 0.001405 -684.79 -267.33
(3) V(L) -3.15 0.8140 -3.8729 0.008238 -5.14 -1.16 1L by 2L 666.82 3.6590 182.2395 0.000000 657.86 675.77 1L by 3L 4.36 0.7318 5.9628 0.000996 2.57 6.15 2L by 3L 0.71 0.1277 5.5905 0.001393 0.40 1.03
ISSN (Print) : 2320 – 3765 ISSN (Online): 2278 – 8875
I
nternational
J
ournal of
A
dvanced
R
esearch in
E
lectrical,
E
lectronics and
I
nstrumentation
E
ngineering
(An ISO 3297: 2007 Certified Organization)
Website: www.ijareeie.com
Vol. 6, Issue 7, July 2017
In regression analysis, power factor (PF) has a big negative value, then current (I) andvoltage (V) respectively. The interaction between power factor and current gave a positive value and significant important. Voltage factor has a bad interaction and main effect as well.According to P value, the interaction between current and power factor is the most important in the design according to P value analysis.
Figure2, Pareto chart of standardized effects variable, exploited power P
From Pareto chart, the most important factor is power factor (PF), current (I), and interaction between power factor and current respectively. Voltage (V) and its interactions gave a low value and less important in the whole parameters design.We did not get any Pareto chart from apparent power response (S) because of the standard error equals to zero.
Profiles for Predicted Values and Desirability PF
-500.0 2024.3 5000.0
I V Desirability
0. .5 1. 473.04 2160.3 3847.5 P 1000.0 2892.4 5000.0 0. .5 1. 1576.8 2813.4 4050.0 S
.3 .7 .95
.49451
2.4 4.3385 6. 657. 666.69 675.
De s ir a b ili ty
Figure3, main effects for each factor and desirability
The diagramshowed that voltage (V) has a low significant effect in the design, whereas current (I) has strong significant for all stages. Power factor (PF) also has a significant effect, but this effect will be decreased at a range between 1000 and 5000. Desirability for apparent power S is between 1576.3 and 4050 and curve is between 0 and 1, whereas, the desirability for real exploited power P is between 473.04 and 3847.5 and curve is also between 0 and 1.
Pareto Chart of Standardized Ef f ect s; Variable: P 3 f act ors, 1 Blocks, 13 Runs; MS Residual=53. 76044
DV: P
5.590529 5.962848 10.8134 182.2395 349. 807 424.9275 p=. 05
ISSN (Print) : 2320 – 3765 ISSN (Online): 2278 – 8875
I
nternational
J
ournal of
A
dvanced
R
esearch in
E
lectrical,
E
lectronics and
I
nstrumentation
E
ngineering
(An ISO 3297: 2007 Certified Organization)
Website: www.ijareeie.com
Vol. 6, Issue 7, July 2017
Current is very close to desirability and voltagedoes notachieve any desirability, whereas, power factor is very close to desirability in two curves, but also it does not achieve any desirability in the middle curve.
Thus, current and power factor is very important and play a vital role in thedesign. However, thevoltage has a very low important and bad interaction whether with current or power factor. Voltage in estimated effect gave the highest effect, but this effect will be decreased if interacted with any factor.
VIII. CONCLUSION
In this idea, we tried to understand the extracted rules using anexperimental design. in fuzzy logic, we have to get output according to the whole rules, but it is very complicated to understand exact effect for each factor independently without using anexperimental design. We have three inputs and two outputs used to establish rules to predict the optimum outputs. Power factor (PF) and current (I) gave a very important effect and interactions, whereas, voltage (V) gave bad interactions. Experiment design plays a very vital role to diagnosis extracted rules by using electrical equations. ANOVA and regression analysis proved that power factor (PF) and current (I) play a very important role in improving the performance of thethree-phase inductive motor. Results of apparent power have been ignored because its standard error equal to zero and no residuals detected. We considered only exploited power to understand the process because we have standard errors and residual values that gave acomprehensive description to the process. Now, we have to rebuild rules by concentrating on current (I) and power factor (PF) to get more improvement to the performanceof three-phase inductive motors and factory machines as well.
REFERENCES
1- Jiju Antony (2014), “Design of Experiments for Engineers and Scientists”, Second edition, Elsevier insight.
2- Timothy J. Ross (2004), “Fuzzy Logic with Engineering Applications”, second edition, John Willy and Sons, Ltd.