IJEDR1501067
International Journal of Engineering Development and Research (www.ijedr.org)362
Thermal Modelling of Power Transformers
1
Nileshkumar Patel, 2Pankti Shah
1,2 Electrical Department, Parul Institute of Technology,Vadodara,India
________________________________________________________________________________________________________
Abstract - Power transformers represent the largest portion of capital investment in transmission and distribution substations. In addition, power transformer outages have a considerable economic impact on the operation of an electrical network. One of the most important parameters governing a transformer’s life expectancy is the hot-spot temperature value. The classical approach has been to consider the hot-spot temperature as the sum of the ambient temperature, the top-oil temperature rise in tank, and the hot-spot-to-top-oil (in tank) temperature gradient. When fibre optic probes were taken into use, winding hottest spot temperatures higher than those predicted by the loading guides during transient states after the load current increases, before the corresponding steady states have been reached. This paper presents new and more accurate temperature calculation method taking into account for findings hot spot temperature using IEEE standard using computer programming.
Index Terms - power transformers, hot-spot temperature, top-oil temperature, bottom-oil temperature, non-linear thermal resistance, oil time constants.
________________________________________________________________________________________________________
I.INTRODUCTION
A power transformer is a static piece of apparatus with two or more windings which, by electromagnetic induction, transforms a system of alternating voltage and current into another system of voltage and current usually of different values and at same frequency for the purpose of transmitting electrical power [1].
Power transformers are one of the most expensive components in an electricity system. Knowing their condition is essential to meet the goals of maximizing return on investment and lowering the total cost associated with transformer operation. The transformer winding hot-spot temperature is one of the most critical parameters when defining the power transformer thermal conditions and overloading capability beyond the nameplate rating. Therefore, in order to increase transformer operational efficiency and minimize the probability of an unexpected outage, several on-line and off-line monitoring systems have been developed [2], [3], [4], [5], [6]. Direct measurement of actual transformer winding temperatures using fibre optic probes has been increasing since the mid-1980s, [7], [8], [9], [10], [11] .But it is find that winding hottest spot temperatures higher than those predicted by the loading guides during transient states after the load current increases, before the corresponding steady states have been reached.
The paper represents winding temperature hot spot temperature using IEEE and IEC loading guides. The aim of this paper is to develop software which displays the loading of the transformer. The loading is calculated in a manner that incorporates the change in the season, load variations, cooling methods, etc.
II.IEEEAPPROACH
A revision of the loading guide for power transformers is currently in progress. It is noted that the traditional hot-spot temperature calculation method uses a number of assumptions that are not correct:
• Oil temperature in the cooling duct is assumed to be the same as the top oil temperature • The change in winding resistance with temperature is neglected
• The change in oil viscosity with temperature is neglected • The effect of tap position is neglected
• The variation of ambient temperature is assumed to have an immediate effect on oil temperature.
Moreover, experimental work has shown that at the onset of a sudden overload, oil inertia induces a rapid rise of oil temperature in the winding cooling ducts that is not reflected by the top oil temperature in the tank. Therefore alternate sets of equations are being developed, taking into account all these factors.
An additional important evolution is the disappearance of the guide on definition of transformer “Thermal Duplicate” that was often used to provide default values for winding temperature rise at rated load. This reference will not be available anymore to provide support to the hot-spot temperature rise estimated by the manufacturer. This might reduce the credibility of transformer manufacturer in providing that critical thermal parameter.
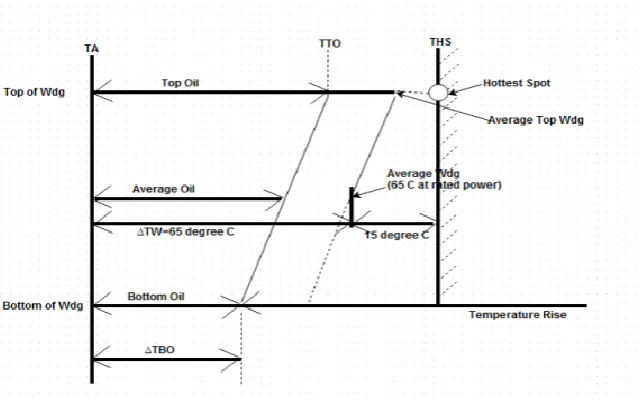
ANSI/IEEE C57.91[12] is based on average characteristics of a wide range of transformer ratings and designs. The guide uses the top-oil rise and the hottest-spot conductor rise over top-oil to calculate the hottest-spot temp. and is defined by:
THS= TA+ ∆ TTO+∆TH Where
THS=winding hottest- spot temp,◦C
IJEDR1501067
International Journal of Engineering Development and Research (www.ijedr.org)363
∆TG is the winding hottest-spot temperature rise over top-oil temperature.Figure 1 shows corresponding thermal diagram. The assumptions are:
• The oil temperature inside the windings increases linearly from bottom to top of the winding regardless of the cooling type, • The temperature rise of conductor at any position up the winding increases linearly and parallel to the oil temperature rise, • The hottest-spot temperature rise is higher than the temperature rise of the conductor at the top of the winding, because of the increase in stray losses. To find hottest-spot temperature, the hottest-spot allowance (∆TG) is added to the top oil temperature.
Figure: 1 Transformer’s temperature profile for IEEE classical thermal model
The top-oil temperature rise under steady-state condition is proportional to the total transformer loss and given by:
Top oil rise over ambient
∆ TTO = (∆ TTO,U- ∆ TTO,i)(1-exp^(-t/حTO) ∆ TTO,i = ∆ TTO,R[(Ki^2*R+1)/(R+1)]^n ∆ TTO,U = ∆ TTO,R[(KU^2*R+1)/(R+1)]^n Where
∆ TTO,i = initial top oil rise over ambient temp for t=0, ◦C
∆ TTO,U = ultimate top oil rise over ambient temp for load L, ◦C R = ratio of load loss at rated load to no-load loss on the tap position to be studied
Oil time constant
For OA and FA cooling modes
C=0.06(weight of core and coil assembly in pounds) +0.04(weight of tank and fitting in pounds) +1.33(gallons of oil) For forced-oil cooling modes
C=0.06(weight of core and coil assembly in pounds) +0.06(weight of tank and fitting in pounds) +1.93(gallons of oil)
The top oil time constant at rated KVA
حTO,R=C* ∆ TTO,R/PT,R
The top oil time constant
حTO= حTO,R [(∆ TTO,U/∆ TTO,R)-(∆ TTO ,i/∆ TTO,R)]/[(∆TΘTO,U/∆ TTO,R)^1/n-(∆TΘTO ,i/∆ TTO,R)^1/n] ∆TTO= kq^n
Where, n=1.
Winding hot spot rise
Transient winding hottest spot temp rise over top-oil temp ∆TH= (∆ TH,U- ∆ TH,i)*(1-exp^(-t/حW)+ ∆ TH,i
The initial hot spot rise over top oil ∆TH,I = ∆TH,R Ki^2m
The ultimate hot-spot rise over top oil ∆TH,U= ∆TH,R Ku^2m
IJEDR1501067
International Journal of Engineering Development and Research (www.ijedr.org)364
III. ∆TH,R= ∆TH/A,R- ∆TTO,R9913417580
Table:1 Exponent for temp rise equation
Types of cooling m n
OA 0.8 0.8
FA 0.8 0.9
Non-directed FOA or FOW 0.8 0.9
Directed FOA or FOW 1.0 1.0
Figure:2 Block diagram of the modified transient heating equations
For Normal Life expectancy loading using the IEEE C57.91[12] standard
This results when the transformer is operated continuously at a hottest spot conductor temperature of 110 deg C
The standard allows a maximum temperature of 120 deg C only if the transformer has operated below 110 deg C for longer periods of time
For Planned Loading beyond Nameplate Rating using the IEEE C57.91[12] standard
Transformers that do not work at a continuous temperature of 110 deg C, can be loaded to a maximum temperature of 120-130 deg
Loss of insulation life should be considered on the length of time at this temperature For Long Term Emergency Loading using the IEEE C57.91[12] standard
During contingency conditions, transformers hottest spot conductor temperature can reach 120-140 deg C
Time will depend on loss of life
It is ex0pected that such occurrences happen only 2-3 times during the life of the transformer
All these changes in IEEE and IEC loading guides indicate that hot-spot temperature calculation methods previous known were not adequate to assess accurately winding hot-spot temperature. Wide use of computers now allows for sophisticated calculation methods but it demonstrates that the quest of winding hot-spot temperature is not trivial and it raises new doubts considering the number of additional values that need to be collected to run the calculation. No wonder that the direct measurement of winding temperature with fiber optic sensors is the recommended practice for critical transformers.
IJEDR1501067
International Journal of Engineering Development and Research (www.ijedr.org)365
V.SIMULATION(USING VB.NET)
Input
IJEDR1501067
International Journal of Engineering Development and Research (www.ijedr.org)366
VI.SCREEN SHOTS OF TRANSFORMER THERMAL MODEL
VII.CONCLUSION
IJEDR1501067
International Journal of Engineering Development and Research (www.ijedr.org)367
REFERENCES
[1] (IEC , 1993) "IEC 72-1 Power Transformers; Part 1: General",1993-03 second edition
[2] (Betta, 2000) Betta, G., Pietrosanto A., and Scaglione A., "An enhanced fiber optic temperature sensor system for power transformer monitoring", Instrumentation and Measurement Technology Conference, 2000. IMTC 2000. Proceedings of the 17th IEEE ,Vol.1 , 1-4 May 2000, pp.153-158.
[3] (Chu, 1999) Chu D., Lux, A., " On-line monitoring of power transformers and components: a review of key parameters", Electrical Insulation Conference and Electrical Manufacturing & Coil Winding Conference, 1999. Proceedings , 26-28 October 1999, pp. 669 – 675
[4] (Feng, 2002) Feng J.Q., Sun P., Tang W.H., Buse D.P., Wu Q.H., Richardson Z., and Fitch J., " Implementation of a power transformer temperature monitoring system", International Conference on Power System Technology, 2002. Proceedings PowerCon 2002.,Vol. 3 , 13-17 Oct. 2002, pp.1980 – 1983
[5] (Harris, 1997) Harris D., and Saravolac M.P., "Condition monitoring in power transformers", Condition Monitoring of Large Machines and Power Transformers (Digest No: 1997/086), IEE Colloquium on , 19 June 1997 , pp. 7/1 - 7/3
[6] (Lachman, 2003) Lachman M.F., Griffin P.J., Walter W., and Wilson A.," Realtime dynamic loading and thermal diagnostic of power transformers", IEEE Transactions on Power Delivery ,Vol. 18 , Issue: 1 , Jan 2003, pp.142-148
[7] (Electra, 1990) "Direct Measurements of the Hot-Spot Temperature of Transformers", CIGRÉ WG 12–09, vol. 129, 1990. [8] (Lampe, 1984) Lampe W., Pettersson L., Ovren C., and Wahlström B., "Hot-Spot Measurements in Power Transformers", Cigre, Rep. 12-02, International Conference on Large High Voltage Electric Systems, 1984 Session, 29 th August- 6 th September.
[9] (Räfsbäck, 2001) Räfsbäck N. T., “Short-time emergency overloading of power transformers, Bachelor thesis”, Power transformer company, ABB, Vaasa, 2001
[10] (Saravolac, 1994) Saravolac, M.P., "The use of optic fibres for temperature monitoring in power transformers", Condition Monitoring and Remanent Life Assessment in Power Transformers, IEE Colloquium on , 1994, pp.7/1 - 7/3