Article
Vegetation survival in green roofs without irrigation
Anita Raimondi 1, Mariana Marchioni 1, Umberto Sanfilippo 1 * and Gianfranco Becciu 1 1 Dipartime nto di Inge gneria Civile e Ambie ntale, Polite cnico di Milano
* Corre spondence: [email protected]
Abstract: The Sustainable Urban Drainage Systems on stormwater management provide benefits for sewer networks, treatment plants and environment and should be encouraged. Green roofs are part of these systems and can contribute both to delay and cut peak runoff and reduce discharged volumes. In this paper the probability of vegetation survival without irrigation has been proposed as a guide to operators on selecting vegetation and irrigation system as well as design parameters. An analytical probabilistic approach has been proposed; a chain of consecutive rainfall events has been considered to take into account the possibility that storage capacity is not completely available at the beginning of the considered event but pre-filled from previous rainfalls, as typical of green roofs. Finally, an application to a case study has been proposed to validate proposed equations.
Keywords: Sustainable Urban Drainage Systems; green roofs; analytical probabilistic approach; pre-filling volume; vegetation survival
1. Introduction
The use of Sustainable Urban Drainage Systems delivers several benefits: relief on the sewer networks, increase the efficiency of treatments plants, reduce water contaminates load and increase biodiversity. The growth of impervious areas, especially in highly density populated cities strongly reduces soil infiltration with consequent rise of flood events; in such context green roofs can be effective since rooftops constitute from 30 to 50% of impermeable surfaces and don’t require additional space beyond a building's footprint [1]. Their implementation also entails significant environmental and economic benefits besides stormwater management and the improvement of water quality, as like energy conservation, reduction of heat island and protection of biodiversity. Focusing on stormwater management, green roofs allow especially if widespread: the local disposal of runoffs; the reduction of runoff volumes, through evapotranspiration from vegetation and exposed surfaces; the delay of runoff, that only starts after soil saturation; the reduction and delay of runoff peak rates, for the infiltration of rainwaters into the soil and their temporary storage in the substrate and in the drainage layer; the improvement of stormwater quality for effect of its percolation into the soil. First green roofs were installed in Germany in the 1970s [2] and since then they have spread in all major modern countries where in some cases have been developed incentive programs to encourage or even impose their installation.
Green roofs have been deeply studied to analyze their performance under different climate and design conditions [3-7], often with reference to a specific place or climate [8-10] on small spatial and time scale [11, 12]; especially for full-scale installations, there is not enough scientific evidence yet to demonstrate hydrological benefits of green roofs [13, 14]. Often the focus of studies on green roof is on their retention capacity in relation to rainfall depth [1, 2]), antecedent dry period [15, 16] and evapotranspiration [17].
Raimondi and Becciu have evaluated green roofs performances for stormwater control estimating the runoff probability distribution function by mean of an analytical probabilistic approach. This kind of methodology, first proposed by [18] has been applied by different authors also to SUDS: Rain Water Harvesting Systems [19] infiltration trenches [20], permeable pavements [21] bioretention systems [13], green roofs [13, 20, 22], stormwater detention facilities [23]. Generally, these studies consider a couple of rainfall events at time and neglect or only partially consider the
possibility that storage volume is not completely empty at the beginning of considered rainfall. Becciu and Raimondi [24] observed that for low outflow rate structures as SUDSs, pre-filling is generally due to more than one previous rainfall and developed a procedure to consider a chain of N rainfall events [25].
In this paper the analytical prob abilistic approach has been proposed to estimate the probability of vegetation to survive without irrigation, that is the probability to have a minimum water content into growing medium during dry periods between rainfall events; to consider the possibilit y of pre-filling of storage capacity from a chain of previous rainfall events is fundamental for green roofs, since outflows are limited to evapotranspiration from vegetation and soil. Resulting equations can guide operators in the choice of suitable veget ation and irrigation for the analyzed context as well as of design parameters. An application to a case study in Milano, Italy has been proposed to validate proposed formulas by a comparison of results obtained from them with those obtained from the continuous simulation of recorded data.
2. Green roofs hydrology
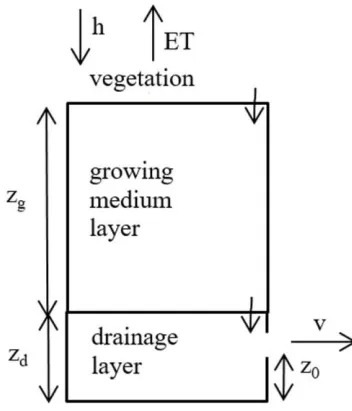
Green roofs are engineered multi-layered structures, with a vegetated upper surface, working in very shallow systems without connection to natural ground. Layers, involved in stormwater control are: vegetation; growing medium, a blend of mineral material enriched with organic material where water is retained and in which vegetation is anchored; filter fabric; drainage layer, generally constituted of plastic profiled elements, that stores water for plants sustainment during dry periods evacuating excess water in roof drains; root resistant membrane, mechanic protection geotextile. Figure 1 shows the scheme of reference for the modeling of green roofs, used in this paper.
Figure 1. Gre e n roof scheme conside red for the mode ling.
h: rainfall depth ET: evapotranspiration v: runoff
zg: growing medium thickness
zd: drainage layer thickness
z0: overflow height
and drainage layer; volumes must be intended as specific for unit of area. Rainfall is first intercepted by vegetation and then infiltrated into growing medium where is retained, used by roots and released back into atmosphere through evapotranspiration; the excess is infiltrated into drainage layer equipped with an overflow to discharge excess rainwater into the sewer when retention capacity is full. Interception by vegetation, generally of a few millimetres and drainage layer capacity, generally variable between 5-10 [cm], have been neglected in the following: the focus is on growing medium layer and on its thickness.
To evaluate the probability of vegetation to survive without irrigation, water content at the en d of dry period between events has been be calculated: this is the condition of minimum water content into growing medium.
Evapotranspiration, that is the amount of water released to atmosphere from plants transpiration and soil evaporation can be estimated by the following equation:
𝐸𝑇 = {ℎ + ℎ𝐸𝑇𝑃
𝑔𝑒
ℎ ≥ 𝐸𝑇𝑃 𝑜𝑟 ℎ < 𝐸𝑇𝑃 𝑎𝑛𝑑 ℎ + ℎ𝑔𝑒 ≥ 𝐸𝑇𝑃
ℎ < 𝐸𝑇𝑃 𝑎𝑛𝑑 ℎ + ℎ𝑔𝑒 < 𝐸𝑇𝑃
(1)
Evapotranspiration 𝐸𝑇 equals potential evapotranspiration 𝐸𝑇𝑃, in case rainfall depth is higher
than potential evapotranspiration or when rainfall depth is lower than potential evapotranspiration but rainfall depth added to water content into growing medium from previous rainfalls ℎ𝑔𝑒 exceeds
potential evapotranspiration. Water content into growing medium can vary between zero if it is completely dry and the maximum value 𝜙𝑓·zg, (where 𝜙𝑓 represents the growing medium moisture
content at saturation), if storage volume is full, as in the case of two very close heavy rainfall events. For the aim of the paper, evapotranspiration has been assumed equal to potential evapotranspiration, that is equal to its maximum, the worst condition for vegetation.
Water content into growing medium has been estimated both at the end of the dry period (subscript e) and at the end of rainfall event (subscript u).
Considering i=1, …, N water depth into growing medium at the end of considered event results:
ℎ𝑔𝑢 ,𝑖−1 = {
ℎ𝑔𝑒 ,𝑖−1+ ℎ𝑖−1− 𝐸𝑡 ∙ 𝜃𝑖−1
𝜙𝑓∙ 𝑧𝑔
0
0 ≤ ℎ𝑔𝑒 ,𝑖−1+ ℎ𝑖−1− 𝐸𝑡 ∙ 𝜃𝑖 −1< 𝜙𝑓∙ 𝑧𝑔
ℎ𝑔𝑒 ,𝑖−1+ ℎ𝑖−1− 𝐸𝑡 ∙ 𝜃𝑖 −1≥ 𝜙𝑓∙ 𝑧𝑔
𝑜𝑡ℎ𝑒𝑟𝑤𝑖𝑠𝑒
(2)
For i=1, growing medium has been considered empty (he,0=0).
Et is the evapotranspiration rate, assumed equal to its maximum, the potential one, as discussed above.
Water depth into growing medium at the beginning of a generic rainfall (always considering i=1, …, N) results:
ℎ𝑔𝑒 ,𝑖= {
ℎ𝑔𝑢 ,𝑖−1− 𝐸𝑡 ∙ 𝑑𝑖−1
0
ℎ𝑔𝑢 ,𝑖−1− 𝐸𝑡 ∙ 𝑑𝑖−1> 0
𝑜𝑡ℎ𝑒𝑟𝑤𝑖𝑠𝑒 (3) During dry period between rainfall events, in absence of irrigation, water depth into growing medium can only decrease.
3. Probabilistic model
In the analytical probabilistic model proposed to evaluate the capacity of vegetation to survive without irrigation, input variables are rainfall depth h, rainfall duration θ and interevent time d: they have been considered independent and exponentially distributed. To isolate independent rainfalls from a continuous record of events, a minimum interevent time, the so called Inter Event Time Definition (IETD) (USEPA 1986) has been defined. If the interevent time between two consecutive rainfall events is smaller than IETD, the two rainfall have been joined into a single event, otherwise they have been assumed independent.
of observed data for main rainfall characteristic parameters; such distribution may be easily integrated but derived expressions are more complex. Moreover, its application to a case study highlighted that the use of a double-exponential probability distribution function little improves the accuracy of results and that the bias due to the use of the exponential probability distribution function is negligible when compared to the simplicity of equations integration. Exponential probability density function of rainfall depth, rainfall duration and interevent time, is:
𝑓ℎ = 𝜉 ∙ 𝑒−𝜉∙ℎ (4)
𝑓𝜃 = 𝜆 ∙ 𝑒−𝜆∙𝜃 (5)
𝑓𝑑 = 𝜓 ∙ 𝑒−𝜓∙(𝑑−𝐼𝐸𝑇𝐷) (6)
where: 𝜉 = 1/𝜇ℎ; 𝜆 = 1/𝜇𝜃; 𝜓 = 1/(𝜇𝑑− 𝐼𝐸𝑇𝐷) and 𝜇ℎ, 𝜇𝜃 and 𝜇𝑑 are respectively the mean
values of rainfall depth, rainfall duration and interevent time.
These models neglect the random nature of runoff coefficient, despite its random nature (Becciu and Paoletti [31]). For green roofs, the input is rainfall directly fallen on the green roof.
To estimate the probability of green roofs vegetation to survive without irrigation, a min imum water content w has been considered. The condition for which water content can be different of zero at the end of the considered dry period is (zg·𝜙𝑓-w)/Et>IETD: this means the possibility to have
pre-filling from previous events.
Two different conditions have been discussed: a single rainfall i=1 and a chain of rainfall events i>1.
For i=1, that is when a single rainfall is considered, the probability to have a minim um water volume into the growing medium at the end of dry period between rainfalls to ensure vegetation survival results: 𝑃 = ∫ 𝑓ℎ ∙ 𝑑ℎ ∞ ℎ=𝑤+𝐸𝑡∙(𝑑+𝜃) ∫ 𝑓𝑑 ∙ 𝑑𝑑 ∅𝑓∙𝑧𝑔−𝑤 𝐸𝑡 𝑑 =𝐼𝐸𝑇𝐷 ∫ 𝑓𝜃∙ 𝑑𝜃 ∞ 𝜃=0 =
= 𝛾 ∙ 𝛽 ∙ [𝑒−𝜉∙(𝐸𝑡∙𝐼𝐸𝑇𝐷+𝑤)− 𝑒𝜓∙(𝐼𝐸𝑇𝐷+𝐸𝑡𝑤)−𝜙𝑓∙𝑧𝑔∙(𝜉 +𝐸𝑡𝜓)] (7)
For i >1, that is if a chain of rainfall events is considered, the probability to have a minimum water volume into growing medium at the end of the considered dry per iod to ensure vegetation survival results: 𝑃 = ∫ 𝑓𝜃 ∙ 𝑑𝜃 ∞ 𝜃=0 ∙ { ∫ 𝑓𝑑 ∙ 𝑑𝑑 ∅𝑓∙𝑧𝑔−𝑤 𝐸𝑡 𝑑 =𝐼𝐸𝑇𝐷 ∙ [ ∫ 𝑓ℎ∙ 𝑑ℎ ∞ ℎ=∅𝑓∙𝑧𝑔+𝐸𝑡∙𝜃 ∙ + ∫ 𝑓ℎ ∙ 𝑑ℎ
∅𝑓∙𝑧𝑔+𝐸𝑡∙𝑑∙(𝑖−2)
𝑖−1 +𝐸𝑡∙𝜃
ℎ = 𝑤
𝑖−1+𝐸𝑡∙(𝜃+𝑑) ]
+ ∫ 𝑓ℎ ∙ 𝑑ℎ
𝜙𝑓∙𝑧𝑔+𝐸𝑡∙𝑑∙(𝑖−2)
𝑖−1 +𝐸𝑡∙𝜃
𝜙𝑓∙𝑧𝑔+𝐸𝑡∙𝑑∙(𝑖−1)
𝑖 +𝐸𝑡∙𝜃
∫ 𝑓𝑑∙ 𝑑𝑑
𝑑 =∅𝑓∙𝑧𝑔∙(𝑖−1) −𝑖∙𝑤 𝐸𝑡∙(𝑖−1)
𝑑 =𝐼𝐸𝑇𝐷
} =
= 𝛾 ∙ {𝑒−𝜉∙∅𝑓∙𝑧𝑔∙ [1 − 𝑒𝜓∙(𝐼𝐸𝑇𝐷+ 𝑤 𝐸𝑡−
𝜙𝑓∙𝑧𝑔
𝐸𝑡 )] +2∙(1−𝛽)∙𝛽𝑖
𝑖−1 ∙ 𝑒
−(𝐸𝑡𝜓+𝜉)∙(𝜙𝑓∙𝑧𝑔−𝑤)+𝜓∙𝐼𝐸𝑇𝐷−𝜉∙𝑤𝑖−1− 𝛽 𝑖[2 ∙
𝑒−
𝜉
𝑖−1∙[𝜙𝑓∙𝑧𝑔+𝐸𝑡∙𝐼𝐸𝑇𝐷∙(𝑖−2) ]+ 𝑒 𝜉∙𝑤∙𝑖∙(𝑖−2)
(𝑖−1)2 −𝜙𝑓∙𝑧𝑔∙( 𝜓
𝐸𝑡+𝜉)+𝜓∙𝐼𝐸𝑇𝐷+ 𝜓∙𝑖∙𝑤
𝐸𝑡∙(𝑖−1)] + 𝛽 ∙ 𝑒− 𝜉∙𝑤
𝑖−1−𝜉∙𝐸𝑡 ∙𝐼𝐸𝑇𝐷+ 𝛽 𝑖∗∙
[𝑒−𝜙𝑓∙𝑧𝑔∙(𝐸𝑡𝜓+𝜉)+𝜓∙𝐼𝐸𝑇𝐷+𝐸𝑡∙(𝑖−1)𝜓∙𝑖∙𝑤 − 𝑒−𝜉𝑖∙[𝜙𝑓∙𝑧𝑔+𝐸𝑡∙𝐼𝐸𝑇𝐷∙(𝑖−1)]]}
(8)
Symbols γ, β, βi and βi* are equal to:
𝛾 = 𝜆
𝜆+𝜉∙𝐸𝑡; 𝛽 = 𝜓
𝜓+𝜉∙𝐸𝑡; 𝛽𝑖=
(𝑖−1)∙𝜓
(𝑖−1)∙𝜓+𝜉∙𝐸𝑡∙(𝑖−2); 𝛽𝑖
∗= 𝜓 ∙𝑖
𝜉 ∙𝐸𝑡−𝑖∙(𝜉∙𝐸𝑡+𝜓)
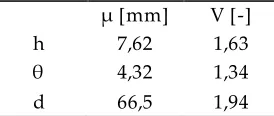
Equations (7) and (8) have been applied to a case study in Milano (Italy). As input for the analysis, rainfall records of Milano-Moviso gauge station in the period 1971-2005 have been used; to identify independent events a minimum interevent time IETD=1 [hour] has been assumed. Table 1 reports mean and coefficient of variation of rainfall depth h, rainfall duration θ and interevent time d.
Table 1. Me an and coe fficient of variation of rainfall variable s.
μ [mm] V [-]
h 7,62 1,63
θ 4,32 1,34
d 66,5 1,94
The assumption of exponential distribution of rainfall variables is not completely satisfy but the bias due to its use can be considered negligible as discussed and tested by [24]. Table 2 contains correlation index among rainfall variables.
Table 2. Corre lation inde x among rainfall variables
ρh,d [-] 0,01
ρθ,h [-] 0,7
ρd,θ [-] 0,01
With reference to correlation index, it’s evident that correlation between rainfall depth and interevent time and correlation between interevent time and rainfall duration is negligible while correlation between rainfall depth and rainfall duration is high; effects on this assumption on results have been discussed in previous works [32]. Potential evapotranspiration and water content at saturation have been assumed respectively equal to Et=0,131 [mm/hour] and 𝜙𝑓=0,58 [-] [8]; growing
medium thickness zg has been varied between 50 [mm] and 500 [mm]. A minimum water content
w=0 [mm] has been considered, that corresponds to the probability of prefilling from previous events, that is the minimum condition for vegetation survival without irrigation.
Results from application of equations (7) and (8) have been compared with those obtained by the frequency analysis of continuous simulation of recorded data. Figure 2 shows a good fit to cumulated frequency, for i=5. The probability to have a minimum water content for vegetation survival without irrigation increases with growing medium thickness, varying from a return period T≈4 [years] with zg=50 [mm] to T≈7 [years] with zg=500 [mm]; to get higher return period values is
Figure 2. Comparison be tween probability and fre que ncy distribution function of wate r conte nt into
growing me dium laye r varying its thickne ss in the pe riod of analysis.
In the following the same analysis discussed above have been made with reference to each season; the behavior of green roofs, especially water need of vegetation, is different for each season mainly due to different rainfall conditions and different evapotranspiration rates. Different studies in literature collected results of field measurements trying to define a range of reasonable values of green roofs evapotranspiration: [31] experimental estimated this rates range from 0,69 to 6 -9 [mm∕day] with typical values of 1-6 [mm∕day] using a Penman-Monteith model; [33] found evapotranspiration rates variable between 0 to 5 [mm/day] analyzing wet, intermediate and dry conditions; [16] averaged evapotranspiration rates of about 2 [mm∕day] for the seven days following saturation. For the case, discussed in Figure 2 an evapotranspiration rate equal to Et=0,131 [mm/hour] has been used; to diversify evapotranspiration rate during different seasons, this value has been maintained for Spring and Autumn, while for Winter a minimum value equal to Etwinter=0,09
[mm/hour] has been considered and for Sumer a maximum value equal to Etsummer=0,21 [mm/hour]
has been considered. Table 3 shows average values of each rainfall variable for each season.
Table 3. Me an value s of rainfall variables.
Spring Summer Autumn Winte r
μh [mm] 6,32 8,9 7,89 8,06
μθ [hour] 3,17 2,55 5,39 6,75
μd [hour] 48,98 78,23 61,34 84,62
Maximum average rainfall depth occurs in Summer with, however, the minimum rainfall duration resulting in high rainfall intensity; maximum average rainfall duration occurs in Winter, typically characterized in temperate climate by long but low intensity rainfalls; again in Winter maximum average rainfall interevent time occur: this is due to the low number of rainfall events especially if compared with Spring (Table 4).
Table 4. Numbe r of rainfall e ve nts for season in the conside red pe riod.
Spring Summer Autumn Winte r
N [-] 1430 928 1113 862
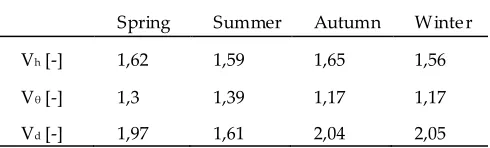
Table 5 presents coefficients of variation for each variable in different seasons: according to Table 1 minimum values are always for rainfall duration for which the assumption of exponential distribution is more suitable; as previously highlighted in Tabl e 1 interevent time probability distribution function differs more from the exponential one, especially in Autumn and Winter.
Table 5. Coe fficie nts of variation of conside red rainfall variables.
Spring Summer Autumn Winte r
Vh [-] 1,62 1,59 1,65 1,56
Vθ [-] 1,3 1,39 1,17 1,17
Vd [-] 1,97 1,61 2,04 2,05
According to Table 2, both correlation index between rainfall depth and interevent time and between rainfall duration and interevent time are negligible, while correlation index between rainfall depth and duration is quite high with its maximum in Winter.
Table 6. Corre lation inde x among rainfall variable s.
ρh,d [-] -0,02 0,03 0,02 -0,02
ρθ,h [-] 0,72 0,63 0,76 0,87
ρd,θ [-] -0,05 -0,02 0,05 0,02
Figure 3 reports the probability distribution function of water content into growing medium varying layer thickness, computed applying equation (8), compared with the frequency distribution function of observed data. There is a good fitting between the two curves (mean square deviation is equal to 0,6%); in this case the number of considered chained events is equal to i=6, one more than for the whole period discussed in Figure 2: this because as average interevent time is lower the probability of pre-filling from previous rainfall events increases.
Figure 3. Comparison be tween probability and fre que ncy distribution function of wate r conte nt into
growing me dium laye r varying its thickne ss during Spring.
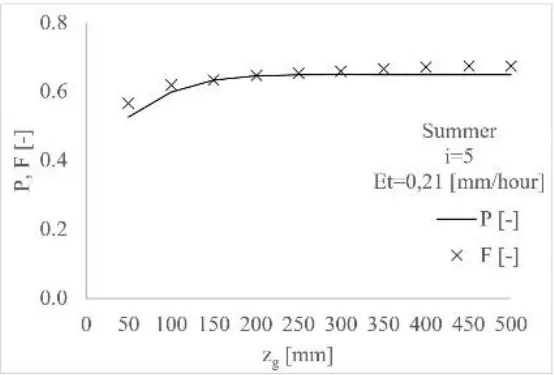
Figure 4 shows results for Summer: the fitting of results from the application of proposed method to the frequency distribution function of observed data is good (mean square deviation equal to 0,4%) except for a small underestimation for the smallest and greatest values of growing medium layer thickness. The increased value of evapotranspiration rate involves a lower probability of pre-filling from previous rainfalls; this effect is balanced by a high value of rainfall depth compared with other seasons (i=5 has been used).
Figure 4. Comparison be tween probability and fre que ncy distribution function of wate r conte nt into
Figure 5 shows results for Autumn: in this case the comparison with the frequency distribution of observed data, reveals a good fitting for low thickness of growing medium layer while if it increases proposed method underestimates the probability distribution function of water content. The agreement to frequency distribution function of probability distribution function is greater considering i=5 than for i=6 (mean square deviation equal to 1,3% for i=6 and equal to 1,1% for i=5). Comparing Autumn with Summer, the lower evapotranspiration rate with consequent increase of chained rainfall events is balanced by a lower average interevent tim e.
Figure 5. Comparison be tween probability and fre que ncy distribution function of wate r conte nt into
growing me dium laye r varying its thickne ss in Autumn.
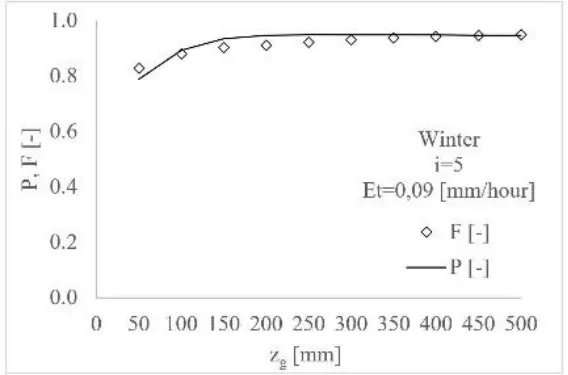
Figure 6 reports the comparison between water content probability distribution function and frequency distribution function of observed data varying growing medium thickness in Winter: the fitting is good (mean square deviation equal to 0,5%). In this case low evapotranspiration rate with consequent increase of probability of pre-filling from previous events is balanced by a high average interevent time (Table 2).
Figure 6. Comparison be tween probability and fre que ncy distribution function of wate r conte nt into
growing me dium laye r varying its thickne ss in Winte r.
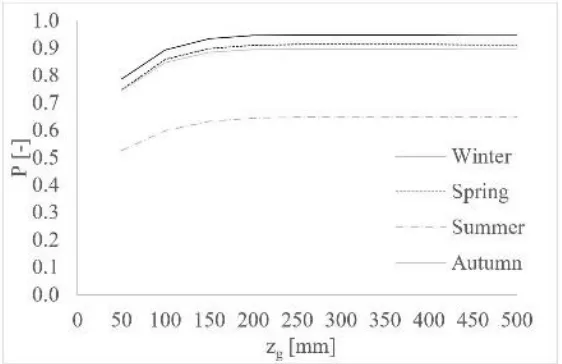
for all seasons an increase of layer thickness corresponds to an increase of the probability only for low values of zg: in this case values of growing medium thickness higher than 20 cm don’t increase
the probability to have a minimum water content at the end of dry periods for vegetation survival.
Figure 7. Probability distribution function of wate r conte nt into growing me dium varying growing
me dium thickne ss for diffe re nt seasons.
5. Conclusion
The proposed method allows to analyse the probability to have enough water content for vegetation survival in conditions of lack of irrigation; enables to study the influence on results of variation of growing medium thickness, evapotranspiration, kind of vegetation, climate conditions. The possibility of considering that water storage capacity can be not completely available at the beginning of each rainfall because partially pre-filled from previous events makes the method more realistic especially for structures such as green roofs characterized from a low release flow. Resulting equations can be a valid aid for green roofs design since they allow to define the thickness of growing medium layer, for different condition of vegetation and soil water content at saturation and for a fixed level of probability (return period); they can be applied to different climate conditions since input rainfall variables are simply the average values of rainfall depth, rainfall duration and interevent time. The application to a case study shows an excellent fit of proposed formulas to the frequency analysis of continuous simulation of observed data, highlighting the great potentiality of the suggested method.
Supplementary Materials: The following are available online at www.mdpi.com/xxx/s1, Figure S1: title , Table
S1: title , Vide o S1: title .
Author Contributions: Me thodology, Anita Raimondi, Umbe rto Sanfilippo and Gianfranco Be cciu; formal
analysis, Anita Raimondi; data curation, Anita Raimondi; writing—original draft pre paration, Anita Raimondi.; writing—re vie w and e diting, Mariana Marchioni; supe rvision, Umbe rto Sanfilippo; proje ct administration, Gianfranco Be cciu. All authors have re ad and agreed to the publishe d ve rsion of the manuscript.
Funding: Ple ase “This re search re ceived no e xternal funding”
Acknowledgments: The authors wish to thank Manue l Manzoni, bache lor in Inge gneria Civile e Ambie ntale at
Polite cnico di Milano - Polo Te rritoriale di Le cco, for his contribution to some computations.
Conflicts of Interest: The authors de clare no conflict of inte re st.
References
[1] Carte r, T.L. and T.C. Rasmussen, Hydrologic behavior of vegetated roofs 1. JAWRA Journal of the American
[2] Ge tte r, K.L., D.B. Rowe , and J.A. Andre se n, Quantifying the effect of slope on extensive green roof stormwater
retention. Ecological e ngine ering, 2007. 31(4): p. 225-231.
[3] Li, Y. and R.W. Babcock Jr, Green roof hydrologic performance and modeling: a review. Water science and
te chnology, 2014. 69(4): p. 727-738.
[4] Li, Y. and R.W. Babcock Jr, Modeling hydrologic performance of a green roof system with HYDRUS-2D.
Journal of Environme ntal Engine ering, 2015. 141(11): p. 04015036.
[5] Palla, A., I. Gne cco, and L. Lanza, Compared performance of a conceptual and a mechanistic hydrologic models
of a green roof. Hydrological Proce sses, 2012. 26(1): p. 73-84.
[6] Locate lli, L., Mark, O., Mikke lse n, P.S., Arnbje rg-Nie lsen, K., Be rge n, J.M., and P.J. Binning, Mode lling
of gre en roof hydrological pe rformance for urban drainage a pplications. Journal of hydrology, 2014.
519: p. 3237-3248.
[7] Stovin, V., G. Ve suviano, and S. De -Ville , Defining green roof detention performance. Urban Water Journal,
2017. 14(6): p. 574-588.
[8] Pale rmo, S.A., Turco, M., S. Principato and P. Piro, Hydrological effectiveness of an extensive green roof in
Mediterranean climate. Wate r, 2019. 11(7): p. 1378.
[9] Pe ng, L.L. and C.Y. Jim, Seasonal and diurnal thermal performance of a subtropical extensive green roof: The
impacts of background we ather parameters. Sustainability, 2015. 7(8): p. 11098-11113.
[10] He rre ra, J., Flamant, G., Gironás, J., Ve ra, S., Bonilla, C.A., Bustamante, W. and F. Suáre z., Using a
hydrological model to simulate the performance and estimate the runoff coefficient of green roofs in semiarid
climate s. Water, 2018. 10(2): p. 198.
[11] Hakimdavar, R., Culligan, P.J., Finazzi, M., Barontini, S., and R. Ranzi, Scale dynamics of extensive green
roofs: Quantifying the effect of drainage area and rainfall characteristics on observed and modeled green roof
hydrologic performance. Ecological Engine e ring, 2014. 73: p. 494-508.
[12] Nawaz, R., A. McDonald, and S. Postoyko, Hydrological performance of a full-scale extensive green roof
located in a temperate climate. Ecological Engine ering, 2015. 82: p. 66-80.
[13] Zhang, S. and Y. Guo, Stormwater capture efficiency of bioretention systems. Water re sources management,
2014. 28(1): p. 149-168.
[14] Be rndtsson, J.C., Green roof performance towards management of runoff water quantity and quality: A review.
Ecological e ngine ering, 2010. 36(4): p. 351-360.
[15] Chowdhury, R.K. and S. Be e cham, Characterization of rainfall spells for urban water management.
Inte rnational Journal of Climatology, 2013. 33(4): p. 959-967.
[16] Voyde , E., E. Fassman, and R. Simcock, Hydrology of an extensive living roof under sub-tropical climate
conditions in Auckland, New Zealand. Journal of hydrology, 2010. 394(3-4): p. 384-395.
[17] Be ngtsson, L., Peak flows from thin sedum-moss roof. Hydrology Re se arch, 2005. 36(3): p. 269-280. [18] Adams, B. and F. Papa, Analytical Probabilistic Models for Stormwater Management Planning . 2000, John
Wile y and Sons, Ne w York.
[19] Be cciu, G., A. Raimondi, and C. Dre sti, Semi-probabilistic design of rainwater tanks: a case study in Northern
Italy. Urban Water Journal, 2018. 15(3): p. 192-199.
[20] Guo, Y., Stochastic analysis of hydrologic operation of green roofs. Journal of Hydrologic Engine e ring, 2016.
21(7): p. 04016016.
[21] Zhang, S. and Y. Guo, An analytical equation for evaluating the stormwater volume control performance of
[22] Zhang, S. and Y. Guo, Analytical probabilistic model for evaluating the hydrologic performance of green roofs.
Journal of Hydrologic Engine e ring, 2013. 18(1): p. 19-28.
[23] Be cciu, G. and A. Raimondi, Probabilistic analysis of spills from stormwater detention facilities, WIT
Transactions on the Built Environme nt, 2014. 139, p. 159-170.
[24] Be cciu, G. and A. Raimondi, Probabilistic analysis of the retention time in stormwater detention facilities.
Proce dia Engine ering, 2015. 119: p. 1299-1307.
[25] Raimondi, A. and G. Be cciu, On pre-filling probability of flood control detention facilities. Urban Water
Journal, 2015. 12: p. 344-351.
[26] Adams, B.J., e t al., Me te orological data analysis for drainage system de sign. Journal of Environmental Engine e ring, 1986. 112(5): p. 827-848.
[27] Eagle son, P.S., Climate, soil, and vegetation: 2. The distribution of annual precipitation derived from observed
storm sequences. Wate r Resources Re search, 1978. 14(5): p. 713-721.
[28] Be die nt, P.B., W.C. Hube r, and B.E. Vie ux, Hydrology and floodplain analysis. 2008.
[29] Bacchi, B., M. Balistrocchi, and G. Grossi, Proposal of a semi-probabilistic approach for storage facility design.
Urban Water Journal, 2008. 5(3): p. 195-208.
[30] Be cciu, G. and A. Raimondi, Factors affecting the pre-filling probability of water storage tanks. WIT
Transactions on Ecology and the Environment, 2012. 164: p. 473-484.
[31] Be cciu, G. and A. Paole tti, Random characteristics of runoff coefficient in urban catchments. Water Science
and Te chnology, 1197. 36(8-9), p. 39-44.
[32] Raimondi, A. and G. Becciu, On the efficiency of stormwater detention tank s in pollutant removal.
Inte rnational Journal of Sustainable De velopment and planning, 2017. 12(1): p. 144-154.
[33] Wolf, D. and J.T. Lundholm, Water uptake in green roof microcosms: effects of plant species and water