71:4 (2014) 123–129| www.jurnalteknologi.utm.my | eISSN 2180–3722 |
Full paper
Jurnal
Teknologi
A Framework of Local Geospatial Data Infrastructure for Sustainable
Urban Development
Azman Ariffina,* Nabila Ibrahim,a Ghazali Desa,a Uznir Ujang,a Hishamuddin Mohd Ali,a Tasaduq Abbas Malik,b Haziq Kamal Mukhelasa
aFaculty of Geoinformation and Real Estate, Universiti Teknologi Malaysia bFaculty of Built Environment, Universiti Teknologi Malaysia
*Corresponding author: [email protected]
Article history
Received :6 February 2014 Received in revised form : 24 July 2014
Accepted :9 October 2014
Graphical abstract
Abstract
This paper addresses the need to develop a Local Geospatial Data Infrastructure (LGDI) for sustainable urban development. This research will highlight the effective and efficient framework for the development of local infrastructure. This paper presents a framework (a combination of domain based and goal based frameworks) for developing a Local Geospatial Data Infrastructure. The basis of this research is on a case study conducted in a Malaysian city. The main focus of the case study was on measuring and assessing sustainability. Six conceptual frameworks were produced based on 6 key dimensions of sustainability. The developed framework consists of 6 conceptual data models and 6 conceptual data structures. It was concluded that 30 spatial data layers are needed of which 12 data layers are categorized as point shape, 17 data layers are categorized as polygon shape and 1 data layer as line shape category.
Keywords: Sustainable Urban Development, SDI, LGDI, GIS
Kajian ini akan menyoroti rangka kerja yang berkesan dan cekap untuk pembangunan infrastruktur tempatan. Kertas penyelidikan ini juga membentangkan rangka kerja (gabungan kerangka yang berasaskan domain dan matlamat) untuk membangunkan Infrastruktur Data Geospatial Tempatan. Asas kajian ini adalah pada kajian kes yang dijalankan di bandar Malaysia. Fokus utama kajian kes ini adalah untuk mengukur dan menilai tahap kemampanan. Enam kerangka konseptual telah dihasilkan berdasarkan 6 dimensi utama kelestarian. Rangka kerja yang dibangunkan terdiri daripada 6 model data konseptual dan 6 struktur data konseptual. Ia dapat disimpulkan bahawa 30 lapisan data spatial diperlukan, di mana 12 lapisan data dikategorikan sebagai bentuk titik, 17 lapisan data dikategorikan sebagai bentuk poligon
dan 1 lapisan data dikategorikan sebagai bentuk garisan.
Kata kunci: Kelestarian Pembangunan Bandar, SDI, LGDI, GIS
© 2012 Penerbit UTM Press. All rights reserved.
1.0 INTRODUCTION
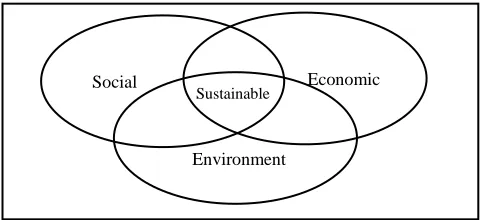
According to Fujiwara and Zhang (2005), the Brundtland Report (1987) has defined sustainable development as development that meets the needs of the present generation without compromising future generations to meet their own needs. The concept of sustainable development can be divided into three parts, namely social sustainability, economic sustainability and environmental sustainability. Social sustainability is the ability to guarantee welfare matters such as safety, health, and education. While economic sustainability is the ability of the economy to generate sustained economic growth. Environmental sustainability is the ability to protect and conserve the environment.
Each planning or development activities should take into account these three components. Program or activity that takes
into account only one of the components is not classified as sustainable development. Marlyana et al. (2011) states that the National Urbanization Policy (2006) has underlined the importance of creating a vision of urban communities and a prosperous life through sustainable urban development.
Figure 1 The components of sustainable urban development
Sustainable urban development should involve social, economic and environmental in the decision-making phase (Rajabifard and others, 2001). Spatial data is one of the alternatives to help this decision-making process. High requirements for spatial data in decision-making processes help including issues related to sustainable urban development has led to the need to manage the spatial data through the establishment of Spatial Data Infrastructure, better known as SDI.
SDI is fundamentally about the facility and its coordination in the exchange and sharing of spatial data between stakeholders such as government departments, private companies, academia and local authorities. SDI has the potential to encourage stakeholders to use the available spatial datasets where it is important to increase the use of a technology in supporting the decision making process. Many projects and programs both at the national, regional and international organized to improve access to spatial data.
Rajabifard (2001) states that SDI is an important platform which it is helping in facilitating the sharing of spatial data and help users reduce costs, energy and time in obtaining this spatial data. Previous studies have shown that the role of SDI in providing spatial data to help the decision-making process for the application of sustainable urban development. Mary-Ellen Feeney et al. (2001), as quoted from (UNFIG 1999) identified the needs of SDI in providing spatial data in decision-making processes that involve issues related to social, economic, and environmental. Many private and government agencies have come to realize about the importance of sustainable urban development. Fuziah et al. (2007) noted that the National Spatial Data Infrastructure in Malaysia or better known as MyGDI provides spatial data needed by users and producers for the purpose of access, exploration as well as to be applied at all levels of government. According to Kamali (2010), MyGDI is a source of spatial data access to support sustainable urban development that includes economic growth and stability, environmental quality and social development.
Data is one of the components in MyGDI besides technology, policies, standards, and professional (Mohsin, 2006). As a Spatial Data Infrastructure in Malaysia, MyGDI should manage spatial data where the user can find, get information about the data and use the data supplied by the data provider agencies for use in various applications.
It involves the collaboration among all stakeholders, including the government either at the national, state and local level. Malaysian Centre for Geospatial Data Infrastructure (MaCGDI) is the agency responsible for establishing the scope MyGDI. MyGDI have listed include the implementation and coordination of policies, standards development and compliance, research and development of GIS technology, issues related to data security and the establishment of a monitoring spatial data framework.
Towards the government's objective to provide spatial data for all applications by 2015, to Fuziah (2012) states that MyGDI is an initiative set up to integrate spatial data that can be used for all applications. Among these applications are economic development, land administration, public works, town and country planning, real estate and facility management, national security, public safety, tourism, integrated coastal zone management and sustainable development.
Based on the above, this study was conducted to produce the conceptual framework as a guide in helping MyGDI to achieve objectives in providing a complete spatial data for the sustainable urban development application.
2.0 METHOD
This study is focusing on developing a conceptual framework for sustainable urban development applications for MyGDI through the method that is stated below:
a) Preliminary study b) Data collection c) Conceptual framework
Preliminary Study
This method involves the literature study related to sustainable urban development. Besides that, the literature study on SDI also included in this method. In this method, the literature study of the relationship between SDI and sustainable urban development is involved.
For sustainable urban development, it involves the concept of sustainable urban development. According to B. Giddings et al. (2002), sustainable development consists of three interrelated components of social, economic, and environmental. This view is supported by Keiner. M (2005) which states that the social, economic, and environment are the three main pillars of sustainable development. The success of an organization evaluated based on the achievement of the objectives achieved without compromising the relationship between the three dimensions namely social, economic, and environment (M. Mahoney and JL Potter, 2004).
The indicator is necessary to measure sustainability of cities. According to Ho C.S and Muhammad Z.H (2008), indicators accept as a necessity for planning and enable the future to be more sustainable at the local and global level. For survey purposes, indicators have to be related to its objective. Data has to be easily accessible and also easily organized as structured information. This method involves the literature study of indicators or critical fundamental dataset that are used for sustainable urban development in Malaysia. The indicators listed in MURNInet program developed by Department of Town and Country Planning is used as a guideline. Previous studies related with indicators for measuring sustainability in Malaysia are used as a comparison. The related documents with sustainable urban development are used as a reference such as Agenda 21 (1992), 9th National Plan (2006), National Urban Policy (2006), Vision 2020, and National Physical Plan (2010).
The literature study about the SDI and the relationship between SDI and sustainable urban development is important to support this study. One of the purposes is to identify the spatial data provided by MyGDI that related to sustainable urban development. MyGDI is now towards spatially enabled government where it will able to facilitate the spatial data that is needed for all applications including sustainable development (Fuziah, 2012). According to I. Masser, A. Rajabifard & I.
Sustainable
Social Economic
Williamson (2008), the objectives of spatially enabled government are:
More effective and more transparent coordination, where users are able to access the spatial information they require to evaluate the choices made by decision-makers
The creation of economic wealth through the development of products and services based on spatial information collected by all levels of government.
The maintenance of environmental sustainability through the regular and repeated monitoring of a wide range of spatial indicators distributed throughout the world as a whole.
Data Collection
For data collection, it is based on secondary resources. The secondary data sources are from journal, article, report, and others previous studies related to SDI and sustainable urban development. Website of MURNInet and MyGeoportal are also used as a reference.
The details of list of indicators that are used in measuring sustainability of the city are obtained from Johor Bahru City Council.
Conceptual Framework
In this method, it involves developing basic conceptual data framework, conceptual data model, conceptual data structure, and conceptual data layer.
Conceptual Data Framework
There are six general framework namely domain-based framework, goal-based framework, issue framework, sectoral framework, causal framework and combination framework (Virginia W. Maclaren, 1996). Each of the frameworks has advantages and disadvantages. To overcome the disadvantages, combination framework is a good option which can help in better measurement of urban sustainability (Masnavi, M.R, 2007). In this study, combination framework is used which combines domain-based framework and goal-based framework.
A domain-based framework consists of key dimension of sustainability namely social, economic, and environment and then identifies indicators for each key dimension. Some domain-based framework can consist of additional key dimension such as governance and infrastructure. The disadvantage of domain-based framework is that it does not directly link indicator with sustainability goals. To overcome disadvantage, goal-based framework is combined. Goal-based framework is used to provide an appropriate link between goals and indicators of sustainability. The spatial data and non-spatial data are determined through this conceptual framework. It is important before going to the next step which is developing a conceptual data model, conceptual data structure and conceptual data layer.
Conceptual Data Model
The data model is the process of abstraction the real world which incorporates only those properties thought to be relevant to the application or applications at hand, usually a human conceptualization of reality (Donna J. Peuquet, 2011). In this study, entity relationship modelling (ER model) approach is used to do the conceptual data model. H. Ma and K.-D. Schewe (2011) as cited Shekhar S (1999) states that conceptual modelling of
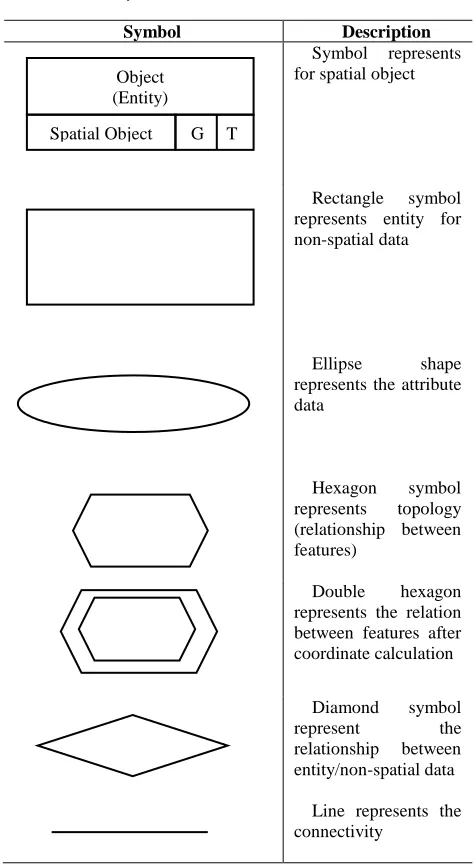
spatial data concerns geometry of spatial objects, the geometric relationship between the objects, their representation at multiple resolutions, their geometric evolution over time, and their spatial integrity constraints. ER model consist of entities, a relationship between entities, and connectivity. Each component has a different symbol.
Table 1 The basic symbol for ER Model (Norfazila, 2007)
Symbol Description
Symbol represents for spatial object
Rectangle symbol represents entity for non-spatial data
Ellipse shape represents the attribute data
Hexagon symbol represents topology (relationship between features)
Double hexagon represents the relation between features after coordinate calculation
Diamond symbol represent the relationship between entity/non-spatial data
Line represents the connectivity
Conceptual Data Structure
According to Donna J. Peuquet (2011), data structure is a representation of data model that usually shown in form of list, diagram, and arrays designed to reflect the recording of the data in computer code. The data structure is the way to organize a data. A data structure must follow the components defined in the data model. The purpose of developing a conceptual data structure is to minimize the storage requirements to reduce the size of data and to maximize the processing speed of geometrical operations performance.
Object (Entity)
Conceptual Data Layer
In GIS, concept of a layer is important. Any phenomenon can be represented as a layer since all things occur in a certain location and in a certain point of time. To put the world into the computer, we need an abstraction process that transforms real-world entities into mathematically manageable objects. Spatial data can be divided into three basic shape entities; point, line, and polygon/area. The example of spatial entities for point is a point of interest, water tanks, and school. While the example of spatial entities for line is road, river, and railway line. On the other hand, the example of spatial entities for area/polygon is residential area, distribution of urban poverty, and forest area. Spatial objects contain the information about location such as coordinate and relationship between features also known as topology. Each component is represented in different layer. For example, geometrical registered layer of land use, land parcel, and forest.
3.0 RESULTS AND DISCUSSION
This part will first present the result of literature survey of indicators for sustainable urban development. There are few studies in Malaysia related to indicators that are used for measuring urban sustainability. Before this, there have 55 indicators. These findings of this research are consistent with those of Ho C.S and Muhammad Z.H (2008) as cited the Federal Department of Town and Country Planning has formulated 11 sectors with consists of 55 indicators to measure urban sustainability. However, on 2011 the Malaysian Urban Rural National Indicator Network (MURNInet) is revised. There are few issues that make the MURNInet need to review. One of the issues is local authority participation is not exhaustive. Furthermore, selection indicators by Local Authority which not uniform and display the same indicators flat (no weightage pattern). These finding agree with Marlyana A.M et al. (2011) findings which showed only 10 indicators the most chosen by Local Authority. The 10 urban indicators are average daily garbage collection for each resident, the ratio of pre-school to the population, the ratio of halls to the population, the percentage allocation of financial for landscaping program, the percentage of area receiving garbage collection services, the number of noise complaints received in a year, percentage approval of C.F.O, local revenue per capita, the rate of tax collection, and expenditure per capita. From the research which involves 7 cities; Ipoh, Batu Pahat, Georgetown, Sepang, Teluk Intan, Selama, and Tangkak, the majority of Local Authorities did not use all the 55 indicators in measuring urban sustainability. Another issue that causes the review of MURNInet is the boundaries of the study area for data collection varies. Besides that, features and sectoral indicators are not updated according to the norms of lifestyle changes and key national policy is the issue related to the review of MURNInet. In 2012, MURNInet has come out with new indicators which consists of 5 strategic, 6 dimensions, 21 themes, and 36 indicators that are used to measure sustainability of cities that need to follow by local authorities (Figure 4).
Figure 3 Dimensions, themes, and indicators in MURNInet (Source: http://murninet.townplan.gov.my/murninets/)
A conceptual data framework is developed from the list of indicators in MURNInet as mention above (figure 3) as a reference and also the list of indicators given by Johor Bahru City Council. The results in a conceptual data framework are presented in figure 4 (competitive economy dimension), figure 5 (sustainable environmental quality dimension), figure 6 (prosperous community dimension), figure 7 (optimal land use and natural resources dimension), figure 8 (efficient infrastructure and transportation), and figure 9 (effective governance).
Figure 4 Competitive Economy Dimension
Figure 6 Prosperous Community Dimension
Figure 7 Optimal Land Use and Natural Resources Dimension
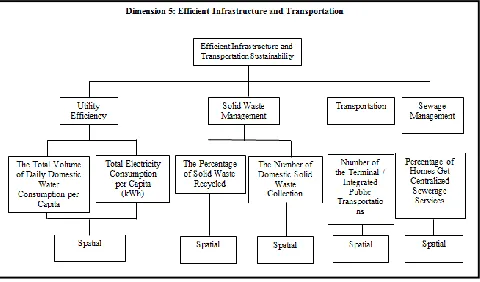
Figure 8 Efficient Infrastructures and Transportation
Figure 9 Effective Governance
The conceptual data framework is divided into 6 key dimensions. Each of the indicators is classified whether as a spatial data or non-spatial data. There are 30 indicators are classified as spatial data. The indicators are employment growth rate, urban poverty rate, poverty rate, percentage of residents living in the area prone to flooding, number of environmental programs/campaigns in Local Authority, percentage of affordable quality housing units, percentage of residential coverage within 400m of public facilities, the ratio of complaints relating to public nuisance to 10 000 population, the ratio of cases of water and vector-borne diseases to 10 000 population, percentage of Grade A business premises, percentage of public toilets that have been rated, the ratio of index crimes to 10 000 population, dependency ratio, urban rate, property unsold housing, number of community programs implemented by Local Authority, happiness index, the rate of land use changes from non-built up area to build up area, the ratio of provision of public open compared with 1000 population, number of tourism area and recreational centre, water quality index, air quality index, solid waste production per capita, the total volume of daily domestic water consumption per capita, total electricity consumption per capita (kWh), the percentage of solid waste recycled, the number of domestic solid waste collection schedule, percentage of homes get centralized sewerage services, percentage change in the area covered by forest, and number of the terminal / integrated public transport stations.
Table 2 List of indicators supported by MyGDI fundamental dataset
MyGDI Theme SUD Indicator
Built Environment a) The rate of land use changes from non-built up area to build up area b) The ratio of provision of public open compared with 1000 population c) Number of tourism area and recreational centre
d) Number of the terminal / integrated public transport stations e) Number of public facilities
Hydrography a) Water quality index
Vegetation a) Percentage change in the area covered by forest
An example of the results for conceptual data model is showed in figure 10.
Figure 10 ER Diagram for Competitive Economy Dimension
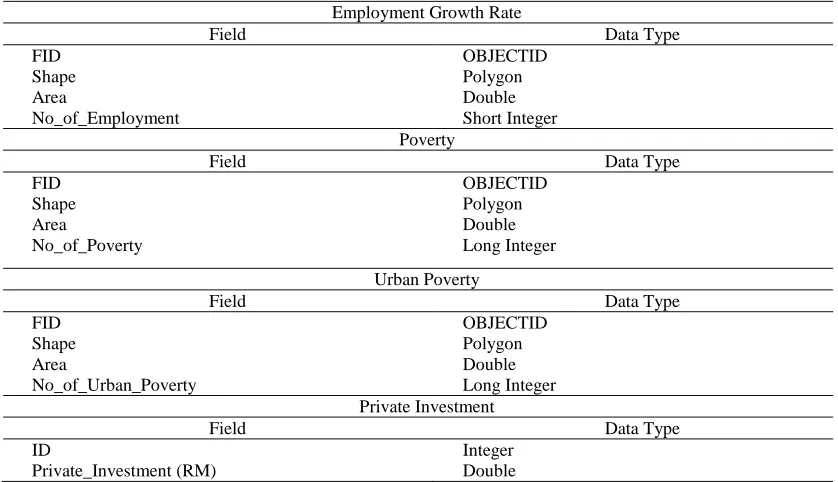
An example of the results for conceptual data structure is showed in Table 3.
Table 3 Conceptual Data Structure for Competitive Economy Dimension
Employment Growth Rate
Field Data Type
FID OBJECTID
Shape Polygon
Area Double
No_of_Employment Short Integer Poverty
Field Data Type
FID OBJECTID
Shape Polygon
Area Double
No_of_Poverty Long Integer
Urban Poverty
Field Data Type
FID OBJECTID
Shape Polygon
Area Double
No_of_Urban_Poverty Long Integer Private Investment
Field Data Type
ID Integer
The results for conceptual data layer are produced based on results of conceptual data model and conceptual data layer. There are 30 data layer that can be generated from the spatial data indicators. From 30 data layer, 12 data layers are categorized under point shape. While 17 data layers are categorized under polygon shape and only 1 data layer is under line shape category. Much information can be generated from these layers. For instance, a total number of employment growth rates can be generated from employment growth rate layer. While for poverty layer, information for a total number of poverty populations in selected area can be showed.
A number of polluted rivers along with its location can be known from water quality index layer. Besides, the location which has good air quality index can be generated from air quality index layer. The population living flood area layer can give information of percentage of residents living in the area prone to flooding. A percentage of solid waste production in selected area can be known from solid waste production layer. Besides that, information of name and number of environmental program can be generated from environmental program layer. The layer of affordable quality housing can shows the information for percentage of affordable quality housing. This layer can be overlay with housing layer. Buffer method can be used to shows the percentage of residential coverage within 400m of public facilities.
Besides that, land use layer can produce the rate of land use changes from non-built up area to build up area, while the ratio of provision of public open compared with 1000 population can be showed from public open layer. The urban rate layer can give the information of a total number of urban populations in selected area. Furthermore, the information of the number of unsold housing can be produced from housing layer and the number of tourism place and recreational can be known from tourism and recreational place layer. The percentage change in the area covered by forest can be shown in forest layer.
4.0 CONCLUSION
The development of conceptual framework as a guide in helping MyGDI to achieve objectives in providing a complete spatial data for the sustainable urban development applications is the goal of this study. Six conceptual date frameworks were produced based on the 6 key dimensions. This study has shown that from 36 indicators used to measure sustainability of city, 30 of its are categorized as spatial data and the rest are non-spatial data. Besides that, 7 spatial indicators are supported by MyGDI fundamental dataset from total 30 spatial indicators. There are 6 conceptual data model represented in Entity Relationship Modelling method and 6 conceptual data structure represented in table. Finally, 30 spatial data layer can be produced based on the conceptual data model and conceptual data layer. From 30 data layer, 12 data layers are categorized under point shape. While 17 data layers are categorized under polygon shape and only 1 data layer is under line shape category. Much information can be generated from these layers. However, these findings are only true for conceptual design level. The same study needs to be conducted for logical design level as well as physical design level.
References
[1] Akimasa Fujiwara, J. Z. 2005. Evaluating Sustainability of Urban
Development In Developing Countries Incorporating Dynamic
Cause-Effect Relationships Over Time. Journal of the Eastern Asia Society for
Transportation Studies. (6) : 4349–4364.
[2] Bob Giddings, B. H. a. G. O. B. 2002. Environment, Economy and
Society: Fitting Them Together Into Sustainable Development.
Sustainable Development. (10) : 187–196.
[3] Hanifah, F. A., Z. A. M., Hazri Hassan. 2007. SDI Approach in The
Improved Use of Geospatial Data in Government. Implementing National Spatial Data Infrastructure (NSDI) in Malaysia, Johor Bahru,Malaysia.
[4] Hanifah, F. A. 2012. Malaysian NSDI: Towards Spatially Enabled
Government and Society. Unrcc-Pcgiap International Symposium on Spatially Enabled Government and Society, Kuala Lumpur.
[5] Ho Chin Siong, M. Z. S. M. H. 2008. Modeling Urban Quality Of Life
with Data Envelopment Analysis Methods. Universiti Teknologi Malaysia. 1–172.
[6] I. Masser, A. R., I. Williamson. 2008. Spatially Enabling Eovernments
through SDI Implementation. International Journal of Geographical
Information Science. 22(1) : 5–20.
[7] Infrastructure, M. C. f. G. D. MyGDI. MyGDI Data Categories
Retrieved November 20, 2012, from
http://www.mygeoportal.gov.my/58.aspx
[8] Kamarudin Ngah, J. M., Zaherawati Zakaria, Nazni Noordin, Mohd
Zool Hilmie Mohamed Sawal. 2011. Formulation of Agenda 21 Process
Indicators for Malaysia. Journal of Management and Sustainability.
1(1).
[9] Mary-Ellen Feeney, A. R., and Ian P. Williamson. 2001. Spatial Data
Infrastructure Frameworks to Support Decision-Making for Sustainable
Development. Future Directions for the Development of Spatial Data
Infrastructure. 1–13.
[10] M. Mahoney, J.-L. P. 2004. Integrating Health Impact Assessment Into
The Triple Bottom Line Concept. Environmental Impact Assessment
Review. 24(2) : 151–160.
[11] Maclaren, V. W. 1996. Urban Sustainability Reporting. Journal of the
American Planning Association. 62(2) : 184–202.
[12] Marlyana Azyyati Marzukhi, D. O., Oliver Ling Hoon Leh, Muhammad
Sharil Hamir, Maassoumeh Barghchi. 2011. Malaysian Urban Indicators Network: A Sustainable Development Initiative in Malaysia.
European Journal of Social Sciences. 25(1) : 77–83.
[13] Masnavi, M. R. 2007. Measuring Urban Sustainability: Developing a
Conceptual Framework for Bridging the Gap Between theoretical
Levels and the Operational Levels. International Journal Environment
Res.1 : 188–197.
[14] Mohamad, D. S. D. M. Vision 2020 Retrieved February 21, 2013,from
http://www.pmo.gov.my/?menu=page&page=1904#
[15] Munasinghe, M. 2013. Sustainable development triangle. In C. J.
Cleveland (Ed.). Encyclopedia of Earth. Washington D.C: Washington,
D.C.: Environmental Information Coalition, National Council for Science and the Environment.
[16] Norfazila, G. 2007. Model Data Geospatial Untuk Enterprise GIS bagi
Pihak Berkuasa Tempatan Pasir Gudang. Bachelor of Science
(Geoinformatics). Universiti Teknologi Malaysia,
Skudai,Johor,Malaysia.
[17] Planning, D. o. T. C. 2006. National Urban Policy.1–109.
[18] Planning, D. o. T. a. C. 2010. Natinal Physical Plan. 1-306. Malaysia.
[19] Planning, D. o. T. a. C. 2013. Background of MURNInet (Original) &
MURNInets (New). Retrieved November 13, 2012, from
http://murninet.townplan.gov.my/murninets/page/apa-itu-murninet
[20] Peuquet, D. J. 2011. A Conceptual Framework and Comparison of
Spatial Data Models. Classics in Cartography: Reflections on Influential
Articles from Cartographica.
[21] Rajabifard, A. 2001. SDI Hierarchy From Local to Global SDI
initiatives. Open Seminar on SDI in Asia and the Pacific Region 7th PCGIAP meeting, Tsukuba, Japan.
[22] Schewe, H. M. a. K.-D. 2011. Conceptual Geometric Modelling. In B.
T. D.W. Embley (Ed.), Handbook of Conceptual Modeling. 421–440.