Division IX (include assigned division number from I to X)
A Study on Isolation Performance of Eradi Quake System using Shaking
Table Test and Analysis
Hong-Pyo-Lee1, Myung-Sug Cho2, Yeon-Soo Moon3, Woo-Jin Han4 , Yong-Soo Ji5
1
Senior researcher, Plant Const. & Eng. Lab., KHNP-Central Research Institute, Korea
2
Senior researcher, Plant Const. & Eng. Lab., KHNP-Central Research Institute, Korea
3
Researcher, R&D Center, ESCORTS Co. Ltd., Korea
4
Senior Researcher, R&D Center, ESCORTS Co. Ltd., Korea
5
Director, R&D Center, ESCORTS Co. Ltd., Korea
ABSTRACT
Recently, there is a growing interest in seismic performance of structures due to frequent earthquakes in Korea. In order to minimize the earthquake damage of structures, seismic isolation systems are used to reduce vibration of structures. In Korea, seismic isolation systems for large structures such as nuclear power plants are being studied, but there are no standards and methods for evaluating seismic isolation systems for structures. In this study, a scale down model was constructed for the APR 1400 nuclear structure, and the performance of the device was verified by comparing the seismic analysis of the scale down model with the design and experimental results. Also, the results of shaking table tests were compared and analyzed with and without EQS, which is a friction type seismic isolator. As a result, the response acceleration of the EQS - based seismic structures decreased significantly compared to non-isolated structure.
INTRODUCTION
Unlike countries such as Europe, Japan, and the United States, which are trying to secure safety for large and small earthquakes around the world, Korea has been thought to be far from the active plate boundary where there is little risk of an earthquake. However, interest in the seismic performance of the structures has been amplified from the earthquake that occurred in September 2016 in Gyeongju including the Hongseong earthquake of 5.0 in 1978. In Europe and the United States and other countries, seismic isolation systems are already in use to reduce vibrations of structures to prevent earthquake damage of large structures such as major buildings, bridges and nuclear power plants. In Korea, research activities using seismic isolators for large structures such as nuclear power plants are increasing, but there are no criteria and methods for evaluating seismic isolators for structures.
The 'LRB' and 'EQS', using PTFE friction plate, are representative examples of a seismic isolation device used in recent days. Kim et al.(1999) examined the dynamic characteristics of friction material though friction coefficient tests and the shaking table test of a scale model bridge to examine the seismic performance of the device. Also, Yi et al.(2002) & Chung et al.(1999) estimate the seismic performance of the structure at the 3rd floor & 5th floor by using shaking table tests, and checking the effect of a device by seismic motion. Kim et al. (2004) assessed the seismic safety of nuclear power plants through the shaking table test.
SPECIMEN OF ISOLATOR
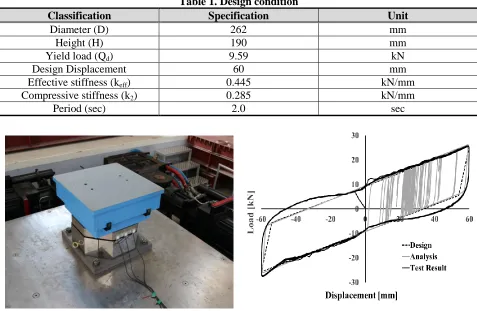
The seismic isolator EQS (Fig. 1) used in this test has the function of attenuating energy from the friction of the sliding friction material. The performance of the seismic isolation system can be judged by the effective stiffness (keff) and the energy dissipation per cycle (EDC). In order to evaluate the performance
of the device, a device with the same conditions as in Table 1 was fabricated and the horizontal shear test was performed. The test was performed at a design speed of 100 mm/sec at a design displacement of 60 mm. In order to understand the behavior and stability of the device before the shaking table test, seismic analysis was carried out using actual measured seismic waves. As shown in Fig. 2, it is confirmed that the behavior graph calculated by the design formula and the behavior graph calculated by the design and analysis show the same behavior, and the error of the design effective stiffness is confirmed to be within 4%.
Table 1. Design condition
Classification Specification Unit
Diameter (D) 262 mm
Height (H) 190 mm
Yield load (Qd) 9.59 kN
Design Displacement 60 mm
Effective stiffness (keff) 0.445 kN/mm
Compressive stiffness (k2) 0.285 kN/mm
Period (sec) 2.0 sec
Fig 1. Test specimen Fig 2. Load-displacement curve
SPECIMEN OF TEST STRUCTURE
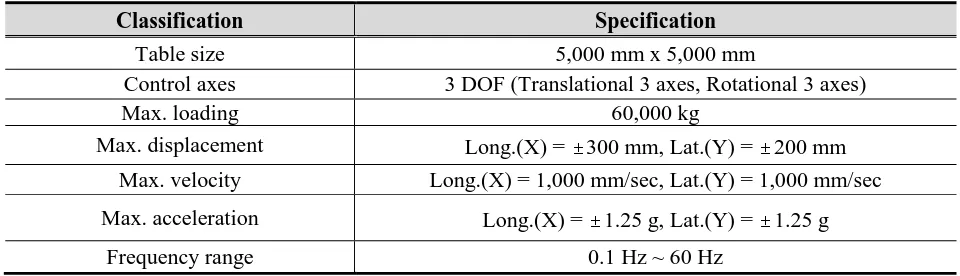
shows the fabricated two-story steel structure, and the dimensions of the structure are 3,800 mm x 3,800 mm x 5,030 mm (L x W x H). Table 2 shows the specifications and performance of the six-degree-of-freedom shaking table used in the test. The section is 5,000 mm x 5,000 mm and the maximum load is 60 ton. The maximum displacement is ± 300 mm in the X axis, ± 200 mm in the Y axis, the maximum velocity is 1,000 mm/sec, and the maximum acceleration is ± 1.25 g.
a) Side view b) General view
Fig 3. Specimen of Test structure
Table 2. Dimension and specification for shaking table
Classification Specification
Table size 5,000 mm x 5,000 mm
Control axes 3 DOF (Translational 3 axes, Rotational 3 axes)
Max. loading 60,000 kg
Max. displacement Long.(X) = ±300 mm, Lat.(Y) = ±200 mm
Max. velocity Long.(X) = 1,000 mm/sec, Lat.(Y) = 1,000 mm/sec
Max. acceleration Long.(X) = ±1.25 g, Lat.(Y) = ±1.25 g
Frequency range 0.1 Hz ~ 60 Hz
SHAKING TABLE TEST
In this test, an accelerometer was installed in the middle of the shaking table and each slab as shown in Fig. 4 a), b) and c), and a displacement meter for horizontal movement was installed where seismic device was installed. The load cell as shown in Fig. 4 d) was installed between the seismometer and the shaking table installed on the column of each structure. The RRS (Required Response Spectrum) of the seismic waves input to the shaking table used the spectrum for the 5% damping ratio given in the Reg. Guide 1.60 (Fig. 5).
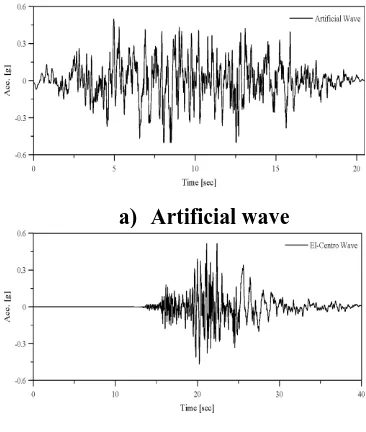
verification of seismic isolation devices, one artificial seismic wave shown in Fig. 6, two recorded seismic waves (EI-Centro, Kobe) were selected. Non-isolated structures without seismic isolation were tested for PGA 0.3 g artificial earthquakes and EI-Centro seismic waves except for Kobe seismic waves due to the possibility of structural damage to Kobe seismic waves of PGA 0.3 g, which is a 60% magnification of design seismic waves. The test was carried out only on the X axis by confirming the rotation of the bottom plate of the specimen column due to insufficient fastening force at the Y axis.
a) Accelerometer of shaking table b) Accelerometer of 2nd floor slab
c) Accelerometer of 3rd floor slab d) Loadcell
Fig 4. Locations of accelerometer and loadcell
a) Artificial wave
RESULT OF TEST FOR NON -ISOLATION
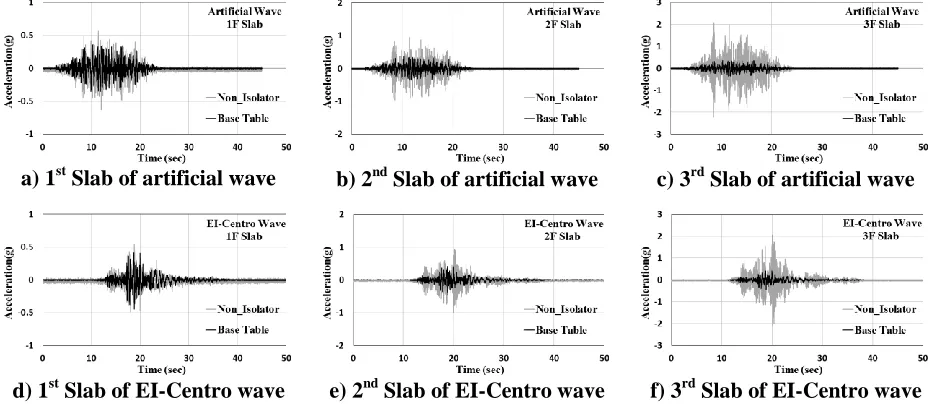
In order to understand the response tendency of the non-isolated structure due to the input seismic wave, the response acceleration results in the shaking table and each layer are compared as shown in Fig 7. Fig. 7 a) to c) show the response acceleration of each layer to the artificial seismic waves, Fig. 7 d) to f) show the response acceleration results of each layer to the measured seismic waves. The response acceleration of the shaking table was confirmed to be about 0.4g or more, which was more than 30% greater than the input seismic wave. Acceleration measured in one-story slab compared to shaking table showed almost similar tendency, but it showed amplification tendency in two- and three-story slabs. In the case of the acceleration measured in the two-story slab, it was confirmed that the acceleration was more than twice that of the shaking table response acceleration and more than four times in the three-story slab. It is considered that the largest acceleration occurred at the upper part of the structure because the displacement caused by the seismic wave was larger as the layer got higher. Fig. 8 shows the results of the floor response spectrum (FRS) which can confirm the response of the structure by the input seismic wave. Fig. 8 a) to c) show the response spectrum of each layer for artificial seismic waves, and Fig. 8 d) to f) show the response spectrum results for the measured seismic waves. It is shown that the resonance of the structure occurred at 3.78Hz for both the artificial and metrological seismic waves, and the responses of the two- and three-story slabs were significantly increased.
a) 1st Slab of artificial wave b) 2nd Slab of artificial wave c) 3rd Slab of artificial wave
d) 1st Slab of EI-Centro wave e) 2nd Slab of EI-Centro wave f) 3rd Slab of EI-Centro wave
Fig 7. Floor acceleration comparison of base table with non-isolation
d) 1st Slab of EI-Centro wave e) 2nd Slab of EI-Centro wave f) 3rd Slab of EI-Centro wave
Fig 8. Floor response spectrum comparison of base table with non-isolation
RESULT OF TEST FOR ISOLATION
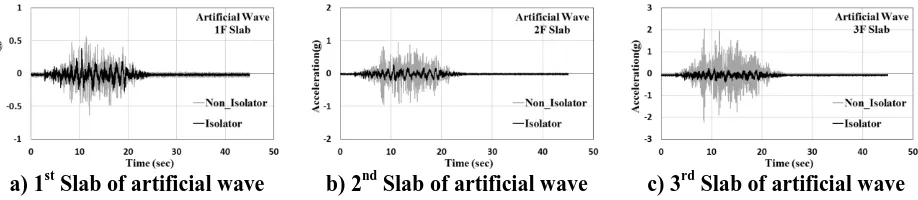
In order to understand the tendency of the responses due to the seismic isolation system applied to the two-story steel structure, the comparison was performed as in Fig 9. with the response of the non-isolated structure. Fig. 9 a) to c) are artificial seismic waves, Fig. 9 d) to f) are graphs of response acceleration results for measured seismic waves. It was confirmed that the response acceleration of the isolated structure compared to the response acceleration of the non-isolated structure was greatly reduced in both the artificial and the measured seismic waves. Table 3 summarizes the results of stratified response acceleration for the non-isolated and isolated structures for each seismic wave. The response acceleration of the one-story slab of the isolated structure compared to the non-isolated structure was 30% or more, 70% or more in the two-story slab, and 80% or more in the three-story slab. This shows that the risk of non-isolated structures due to input seismic waves can be reduced and the response of structures can be reduced and the damage of structures can be minimized from the application of seismic isolation systems. Fig. 10 shows the results of the layer response spectrum of the seismic and non-isolated structures, Fig. 10 a) to c) are the results of artificial seismic waves, Fig. 10 d) to f) are the measured seismic waves. The maximum response point of the non-isolated structure is seen in the natural frequency band of the structure, but the maximum response occurs in the frequency band other than the natural frequency band. It is considered that the short-period component of the structure is long-circuited by the application of the seismic isolation system, and the response generated in the structure is reduced by avoiding the resonance of the structure. Also, the response of the non-isolated structure was amplified by artificial and seismic waves, but it was confirmed that the response of the seismic structure was greatly reduced. This means the degree of damage of the structure, and it seems that the damage caused by seismic waves can be greatly reduced when the seismic isolator is applied.
d) 1st Slab of EI-Centro wave e) 2nd Slab of EI-Centro wave f) 3rd Slab of EI-Centro wave
Fig 9. Floor acceleration comparison of non-isolation with base-isolation
Table 3. Comparison of reduction ratio for floor acceleration
Classification PGA, Acceleration [g] Reduction ratio [%] Non-isolator Isolator
Artificial wave
1st Slab 0.63 0.39 38
2nd Slab 0.95 0.26 73
3rd Slab 2.22 0.37 83
EI-Centro wave
1st Slab 0.54 0.43 20
2nd Slab 0.99 0.25 75
3rd Slab 2.12 0.43 80
a) 1st Slab of artificial wave b) 2nd Slab of artificial wave c) 3rd Slab of artificial wave
d) 1st Slab of EI-Centro wave e) 2nd Slab of EI-Centro wave f) 3rd Slab of EI-Centro wave
Fig 10. Floor response spectrum comparison of non-isolation with base-isolation
CONCLUSION
1. Maximum response frequency band of the non-isolation system was equal to that of the resonance of the structure, but, for the isolated structure, the maximum response could be found in a frequency band other than the natural frequency band. In conclusion, the structure avoids resonance because of the changed short-period component of the structure to the long-period component by applying an isolation system, and the response of with isolation compared to non-isolation was greatly reduced due to the changed resonance.
2. Response acceleration of non-isolation was found to be increasing as the floor gets higher, however, it was confirmed that the acceleration was constant in all floors of the isolated structure. Also, response acceleration with isolation compared to non-isolation was confirmed with a reduction ratio of over 30% in the first-floor slab, over 70% in the second-floor slab and over 80% in the third-floor slab. It is considered that the seismic damage can be minimized by applying an isolation system which could reduce the acceleration of the structure.
3. PGA 0.3g occurred after adjustment of the magnification of the input ground motions of PGA 0.5g, but, measured response acceleration in the actual shaking table test occurred over PGA 0.4g. Therefore, it is considered that the isolation system used in the test can generate a substantial response for seismic waves over PGA 0.4g.
Reference
Bang, I. S. (2011). “Experiences of Sliding Isolation Disk Bearing in Korea” 7th World Congress on Joints Bearings and Seismic Systems for Concrete Structures, USA.
Chung, W. J., Yun, C. B., Kim, N. S. and Seo, J. W. (1999). “Shaking Table and Pseudodynamic Tests for the Evaluation of the Seismic Performance of Base-Isolated Structures,” Engineering Structures, Elsevier, Republic of Korea.
Chung, Y., Nagae, T., Matsumiya, T. and Nakashima, M. (2010). “Seismic Resistance Capacity of Beam-Column Connections in High-Rise Buildings: E-Defense Shaking Table Test,” Earthquake
Engineering and Structural Dynamics, Wiley, Japan.
Chung, Y., Nagae, T., Hitaka, T. and Nakashima, M. (2010). “Seismic Resistance Capacity of High-Rise Buildings Subjected to Long-Period Ground Motions: E-Defense Shaking Table Test,” Structural Engineering-ASCE, ASCE-library, Japan.
Jeon, B. G., Chang, S. J. and Kim, N. S. (2011). “Seismic Performance Evaluation of Cone-Type Friction Pendulum Bearing System Using Shaking Table Test,” The Korean Society for Noise and Vibration Engineering, Korea science, Republic of Korea.
Jung, D. Y. (2011). “Dynamic and Long-term Behavior Characteristics of Sliding Isolation Disk Bearing with Polyurethane and PTFE,” Incheon National University, Ph.D Thesis.
Kelly, J. M. (1986). “Aseismic Base Isolation : Review and Bibliography,” Soil Dynamics and Earthquake Engineering, Elsevier, California.
Kim, M. K., Choun, Y. S. and Choi, I. K. (2004). “A Shaking Table Test for Equipment Isolation in the NPP (I) : Rubber Bearing,” Earthquake Engineering Society of Korea, Korea science, Republic of Korea.
Kim, Y. S., Im, J. S., Yun, C. B. and Kim, N. S. (1999). “Shaking Table Tests and Simplified Analysis of Bridge with Base Isolators Consisting of PTFE Plates and Rubber Rings,” Korean Society of Civil Engineers, Republic of Korea.
Korea Road and Transportation Association, Limit-State Based Bridge Design Specification. (2012). Ministry of Load Infrastructure and Transport.
Tsai, M. H., Wu, S. Y., Chang, K. C. and Lee, G. C. (2007). “Shaking Table Tests of a Scaled Bridge Model with Rolling-Type Seismic Isolation Bearings,” Engineering Structures, Elsevier, Taiwan. Sato, E., Furukawa, S., Kakehi, A. and Nakashima, M. (2011). “Full-Scale Shaking Table Test for
Examination of Safety and Functionality of Base-Isolated Medical Facilities,” Earthquake Engineering and Structural Dynamics, Wiley, Japan.
![Table 3. Comparison of reduction ratio for floor acceleration PGA, Acceleration [g]](https://thumb-us.123doks.com/thumbv2/123dok_us/1194568.1150015/7.612.67.546.213.566/table-comparison-reduction-ratio-floor-acceleration-pga-acceleration.webp)
