ABSTRACT
IRIZARRY, AMARILYS DIANNE. Avian Response to Shade-Layer Restoration in Coffee Plantations in Puerto Rico. (Under the direction of Dr. Jaime A. Collazo).
Modernized coffee production schemes that involve the removal of shade trees as a
means to increase yields are a major cause of habitat degradation in agricultural landscapes in
the tropics. In Puerto Rico, the U.S. Fish and Wildlife Service (USFWS) and Natural
Resource Conservation Service (NRCS-USDA) have worked together since 2003 to restore
the shade-layer in coffee plantations through a “land sharing” ecological restoration strategy.
Conversion of sun to shade coffee plantations has been effectively employed by the said
agencies to enhance habitat features and recover ecological services associated to the
shade-layer. Documenting the dynamic nature of restoration processes, and in particular, how long
it takes to detect specific ecological signals, are crucial to evaluate restoration success and
identify ways to improve management practices. This work was designed to quantify, for the
first time, the impact (positive or negative) of shade restoration on the resident avian
community, and determine the time at which potential impacts are detected relative to the
time since the implementation of the restoration action. We estimated avian occupancy
probability and abundance as a function of time since restoration in 65 restored farms, which
we classified into 3 equally-spaced categories according to year of implementation: New
(2011-2014), Intermediate (2007-2010), and Old (2003-2006). As expected, vegetation
structure became more complex over time. Most forest-dependent species (e.g., Loxigilla portoricencis) exhibited higher occupancy and abundance 6-10 years post-restoration. Occupancy and abundance of open-habitat species (e.g., Tiaris olivaceus) were more variable, but most prevalent in recently restored farms. Moreover, we employed
types in farms were used within a season. This work focused on the Puerto Rican Bullfinch
(Loxigilla portoricencis), a common, endemic forest-specialist. We also evaluated local inter-annual extinction probabilities of 2 insectivores (Vireo latimeri, Mimus polyglottos), and 2 frugivores (Loxigilla portoricensis, Patagioneas squamosa) to further our understanding of the relationship between restoration efforts and species persistence. The daily probability of
detecting bullfinches within farms (0.89) and restored parcels (0.57 early season) within
farms suggested Puerto Rican Bullfinches were not transients, but instead, individuals that
had territories and portions of their home ranges within farms. Radio-tagged birds used
secondary forest in greater proportion to its availability, indicating selectivity for this habitat
type. Restored shaded coffee was used proportionally to its availability, whereas open coffee
was used less than expected. Decreasing farm annual extinction rates with increasing forested
cover (e.g., secondary forest, shaded coffee) affirmed the value of the restoration program.
Our study showed that avian species respond positively to structural changes induced by the
shade-restoration program in Puerto Rico, and that responses are interpretable in terms of
species persistence. We discuss conservation implications of our findings in light of
conservation design strategies in Puerto Rico, and other areas in the tropics where sun and
© Copyright 2017 Amarilys Dianne Irizarry
Avian Response to Shade-layer Restoration in Coffee Plantations in Puerto Rico
By
Amarilys D. Irizarry
A thesis submitted to the Graduate Faculty of North Carolina State University
in partial fulfillment of the requirements for the degree of
Master in Science
Zoology
Raleigh, North Carolina
2017
APPROVED BY:
_______________________________ _______________________________
Dr. Jaime A. Collazo Dr. J. Krishna Pacifici
Committee Chair
_______________________________ Dr. Brian J. Reich
DEDICATION
I dedicate this thesis to “Tío”, Manuel A. Irizarry. Your unconditional love and support
have helped overcome many challenges throughout my life. Graduate school was not the
BIOGRAPHY
Amarilys is originally from Mayagüez, Puerto Rico. She graduated cum laude with a
Bachelor of Science in Biology from the University of Puerto Rico in Mayagüez, in 2011.
During that time, she conducted undergraduate research supervised by Dr. Sonia Borges and Dr.
Fernando Bird-Picó, where her interest and passion for the field of Ecology and Conservation
Biology was fostered.
Upon graduation, she began working as a research technician for North Carolina State
University in southwestern Puerto Rico, under the supervision of Dr. Jaime A. Collazo. She
spent three years gaining experience and assisting in different research projects, before accepting
a graduate position with Dr. Collazo within the North Carolina Fisheries and Wildlife
Cooperative Research Unit at NC State University. While still a graduate student at NC State
University, she had the opportunity to present her master’s research work at the 21st Birds
Caribbean international conference in Cuba, where she was recognized with the Founder’s
Award for best student paper. During her last semester in graduate school, Amarilys has worked
part-time for the North Carolina Museum of Natural Sciences, teaching community outreach
programs.
Upon completion of her master’s degree in 2017, Amarilys plans to continue her career in
ecological research, working as a research associate and project coordinator for the Perfecto and
ACKNOWLEDGMENTS
This project has been possible thanks to the contributions of many. There truly are no
words to express my gratitude to my graduate advisor, Dr. Jaime A. Collazo, for giving me the
opportunity to pursue graduate studies and conduct this research. Your constant support and
encouragement throughout this entire process have meant the world to me. Thank you for your
exceptional guidance during the past three years and for making North Carolina feel like home. I
will always be grateful for having you as my mentor. I also thank my committee members, Dr.
Krishna Pacifici and Dr. Brian J. Reich for their support with study design of this project and
guidance over the years.
Funding for this project was provided by the Puerto Rico Department of Natural and
Environmental Resources, and the U.S. Fish and Wildlife Service. I would like to acknowledge
the Caribbean Ecological Services Field Office of the U.S. Fish and Wildlife Service, especially:
Iván Llerandi-Román, José Cruz-Burgos, Xiomara Labiosa-Colón, and Jennifer Valentín, for
being our direct link to contacting farmers and providing all information related to the
shade-restoration program. Special thanks to Nidia Trejo from Envirosurvey, Inc., for also providing
contact information of coffee-growers during initial stages of the project.
A big thank you to Curtis Belyea for assistance with ArcGIS. The many hours you spent
looking at aerial images of coffee farms and helping me fix my GPS coordinate-issues are
greatly appreciated! Thank you for your patience and for teaching me everything I know about
the “art” of GIS. Special thanks to Dr. Jim Hines, who assisted with R code and statistical
analyses for this project, and to Alexis Dragoni, who assisted with the process of obtaining aerial
I would like to recognize our team of field technicians: Beatriz Romero, Luis
Rodriguez-Sanoguet, Joshua Morel, Mel Rivera, Ray Robles, Nahíra Arocho, Raymond Balaguer, Alcides
Morales, Orlando Medina, Isamarie Acosta, Edna Diaz, and Rafael Chaparro. This project would
not have been possible without your hard work and dedication throughout our field seasons.
Thank you all for your enthusiasm and for putting up with my Hamilton obsession during many
(fun) hours of driving in the field! Special thanks to Sam Jolly, for assistance with data entry.
This project would not have been possible at all without the 65 farm owners who granted us
access to their coffee farms, in which field work was conducted.
I must acknowledge administrative support from the staff at the NCSU Department of
Applied Ecology, especially Susan Marschalk and Freha Legoas. I extend my deepest gratitude
to Mr. Ruby Valeton, whose logistical support and attention to detail has been instrumental to the
success of this project.
I would also like to express thanks to the DRNA staff at the José L. Vivaldi Aviary in Rio
Abajo State Forest, for providing our field crew with a place to stay during the various weeks we
spent working in the Utuado area. Special thanks to Brian Ramos-Güivas for welcoming our
team to the illustrious Chalet, which became our second field-home.
To my fellow Collazo-Pacifici lab mates: Sara Prado, Kelen Dowdy, Katy Battle and
Phillip Patton; thank you all for providing much needed moral support and words of
encouragement since day one. It has been an honor working with you all. To my office-buddy
and some may even say twin sister, Liani Yirka, thanks for everything!
TABLE OF CONTENTS
LIST OF TABLES ... viii
LIST OF FIGURES ... x
CONCEPTUAL OVERVIEW ... 1
LITERATURE CITED ... 5
CHAPTER 1: OCCUPANCY AND ABUNDANCE OF RESIDENT AVIAN SPECIES IN SHADE-RESTORED COFFEE PLANTATIONS IN PUERTO RICO ... 10
ABSTRACT ... 10
INTRODUCTION... 12
METHODS ... 16
STUDY AREA ... 16
AVIAN SURVEYS ... 17
VEGETATION SURVEYS ... 17
ANALYSES ... 19
RESULTS ... 21
VEGETATION STRUCTURE ... 21
AVIAN RESPONSES ... 21
DISCUSSION ... 24
LITERATURE CITED ... 27
TABLES AND FIGURES ... 34
CHAPTER 2 ... 51
HABITAT SELECTION AND LOCAL DYNAMICS OF RESIDENT AVIAN SPECIES ON RESTORED SHADE-COFFEE PLANTATIONS IN PUERTO RICO ... 51
ABSTRACT ... 51
INTRODUCTION... 53
METHODS ... 55
STUDY AREA ... 55
RADIO TELEMETRY ... 56
VEGETATION STRUCTURE ... 58
HABITAT SELECTION ... 59
SPECIES DYNAMICS ... 60
Daily Parameter Rates ... 60
Inter-annual Extinction Rates ... 61
RESULTS ... 62
LOCAL DYNAMICS ... 63
DISCUSSION ... 64
LITERATURE CITED: ... 67
TABLES AND FIGURES ... 73
LIST OF TABLES CHAPTER 1
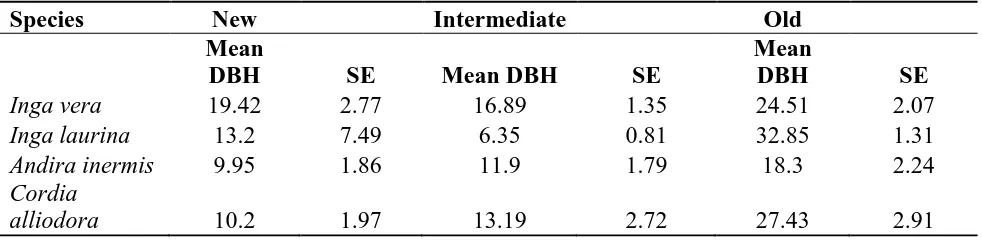
Table 1. Average diameter at breast height (DBH) of 4 species of trees used to restore shade in coffee plantations in the central mountains of Puerto Rico. Averaged are grouped by time-since-restoration. New (2003-2006), Intermediate (2007-2010), and Old (2011-2014). …...……... 34
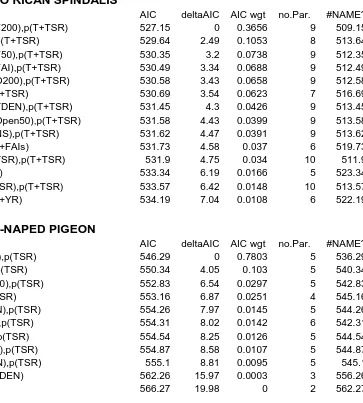
Table 2. Model selection tables for single-season, single species occupancy models used to estimate occupancy (psi) and detection (p) probabilities for 5 frugivorous, forest-dependent species of resident avian species in shade-restored farms in the central mountainous region of Puerto Rico, 2015-2016. Models are ranked by their respective AICc values. Competing models (ΔAICc ≤ 2) are indicated with an asterisk. Model covariates were year (YR), time-specific detection (T), time-since-restoration (TSR), NS (open, sun coffee plantation vs rest of restored farms), forest cover (F50m, F200m), open habitat (O50m, O200m), , tree and shrub density (TDEN, SDEN), and fruit availability index, seasonal (FAI) and by sampling occasion (FAIs). ………...………..…. 35
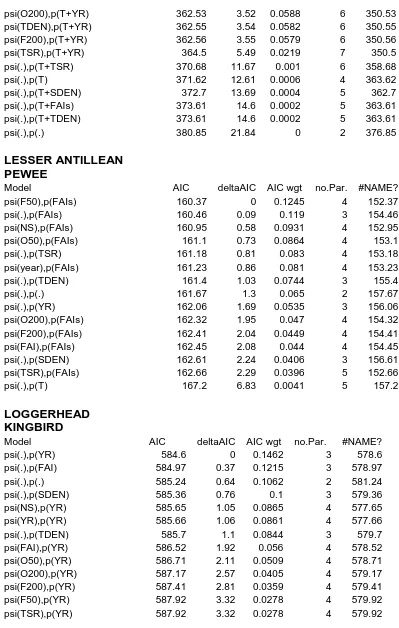
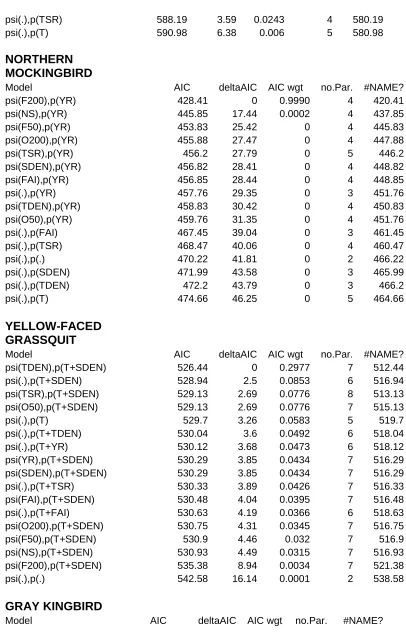
Table 3. Model selection tables for single-season, single species occupancy models used to estimate occupancy (psi) and detection (p) probabilities for 7 species of insectivore and granivore species of resident avian species in shade-restored farms in the central mountainous region of Puerto Rico, 2015-2016. Models are ranked by their respective AICc values.
Competing models (ΔAICc ≤ 2) are indicated with an asterisk. Model covariates were year (YR), time-specific detection (T), time-since-restoration (TSR), NS (open, sun coffee plantation vs rest of restored farms), forest cover (F50m, F200m), open habitat (O50m, O200m), , tree and shrub density (TDEN, SDEN), and fruit availability index, seasonal (FAI) and by sampling occasion (FAIs). .………...38
CHAPTER 2
Table 1. Habitat Selection for 20 Puerto Rican Bullfinch with radio transmitters in
shade-restored farms in the central mountainous region of Puerto Rico, 2016. ……… 73
Table 2. Model selection tables for multi-season occupancy models used to estimate occupancy (psi), colonization (gamma) and extinction (eps) rates and detection (p) probabilities for 5 species of resident avian species in shade-restored farms in the central mountainous region of Puerto Rico, 2015-2017. Models are ranked by their respective AICc values. Competing models (ΔAICc ≤ 2) are indicated with an asterisk. Model covariates were year (YR),
time-since-restoration (TSR), forest cover (F200), open habitat (O200), NS (open, sun coffee plantation), and tree density (TDEN). ………...…….… 74
Appendix 1.
Appendix 2.
Mean (SE) dbh measurements for all tree species identified within 0.04 ha of sampling stations. Sampling stations were classified into one of three Time Since Action (TSR) categories: New (2011-2014), Intermediate (2007-2010), and Old (2003-2006). ………. 81
Appendix 4.
Check list of resident avian species recorded at least once at 65 farms of shade-restored coffee plantations during the breeding seasons of 2015 and 2016 in the central mountains of Puerto Rico. The list was grouped into one of three “Time Since Action” (TSR) categories: New (2011-2014), Intermediate (2007-2010), and Old (2003-2006). ………..……. 88
Appendix 5.
Model selection tables for double-observer abundance models used to estimate abundance of 5 frugivorous, forest-dependent species of resident avian species in shade-restored farms in the central mountainous region of Puerto Rico, 2016. Models are ranked by their respective AICc values. Model covariates were observers (obs), linear trend (trend), time-since-restoration (TRT), sampling occasion (occ), forest cover (F50m, F200m), open habitat (O50m, O200m), tree and shrub density (TDEN, SDEN), and fruit availability index, seasonal (FAI). Estimates of
abundance (X) by time since restoration categories (TSR: I= Intermediate, N= New, and O=Old), from the top model are presented for each species. ……… 89
Appendix 6.
Model selection tables for double-observer abundance models used to estimate abundance of 5 insectivorous, forest-dependent species of resident avian species in shade-restored farms in the central mountainous region of Puerto Rico, 2016. Models are ranked by their respective AICc values. Model covariates were observers (obs), linear trend (trend), time-since-restoration (TRT), sampling occasion (occ), forest cover (F50m, F200m), open habitat (O50m, O200m), tree and shrub density (TDEN, SDEN), and fruit availability index, seasonal (FAI). Estimates of
abundance (X) by time since restoration categories (TSR: I= Intermediate, N= New, and O=Old), from the top model are presented for each species. ……… 94
Appendix 7.
List of all tree species identified at our 65 sampling stations. Stations were classified into one of three “Time Since Action” (TSR) categories: New (2011-2014), Intermediate (2007-2010), and Old (2003-2006). Trees reported had diameter breast height (dbh) greater than 8cm within 0.04 ha of sampling stations. ……… 102
Appendix 8.
represented by a “-“, which indicate occasions in which monitoring of birds wasn’t possible. ……….………...…… 104
Appendix 9.
Summary statistics of vegetation structure variables measured at 65 shade-restored farms in the central mountains of Puerto Rico, 2015-2016. Summarization was grouped by time spanned since the restoration action was implemented. A detailed description of how data were collected is presented in the text. ………...……... 105
LIST OF FIGURES CHAPTER 1
Figure 1. Map of Puerto Rico depicting the study area in the central mountainous region of the island. We highlight location of survey stations across the study area. ……….. 42
Figure 2. Tree and shrub density (top), and percent of open habitat (sun cultivated; bottom) in parcels within shade-restored farms in the central mountains of Puerto Rico.
Time-since-restoration of shade is coded as new (1), intermediate (2), and old (3). ………. 43
Figure 3. Percent forest cover within a radius of 50 and 200 meters from survey stations in parcels within shade-restored farms in the central mountains of Puerto Rico (panel a). Time-since-restoration of shade is coded as new (1), intermediate (2), and old (3). Aerial images of Finca Juan Montalvo (N18° 16.154' W66° 36.682'; 8.38 ha) showing change in forest cover (canopy) from 2004 (restoration) to 2014 (present) within the restored area (blue line). …….. 44
Figure 4. Occupancy (SE) estimates for the Puerto Rican Spindalis (PRSP), Puerto Rican Bullfinch (PUEB), and Scaly-naped Pigeon (SNPI) as a function of time-since-restoration and relative to secondary forest sites in shade-restored farms in the central mountains of Puerto Rico, 2015-2016. Bottom panel depicts abundance estimates (95%CIs) for the same farms as a
function of time-since-restoration. ……….……….……… 45
Figure 5. Relationship between occupancy probability (SE) and forest cover (F200m) for the Puerto Rican Spindalis (PRSP, top panel) and Scaly-naped Pigeon (SNPI, bottom panel) in shade-restored farms in the central mountains of Puerto Rico, 2015-2016. ……….…... 46
Figure 6. Occupancy (SE) estimates for the Yellow-faced Grassquits (YFGQ), Gray Kingbird (GRAK), and Northern Mockingbird (NOMO) as a function of time-since-restoration and
relative to secondary forest sites in shade-restored farms in the central mountains of Puerto Rico, 2015-2016. Bottom panel depicts abundance estimates (95%CIs) for the same farms as a
Figure 7. Occupancy (SE) estimates for the Puerto Rican Flycatcher (PRFL), and Puerto Rican Vireo (PRVI) as a function of time-since-restoration and relative to secondary forest sites in shade-restored farms in the central mountains of Puerto Rico, 2015-2016. Bottom panel depicts abundance estimates (95%CIs) for the same farms as a function of time-since-restoration. .…. 48
Figure 8. Relationship between occupancy probability (SE) and forest cover (F200m) for the Puerto Rican Vireo (PRVI, top panel) and forest cover (F50m) for the Puerto Rican Flycatcher (PRFL, bottom panel) in shade-restored farms in the central mountains of Puerto Rico, 2015-2016. ... 49
Figure 9. Relationship between occupancy probability (SE) and forest cover (F200m) for the Northern Mockingbird (NOMO, top panel) and tree density (TDEN) for the Yellow-faced Grassquit (YFGQ, bottom panel) in shade-restored farms in the central mountains of Puerto Rico, 2015-2016. ………...………….. 50
CHAPTER 2
Figure 1. Map of Puerto Rico depicting the study area in the central mountainous region of the island. We highlight location of survey stations across the study area. ……….. 76
Figure 2. Fixed kernel density estimates for 2 Puerto Rican Bullfinches at the Remanso Farm in the central mountains of Puerto Rico, 2016. Orange dots in and out of the figure are bird
locations from three radioed individuals tracked in this farm. Contour lines are the 95, 75, and 50% density ellipses for PR Bullfinch 309 (yellow), PR Bullfinch 375 (black), and PR Bullfinch 352 (orange). Habitat types are forest cover (dark green; mix of shaded coffee and secondary forest), discernable shaded coffee (dark green/hatched lines), light gray (impervious surfaces), and sun coffee (light orange). Area within blue lines was restored between 2003 and2006 (old category). Purple lines depict property lines of farm. ………...…………. 77
Figure 4. Relationship between extinction probability and forest cover (F200) or tree density forest and shaded coffee cover (Fsh200) for two insectivore species in the central mountains of Puerto Rico. Survey data were collected in 2015-17. ……… 79
Appendix 3.
CONCEPTUAL OVERVIEW
Human activities dominate landscapes globally (Steffen et al. 2011, Caro et al. 2012),
creating altered landscapes (Vitousek et al. 1997), and in many cases, destruction of natural
habitat (Tilman et al. 1994). A consequence of these activities is habitat fragmentation, a process
where habitat patches may become increasingly smaller, isolated and of lower quality. This
process has been at the forefront of discussions by conservationists because the spatial
arrangement and composition of resources in fragmented habitats have a strong influence on the
dynamics and persistence of populations through their effects on fitness parameters (e.g.,
reproduction), habitat quality and permeability. The latter is important because species that avoid
or are unable to cross the intervening land cover or non-habitat areas (i.e., urban) will become
increasingly isolated (Gascon et al. 1999; Fahrig 2003). These processes could lead to
community homonogenization and lower species persistence as patch colonization and extinction
rates are disrupted (Hanski 1998; McKinney and Lockwood 1999; Blair 2001; Fahrig 2003).
Agriculture is a driving force behind the alteration of global natural landscapes (Tilman
et al. 2001, Lambin and Meyfroidt 2011). Responses by individual species to agricultural
production practices are complex, depending on resource specialization, mobility, and life
history strategies (Jeanneret et al. 2003; Drew et al. 2012). Yet, many vertebrate species do
inhabit agricultural landscapes, benefitting from the water, food, or shelter found within
cultivated fields and their immediate borders (e.g., Holland et al. 2012). Thus, many advocate
that rather than viewing agricultural activities and conservation as mutually exclusive endeavors,
a more fruitful path is to elucidate ways in which agricultural practices could contribute to
conservation (Lui et al. 2007, Kareiva and Marvier 2012; Radeloff et al. 2015). A promising
replacements of historic landscapes, such as shaded coffee or cacao plantations (Brash 1987,
Rice and Greenberg 2000; Perfecto and Vandermeer 2015). Cultivation under shade could bridge
the need to provide a livelihood to growers and reduce the risks of extinction. This is illustrated
by the resident avifauna in Puerto Rico in the 20th Century. It is purported that this agricultural activity provided refugia to resident avifauna, providing functionally equivalent forested habitats (i.e., shade layer) at a time of widespread forest deforestation on the island (Brash 1987).
Coffee production under a canopy of shade trees has been widely recognized as an
effective method to protect biodiversity and retain a wide range of ecological services in working
agricultural landscapes (Perfecto et al. 1996; Rappole et al. 2003; Rice 2003; Borkhataria et al.
2012a,b). The conservation value extends to avian species, in part, due to shade layer’s unique
structural features that provide ideal foraging habitat (Brash 1987; Wunderle and Latta 1998;
Moguel and Toledo 1999; Philpott et al. 2008; Bakermans et al. 2012; McDermott et al. 2015).
In recognition of this potential, conservationists around the world have developed shade-coffee
certification programs aimed at promoting the consumption of shade-grown coffee to support the
livelihood of local communities, and conserve habitat for avian species (Mas and Dietsch 2004;
Perfecto et al. 2005; Philpott et al. 2007). Certification programs have been shown to minimize
deforestation rates in coffee agro-ecosystems, ameliorating the loss of habitat features that
sustain high levels of biodiversity (Hardt et al. 2015).
Despite the numerous benefits of shade-coffee plantations, sun coffee (grown without a
canopy of shade trees), has gained popularity in Puerto Rico since the early 1980’s, owing to
incentives provided by the Puerto Rico Department of Agriculture and purported gains in yields
(Agriculture Promotion Administration, 1986). This conversion, however, eradicates structural
functions provided by native forests (Brash 1987; Haggar et al. 2011; Perfecto and Armbracht
2003). Responding to the aforementioned trend, the U.S. Fish and Wildlife Service (USFWS)
and the Natural Resource Conservation Service (NRCS-USDA) have been promoting the
restoration of the shade-layer through their Habitat Enhancement and Best Practices program
since 2003 (Miranda-Castro and Padrón 2005). The program adopts a “land sharing” ecological
restoration strategy (Rey Benayas and Bullock 2012), in which coffee growers who perform
modern-sun coffee practices, receive native species of shade trees which are strategically
arranged to obtain an ideal canopy cover between 30-40%. The implicit hypothesis guiding the
restoration program is that vegetation heterogeneity increases with time since restoration,
providing increasing resources (e.g., food, shelter) for avian species (Tews et al. 2004). After
over a decade since the implementation of the program, both agencies recognize the need to
assess if indeed the program yields expected benefits for resident avifauna, and if possible,
identify ways to improve the program and its relevance for conservation planning (Ruiz-Jaen and
Aide 2005; Wortley et al. 2013).
Measures of success are undeniably instrumental to assess the ecological value of
restoration actions (Wortley et al. 2013). However, the path to evaluating restoration success is
not always clear. Studies recommend the quantification of ecological attributes such as 1)
diversity, 2) vegetation structure, and 3) ecological processes as general standard metrics to
evaluate restoration success (Ruiz-Jaen and Aide 2005). In this work, we implemented a
monitoring scheme aimed at quantifying the response of avian species to the aforementioned
shade-restoration program using 4 demographic responses, namely, occupancy probability,
density of avian species, habitat selection, and local dynamics measured within and between
In Chapter 1, we estimated avian occupancy probability and abundance of resident avian
species as a function of time since restoration in 65 restored farms. We used these metrics
because they can be more explicitly modeled as a function of habitat covariates measured in
farms grouped by time since restoration. Because restoration is aimed at increasing vegetation
complexity, we predicted that the strongest beneficiaries would be forest-dependent frugivores.
Thus, we expected higher occupancy probabilities and abundance in farms that had been restored
early in the program (2003-2006). Conversely, we expected that insectivores/granivores would
not respond positively to such changes, exhibiting higher occupancy probabilities and abundance
in recently restored farms (2011-2014), where open habitat would be more prevalent and suited
for foraging (e.g., ground or sallying/gleaning).
In Chapter 2, we addressed two additional parameters to expand our understanding of the
relationship between shade-restoration and avian responses. We report on the daily probability of
Puerto Rican Bullfinches occurring in restored farms within a season as a means to determine if
birds detected in area were residents or transients. Also within season, we assessed habitat
selection by Puerto Rican Bullfinches in restored farms. Finally, the coffee production region in
Puerto Rico is contained within a mosaic of multiple forest reserves and urbanized areas
(Borkhataria et al. 2012a; Castro-Prieto et al. 2017). Thus, we wanted to increase our
understanding of the relationship between availability of restored habitat and persistence
(1-extinction probability) on such a matrix. We approached this question by estimating inter-annual
farm extinction probabilities of 5 species of frugivores and insectivores to determine. We discuss
the conservation implications of habitat selection and local dynamics with respect to
conservation design aimed at maximizing species persistence at local and landscape scales in
LITERATURE CITED
Agriculture Promotion Administration. 1986. Norms to regulate the program of incentives for the
development of the coffee industry in Puerto Rico and to repeal the Santurce, Puerto Rico:
Department of Agriculture.
Bakermans, M. H., A. D. Rodewald, A. C. Vitz, and C. Rengifo. 2012. Migratory Bird Use of
Shade Coffee: The Role of Structural and Floristic Features. Agroforestry Systems 85 (1): 85–94.
Borkhataria, R.R., J. A. Collazo, M. J. Groom, and A. Jordan-Garcia. 2012a. Shade-Grown
Coffee in Puerto Rico: Opportunities to Preserve Biodiversity While Reinvigorating a
Struggling Agricultural Commodity. Agriculture, Ecosystems and Environment 149: 164– 70.
Borkhataria, R. R., J. A. Collazo, and M. J. Groom. 2012b. Species Abundance and Potential
Biological Control Services in Shade vs. Sun Coffee in Puerto Rico. Agriculture, Ecosystems and Environment 151. Elsevier B.V.: 1–5.
Blair, R.B. 2001. Creating a homogeneous avifauna. Avian Ecology and Conservation in an urbanizing world. Kluwer Academic Publishers. 459-486.
Brash, A. R. 1987. The History of Avian Extinction and Forest Conversion on Puerto Rico.
Biological Conservation 39 (2): 97–111.
Caro, T., J. Darwin, T. Forrester, C. Ledoux-Bloom, and C. Wells. 2012. Conservation in the
Anthropocene. Conservation Biology 26:185–188.
Castro-Prieto, J., S. Martinuzzi, V. C. Radeloff, D. P. Helmers, M. Quiñones, and W. A. Gould.
2017. Declining human population but increasing residential development around protected
Drew, C.A., L. B. Alexander-Vaughn, J. A. Collazo, A. McKerrow, and J. Anderson. 2013.
Developing an Outcome-based Biodiversity Metric in Support of the Field to Market
Project. Technical Bulletin 334, North Carolina Agricultural Research Service, College of
Agriculture and Life Sciences, North Carolina State University. 31pp.
Fahrig, L. 2003. Effects of habitat fragmentation on biodiversity. Annual Review of Ecology, Evolution and Systematics. 34(1): 487-515.
Gascon, C., Lovejoy T.E., Bierregaard R.O., Malcolm J.R., Stouffer P.C., Vasconcelos H.L.,
Laurance W.F., Zimmerman B, Torcher M. and Borges S. 1999. Matrix habitat and species
richness in tropical forest remnants. Biological Conservaiton 91: 223-229.
Haggar, J., M. Barrios, M. Bolaños, M. Merlo, P. Moraga, R. Munguia, A. Ponce 2011. Coffee
Agroecosystem Performance under Full Sun, Shade,conventional and Organic Management
Regimes in Central America. Agroforestry Systems 82 (3): 285–301.
Hanski, I. 1998. Metapopulation dynamics. Nature 396: 41-49.
Hardt, E., E. Borgomeo, R. F. dos Santos, L.F. Pinto, J.P. Metzger, and G. Sparovek. 2015. Does
Certification Improve Biodiversity Conservation in Brazilian Coffee Farms? Forest Ecology and Management 357. Elsevier B.V.: 181–94.
Holland JM, Smith BM, Birkett TC, Southway S (2012) Farmland bird invertebrate food
provision in arable crops. Annals of Applied Ecology 160: 66-75.
Jeanneret P, Schüpbach B, Luka H (2003) Quantifying the impact of landscape and habitat
features on biodiversity in cultivated landscapes. Agriculture, Ecosystems and
Environment 98: 311-320.
Lambin, E. F., and P. Meyfroidt. 2011. Global Land Use Change, Economic Globalization, and
the Looming Land Scarcity. Proceedings of the National Academy of Sciences 108:3465–
3472.
Lui, J., T. Dietz, S. R. Carptenter, C. Folke, M. Alberti, C. L. Redman, S. H. Schneider, E.
Ostrom, A. N. Pell, J. Lubchenco, W. W. Taylor, Z. Ouyang, P. Deadman, T. Kratz, and W.
Provencher. 2007. Coupled Human and Natural Systems. Royal Swedish Academy of
Sciences 36:639–649.
Mas, A. H. and T. Dietsch. 2004. Linking Shade Coffee Certification to Biodiversity
Conservation: Betterflies and Birds in Chiapas, Mexico 14 (3): 642–54.
McDermott, M. E., A. D. Rodewald, and S. N. Matthews. 2015. Managing Tropical Agroforestry
for Conservation of Flocking Migratory Birds. Agroforestry Systems 89 (3): 383–96.
McKinney M.L. and J.L. Lockwood. 1999. Biotic homogenization: A few winners replacing many
losers in the next mass extinction. Trends in Ecology and Evolution 14: 450-453.
Miranda-Castro, L. and S. Padrón. 2005. From the Mountains to the Sea: Restoring Shaded
Coffee Plantations to Protect Tropical Coastal Ecosystems. Proceedings of MTS/IEEE OCEANS, 2005 2005.
Moguel, P., and V. M. Toledo. 1999. Biodiversity Conservation in Tradicional Coffee Systems
of Mexico. Conservation Biology 13 (1): 11–21.
Perfecto, I, R. Rice, and R. Greenberg. 1996. Shade Coffee: A Disappearing Refuge for
Biodiversity. BioScience 46 (8): 598–608.
Perfecto, I., J. Vandermeer, A. Mas, and L. Soto Pinto. 2005. Biodiversity, Yield, and Shade
Perfecto, I., and I. Armbrecht. 2003. The coffee agroecosystem in the Neotropics: Combining
ecological and economic goals. Pp.159–194 in Tropical Agroecosystems (J.H.
Vandenmeer, ed.). CRC Press, USA.
Perfecto, I., and J. Vandermeer. 2015. Coffee Agroecology: A New Approach to Understanding
Agricultural Biodiversity, Ecosystem Services, and Sustainable Development. Routledge,
USA.
Philpott, S. M., W. J. Arendt, I. Armbrecht, P. Bichier, T. V. Diestch, C. Gordon, and
R.Greenberg. 2008. Biodiversity Loss in Latin American Coffee Landscapes: Review of the
Evidence on Ants, Birds, and Trees. Conservation Biology 22 (5): 1093–1105.
Philpott, S. M., P. Bichier, R. Rice, and R. Greenberg. 2007. Field-Testing Ecological and
Economic Benefits of Coffee Certification Programs. Conservation Biology 21 (4): 975–85.
Radeloff, V. C., J. W. Williams, B. L. Bateman, K. D. Burke, S. K. Carter, E. S. Childress, K. J.
Cromwell, C. Gratton, A. O. Hasley, B. M. Kraemer, A. W. Latzka, E. Marin-Spiotta, C. D.
Meine, S. E. Munoz, T. M. Neeson, A. M. Pidgeon, A. R. Rissman, R. J. Rivera, L. M.
Szymanski, and J. Usinowicz. 2015. The Rise of Novelty in Ecosystems. Ecological
Applications 25:2051–2068.
Rappole, J.H., D. I. King, and J. H. Vega Rivera. 2003. Coffee and Conservation. Conservation Biology 17 (1): 334–36.
Rey Benayas, J. M., and J. M. Bullock. 2012. Restoration of Biodiversity and Ecosystem
Services on Agricultural Land. Ecosystems 15 (6): 883–99.
Rice, R. 2003. Coffee Production in a Time of Crisis: Social and Environmental Connections.
SAIS Review 23 (1): 221–45.
diversity. Ambio 29 (3):167-173.
Ruiz-Jaen, M. C., and T. M. Aide. 2005. Restoration Success: How Is It Being Measured?
Restoration Ecology 13 (3): 569–77.
Steffen, W., J. Grinevald, P. Crutzen, and J. McNeill. 2011. The Anthropocene: Conceptual and
Historical Perspectives. Philosophical Transactions: Mathematical, Physical, and
Engineering Sciences 369:842–67.
Tews, J., U. Brose, V. Grimm, K. Tielbörger, M C Wichmann, M Schwager, and F Jeltsch. 2004.
Animal Species Diversity Driven by Habitat Heterogeneity/diversity: The Importance of
Keystone Structures. Journal of Biogeography 31 (1): 79–92.
Tilman, D., R. M. May, C. L. Lehman, and M. A. Nowak. 1994. Habitat Destruction and the
Extinction Debt. Nature 371:65–66.
Tilman, D., J. Fargione, B. Wolff, C. D. Antonio, A. Dobson, R. Howarth, D. Schindler, W. H.
Schlesinger, D. Simberloff, and D. Swackhamer. 2001. Forecasting Agriculturally Driven
Global Environmental Change. Science 292:281–284.
Vitousek, P. M., H. A. Mooney, J. Lubchenco, and J. M. Melillo. 1997. Human Domination of Earth’s Ecosystems. Science 277:494–499.
Wortley, L., J. M. Hero, and M. Howes. 2013. Evaluating Ecological Restoration Success: A
Review of the Literature. Restoration Ecology 21 (5): 537–43.
Wunderle J. M. and S. C Latta. 1998. Avian Resource Use in Dominican Shade Coffee
CHAPTER 1:
OCCUPANCY AND ABUNDANCE OF RESIDENT AVIAN SPECIES IN SHADE-RESTORED COFFEE PLANTATIONS IN PUERTO RICO
ABSTRACT
Shade coffee plantations have high conservation value because they foster avian persistence and
supply numerous ecological services. Cultivation of sun-coffee has been promoted in recent
decades, effectively undermining the role of shaded coffee in conservation. Since 2003, the U.S.
Fish and Wildlife Service (USFWS) and the Natural Resource Conservation Service (NRCS)
have promoted the restoration of shade-layer in sun coffee plantations to retain the avian
conservation qualities of shaded plantations. Here, we quantified occupancy probability and
abundance of members of the resident avian community as a function of time since shade
restoration as measures to gauge the success of the program. We classified farms into three
groups according to year of initial action: New (2011-2014), Intermediate (2007-2010), and Old
(2003-2006). We hypothesized that frugivores, primarily forest specialists, would become more
prevalent in farms restored at the outset of the program as structural heterogeneity increase over
time. Conversely, open habitat-specialists, primarily insectivores, would exhibit the opposite
response. We documented increases in vegetation structure, and showed that most frugivores
exhibited higher occupancy and abundance 6-10 years post-restoration (e.g., Puerto Rican
Bullfinch). Conversely, most open-habitat specialists occurred at higher rates and abundance in
recently restored farms (e.g., Yellow-faced Grassquit), but some exhibited variable levels of
occupancy and abundance regardless of time since restoration. Our study documented that the
primary beneficiaries of the program are, as expected, are forest-dependent species. However,
ecosystem services to farmers (e.g., pest control). We also inform conservation design by
providing a time frame when conservation rewards (e.g., changes in occupancy or abundance)
INTRODUCTION
Shade-coffee agro-ecosystems have been shown to promote avian persistence and
diversity (Komar 2006; Borkhataria et al. 2012a; Philpott et al. 2008; Gleffe et al. 2006;
Wunderle and Latta 1998). These functions are facilitated by the ecosystem’s unique set of
structural features that include multiple strata, canopy cover and tree diversity (Brash 1987;
Wunderle and Latta 1998; Moguel and Toledo 1999). In fact, studies recommend that habitat for
avian wildlife may be improved by managing structural features associated with the shade layer
(Carlo et al. 2004; McDermott et al. 2015). In concert with this belief, certification programs
were developed to promote the shade-layer in coffee plantations (Mas and Dietsch 2004; Philpott
et al. 2007). This conservation-oriented marketing tool is unique in that it accounts for coffee
yields to identify economic thresholds that can also sustain biodiversity (Perfecto et al. 2005).
Certification programs have been shown to reduce deforestation in coffee plantations and
improve habitat regeneration and connectivity. While there is no specific amount of canopy
cover required for certification (Hardt et al. 2015), available information suggests that 35 to 65%
canopy cover are conducive to high coffee yields and high biodiversity (Perfecto et al. 2005).
Shade coffee plantations purportedly played a key role in minimizing avian extinction
rates in Puerto Rico at a time when the intensification of agricultural practices, culminating
around the 1930s, led to extensive deforestation of the island (Brash 1987; Lugo and Helmer
2004). It is believed that shade-coffee plantations ameliorated extinction rates because
plantations retain many ecological services and functions provided by native forests (Brash 1987;
Perfecto and Armbrecht 2003). Ecological services and functions include the production of food,
harboring biodiversity, pest control (bio-controls), crop pollination, and recreational
markedly since the early 1980s (Borkhataria et al. 2012a). Shade coffee cultivation is
increasingly replaced by sun-coffee cultivation as a means to obtain higher coffee yields per
hectare (Rappole et al. 2003; Haggar et al. 2011). Sun-coffee cultivation is effectively devoid of
a shade layer, leading to lower biodiversity and reduction of ecological services (Borkhataria et
al. 2012b; Perfecto and Vandermeer 2015). In some geographic contexts, the promotion of sun
coffee production can exacerbate habitat fragmentation, disrupting functional ecosystem stability
(Murrieta-Galindo et al. 2013).
Recognizing the importance of the ecological services provided by shade coffee
plantations in Puerto Rico, including wildlife conservation, the U.S. Fish and Wildlife Service
(USFWS) and Natural Resources Conservation Service (NRCS) developed and implemented a
shade-layer restoration program in the early 2000s (Miranda-Castro and Padrón 2005). The
program adopts a “land sharing” ecological restoration strategy (Rey Benayas and Bullock
2012). Under this scheme, agencies provide native tree species to willing coffee growers who
perform modern-sun coffee practices at their farms. Tree species are Inga vera, Inga laurina, Andira inermes, and Cordia alliodora. The former three species have nitrogen fixing properties, but also provide potential sources of food for birds (e.g., fruits and flowers). The latter species
has large surface roots that help prevent soil erosion, but is also valued as a source of timber
(Beer et al. 1998). These species exhibit rapid growth (up to 0.52 cm/yr; Weaver and Birdsey
1991) and are planted following a pre-defined spatial arrangement (12 x 12 m lattice) that aims
for a canopy cover of 30-40% (Miranda-Castro and Padrón 2005). Thus, the aim of the program
is not to restore secondary forests, but to provide intermediate levels of shade cover that sustains
Ecological restoration of agro-ecosystems has been positively correlated to biodiversity
and retention of ecosystem services (Barral et al. 2015). Yet, there is poor documentation on how
the system evolves over time both in terms of vegetation complexity and ecological responses of
taxonomic groups of interest. A better understanding of the dynamic nature of restoration
processes, and in particular, how long it takes to detect specific ecological responses would be of
value to shade restoration and certification programs (Ormerod 2007; Ruiz-Jaen and Aide 2005).
Such understanding allows decision makers to frame restoration programs more explicitly in
terms of objectives and alternative actions, and laying a foundation to assess trade-offs among
competing alternatives and setting forth an adaptive management scheme if desired (Nichols and
Williams 2006).
The USFWS and NRCS shade-restoration program was initiated in 2003, and as such, the
program provided an opportunity to evaluate changes in vegetation structure and avian responses
in farms since its inception. Accordingly, we created three, equally spaced temporal categories,
grouping farms restored in 2003-2006 (old), in 2007-2010 (intermediate), and in 2011-2014
(new). Traditionally, the benefits of ecological restorations are measured by quantifying species
diversity, vegetation structure, and ecological processes (Ruiz-Jaen and Aide 2005). In this
study, we estimated avian occupancy probability and abundance in 65 restored farms during the
spring of 2015 and 2016. We used these metrics because they can be more explicitly modeled as
a function of habitat covariates measured in farms grouped by time since restoration (TSR). We
also estimated occupancy probability at 40 secondary forest locations that served as reference
sites to aid with the interpretation of results (Wade et al. 2008). We did not estimate species
richness (or diversity) because the metric is uninformative in most Puerto Rican landscapes
island species to adapt to natural and novel habitats make it nearly impossible to discern strong
influences of habitat type on richness (Lugo et al. 2012; Irizarry et al. 2016).
The implicit hypothesis guiding the restoration program in Puerto Rico is that vegetation
heterogeneity positively influences avian species diversity and abundance patterns, particularly
in forested habitats, where vertical partitioning of resources and nesting sites facilitates higher
diversity (Tews et al. 2004). The relevance of this hypothesis to Puerto Rican avifauna is
justified because resident species evolved in forested landscapes (Lugo et al. 2012). Under this
framework, we created two focal groups based on foraging guilds and habitat preferences. One
group was made up of frugivores, forest-dependent species represented by the Antillean
Euphonia (Euphonia musica), Puerto Rican Bullfinch (Loxigilla portoricensis), Puerto Rican Spindalis (Spindalis portoricensis), Scaly-naped Pigeon (Columba squamosa), and the Puerto Rican Tanager (Nesospingus speculiferus). The other group was made up of
insectivores/granivores represented by the Puerto Rican Flycatcher (Myiarchus antillarum), Loggerhead Kingbird (Tyrannus caudifasciatus), Puerto Rican Pewee (Contopus latirostris), Puerto Rican Vireo (Vireo latimeri), and Yellow-faced Grassquit (Tiaris olivaceus). We also included the Gray Kingbird (Tyrannus dominicensis) and Northern Mockingbird (Mimus polyglottos), although primarily insectivores, studies have shown that they play key roles in forest regeneration (Carlo and Morales 2016).
We predicted that frugivores would benefit the most from the restoration program as
farms would exhibit the highest degree of vegetative complexity and resource availability, more
closely resembling secondary forest environments. Accordingly, we predicted higher occupancy
and abundance in farms that had been restored early in the program (2003-2006). Conversely,
concurrent with loss of open habitats suited for foraging (e.g., ground or sallying/gleaning). We
discuss the conservation implications of results with respect to ecological services, but also with
respect to framing landscape conservation strategies in Puerto Rico, and elsewhere in the tropics,
where coffee is cultivated.
METHODS
STUDY AREA
Our study took place in the west-central region of Puerto Rico (Figure 1). The landscape
consists of a mosaic of coffee production lands (sun and shade), low-density urban areas,
shrub-lands, and secondary forests. In addition, this area contains 5 of Puerto Rico’s state forest
reserves: 1) Bosque Estatal de Maricao, 2) Bosque Estatal de Susúa, 3) Bosque Estatal de
Guilarte, 4) Bosque Del Pueblo, and 5) Bosque Estatal Toro Negro. We monitored 65 restored
farms located across 11 municipalities with the eastern most being Villalba (N18° 08.953' W66°
30.780') and the western most being Mayagüez (N18° 09.380' W66° 53.734'). Municipalities
within these bounds are Adjuntas, Ciales, Juana Diaz, Las Marias, Maricao, Ponce, Utuado, and
Yauco. Farm size averaged 25 hectares (95%CIs = 18 - 32 ha). The average size of restored
parcels within farms was 6.46 ha (95%CIs = 4.9 - 8.0 ha). On average, the proportion of the farm
that was restored was 37% (95%CIs = 30 – 44%). Generally, coffee plantations consisted of
unevenly spaced coffee shrubs (mostly C. arabica but some C. canephora), interspersed by other crops such as plantains/bananas, citrus, and tubers, under a multi-strata layer of shade trees
species either provided by the restoration program (mentioned above), as well as other
flowering/fruiting tree species. Appendix 1 provides a detailed list of all tree species that were
identified at our sites. Farms classified as “New” were characterized mostly by shade trees of
had taller shade trees and were more structurally complex. Nearly all farms were in close
proximity to secondary forests along portions of their boundaries.
AVIAN SURVEYS
Survey stations were established approximately in the center of each of restored parcels
within farms, avoiding sampling edges of the parcel. In 2015, we established 46 stations, with 13
in old, 11 in intermediate, and 22 in new farms based on time since restoration. In 2016, we
increased the number of farms to 65, with 20 farms classified as old, 23 as intermediate, and 22
as new. Two observers recorded all bird species, detected visually or by sound, within 50 meters
of the center of the station for 10 minutes (Hutto and Pletschet 1986; Alldredge et al. 2007). Four
(4) surveys were conducted between March and June each year. This period encompasses the
breeding season of avian resident species in Puerto Rico (Gleffe et al. 2006), thus, minimizing
changes in detectability throughout the season (Thompson 2002). All surveys were conducted
between 0600 and 1000 hrs. In 2016, data were collected following a double observer approach
(Nichols et al. 2000). This approach allowed the estimation of observer-specific detection
probabilities and focal species’ abundance. Observers were designated as primary and secondary,
recording detections independently for each species. After each survey, observers consulted
briefly with each other to determine the number of individuals detected by each observer and
those that were detected by both observers. Surveys were conducted under favorable weather
conditions (i.e., no rain or strong winds).
VEGETATION SURVEYS
We measured tree density (trees/0.04 ha) and shrub density (shrub/0.008 ha) at each
survey station following procedures described by Carlo et.al. (2004). Shrubs were designated as
plants were classified as trees when DBH was >8 cm. We used ArcMap 10.4.1 (ESRI 2011) to
estimate the percent vegetation cover within 50 and 200 meter radii of each survey station using
images from Google earth V 7.1.8.3036 (32-bit; September 13, 2016), Puerto Rico DigitalGlobe,
www.digitalglobe.com; Google Earth, www.google.com/earth;CNES, cnes.fr/en). Percent cover
within 50 meter of the station characterized the surveyed area, whereas the area within 200 meter
represented the area used to evaluate habitat selection by Puerto Rican Bullfinches, or where we
recorded 90% of the observations of radioed individuals (Chapter 2). Two-hundred meters is also
the distance interval between neighboring sampling stations believed to maximize surveying
point independence (Alldredge et al. 2007). Vegetation cover classes included 1) secondary
forest, 2) shaded coffee, 3) open (sun) coffee, 4) semi shaded-coffee (i.e., mix of coffee bushes,
crops and shade trees), and 5) shrubs (e.g., bushes no coffee), and 6) “other” (e.g., impervious
surfaces, bare ground, housing). We also conducted a qualitative assessment of the progression
of vegetation cover in treated parcels within 8 “old” farms. Parcels were georeferenced, creating
polygons whose vegetation cover would be inspected using aerial imagery from 2004, 2007,
2010 and 2014. The predicted progression would run from discernable open habitat (sun
plantation) in 2004 to exhibiting greater amount of canopy cover in subsequent years. We also
recorded all tree species with fruit and flowers within 50 m of the survey station during each
sampling occasion. Data were categorized into four (4) groups: 0 = none, 1 = 1-3 species, 2 = 4-6
species, and 3 = 7 or more species known to be consumed by bird species in Puerto Rico (Carlo
ANALYSES
Survey data for every focal species were converted into a binary encounter history
(presence, non-presence). Data were used to estimate occupancy probability using single-season,
single-species models with program Presence 11.5 (Hines 2006). We created competing models
examining the effects of time since restoration (TSR), year (YR; 2015 and 2016), and 9 habitat
covariates on occupancy (Ψ) and detection probability (p). Habitat covariates were average
(seasonal) fruit availability (FAI), sampling occasion fruit availability (FAIs), percent forested
cover at 50 m (F50) and 200 m (F200), percent open (sun cultivated) habitat at 50 m (O50) and
200 m (O200), tree density (TDEN), and shrub density (SDEN). Time since restoration was
comprised of three categories (N=new, I=intermediate, and O=old). We also used NS (new sun)
to model only recently restored farms with strictly open, sun cultivated habitat (12.71 ± 2.87%
F200) versus all other TSR parcels in the program 42.43 ± 3.04% F200). We expected that FAI,
F50, F200, TDEN would have a positive influence on occupancy and abundance for frugivores.
We also expected that occupancy and abundance would be higher as a function of TSR and NU.
For insectivores/granivores, we expected positive responses for O50, O200, and SDEN, whereas
a negative response as a function of TSR and NU (i.e., stronger at recently or open habitat
farms). Detection would be negatively mediated by TSR, F50, TDEN and SDEN, and increase
with FAI for frugivores.
We modeled the detection process first, evaluating support in the data for the influence of
TSR, YR, sampling occasion (T), YR*T, FAIs, TDEN, and SDEN. The model with the highest
support (lowest AIC) was then used to model occupancy probability. Models included TSR, NS,
and habitat covariates. Akaike’s Information Criterion (AIC) was used to evaluate the support in
the data for models in the candidate sets and the strength of each covariates effect on occupancy
support in the data. The relationship between the probability of occupancy and the effect of
covariates (i.e., Beta coefficient) was considered to have strong support if the 95% confidence
interval (CI) did not overlap zero; otherwise, we considered it a weak relationship. Occupancy
(SE) estimates are reported.
Survey data collected in 2016 were also classified by primary and secondary observers to
estimate abundance. We used an R code to analyze 2016 survey data using a “double-observer”
approach (Nichols et.al. 2000; Hines 2000). Data were modeled as a function of time
since-restoration (TSR), observers, forest cover (50 and 200 m), open habitat cover (50 and 200 m),
TDEN, SDEN, and FAI. We summarized abundance results on the basis of time since restoration
based on the best supported model using AIC. Parameter estimates (95%CIs) for abundance are
reported.
Careful consideration of model assumptions was important for the interpretation of
single-season, single-species occupancy model results. This approach assumes that: 1) species’
occupancy at a site remains constant within breeding season, but open to changes between years,
2) all surveys were independent, 3) species were identified correctly, and 4) there is no
unmodelled heterogeneity (MacKenzie et.al. 2006). Assumptions for the double-observer
approach include: 1) detection probability for an observer remains the same whether that
observer is serving as the primary or the secondary observer, 2) detection probabilities for both
observers are different, and 3) observers correctly identified and enumerated detected birds
(Nichols et al. 2000). We consider that all assumptions for both methods were met, given that
sampling took place during the known breeding season of focal species, surveys were conducted
every 2 weeks at stations spatially segregated (at least 500 apart), and observers were trained to
RESULTS
VEGETATION STRUCTURE
We recorded 18 (new), 25 (intermediate) and 24 (old) tree species in each of the TSR
categories, including the 4 species used in the shade restoration program (Appendix 1). Average
densities of trees and shrubs were similar among TSR (P<0.05), although tree densities between
recently restored and oldest farms exhibited greater differences (Figure 2). Average (SE) DBH
for all species of trees was 15.61 ± 4.27 (new), 12.49± 1.45 (intermediate), and 19.57 ± 2.42
(old; Appendix 2). Diameter at breast height differences were sharper for two species of trees
when inspected by the species of trees used in the restoration program (Table 1). Average (SE)
FAI score was 1.87 ± 0.16 (new), 1.94 ± 0.10 (intermediate), and 2.00 ± 0.16 (old).
The percent of area classified as open habitat (sun cultivated) decreased markedly at 50
and 200 m over time-since-restoration categories (Figure 2, bottom panel); Differences for Open
50 were significant (1-way ANOVA; P<0.05). Conversely, average percent forest cover per farm
increased over the same categories, but not significantly among TSR categories (1-way
ANOVA; P>0.05; Figure 3). Aerial images validated the progression of vegetation cover when
recently restored polygons exhibit little to no canopy cover (Figure 3, bottom panel; Appendix 3
for other farms). Polygons increasingly gain canopy cover over the remaining images. It was
interesting to note some “clearing” of canopy cover in the 2014 image, a commonplace practice
among growers to avoid full canopy cover (i.e., prefer intermediate levels).
AVIAN RESPONSES
We recorded 41 species during the study (Appendix 4). All but 5 species were recorded
in all three time-since-restoration categories. Occupancy probability of frugivores conformed to
was similar to levels recorded in forested sites. This is illustrated by the Puerto Rican Spindalis
(PRSP), Puerto Rican Bullfinch (PUEB), and Scaly-naped Pigeon (SNPI; Figure 4). As expected,
patterns of abundance also followed a similar pattern (Figure 4, bottom panel; Appendix 5). The
exception to these patterns was exhibited by the Antillean Euphonia whose occupancy
probability was high regardless of time since restoration (recently restored: 0.87 0.11, old: 0.92
0.04) as compared to forested sites (0.77 0.07).
Variation in occupancy probabilities for Puerto Rican Spindalis (PRSP) was best
explained by a model that featured forested habitat (F200), and detection by sampling occasion
and time-since-restoration (AIC= 0.37; Table 2, Figure 5). The influence of the forest cover
(F200) was positive and strong (Beta = 0.60 0.30). Variation in occupancy probability for the
Scaly-naped Pigeon (SNPI) was best explained by a model that featured forest cover (F200), and
detection by time-since-restoration (AIC = 0.88, Figure 5, bottom panel). The influence of forest
cover was strong and positive (Beta = 0.99 0.38). Variation in occupancy of the Puerto Rican
Bullfinch was best explained by a contrast between open (sun cultivation, low forest cover)
versus forest cover from all other farms (NS), and detection by FAI (AIC = 0.60, Table 2).
Occupancy probability was 0.57 ± 0.11 (NS) as compared to 0.93 ± 0.03 in the rest of the farms.
A competing model featured forest cover (F200; AIC = 0.27). Although the influence of forest
cover was positive, it was not strong (Beta = 0.06 0.04). Variation for the Puerto Rican
Tanager was best explained by a model that featured fruit availability (FAI) and forest cover
within 50m (F50) of survey stations, and detection by tree density (TDEN; AIC = 0.38; Table 2).
The influence of FAI was strong and positive (Beta = 2.22 1.17). Variation in occupancy
probability within restored farms for the Antillean Euphonia was spread over 7 competing
Most insectivores/granivores exhibited a decrease in occupancy probability with time
since restoration as predicted. Strong responses were exhibited by the Yellow-faced Grassquit,
Gray Kingbird and Northern Mockingbird (Figure 6). Abundance followed the same patterns
(Figure 6, bottom panel; Appendix 6). Some insectivores with stronger affinities to forested
habitats (e.g., Puerto Rican Vireo) responded positively to increasing vegetation cover, but not so
in the case of the Puerto Rican Flycatcher (Figure 7). In the case of Gray Kingbirds occupancy
between farms and forested sites was similar. Species like the Loggerhead Kingbird and Lesser
Antillean Pewee exhibited a weak response to changes in vegetation structure and cover (i.e.,
model uncertainty). Estimates from the top model for the Loggerhead Kingbird were 0.94 0.05
(farms) as compared to 0.73 0.31 (forested sites). Likewise, estimates for the Lesser Antillean
Pewees were 0.27 0.16 (recently restored) as compared to 0.73 0.31 (both intermediate/old
farms and forested sites).
Variation in occupancy for the Puerto Rican Vireo was best explained by a model that
featured forest cover (F200), and detection by tree density (TDEN; AIC = 0.81; Table 3). The
influence of forest cover (F200) was positive and strong (Beta = 0.03 0.01, Figure 8). Variation
for the Puerto Rican Flycatcher was best explained by a model that featured forest cover (F50),
and detection by sampling occasion and year (AIC = 0.34). The influence of forest cover was
negative but marginal (Beta = 0.04 0.02; Figure 8, bottom panel). A competing model for this
species did not feature habitat covariates (AIC = 0.16). Variation was spread over multiple
models for the Lesser Antillean Pewee and the Loggerhead Kingbird (Table 3).
Occupancy and abundance estimates of Yellow-faced Grassquits, Gray Kingbirds and
Northern Mockingbirds were higher in recently restored farms. Variation in Northern
detection by year (AIC = 0.99, Table 3). The influence of forest cover (F200) was negative and
strong (Beta = -1.48 0.36, Figure 9).Variation for Yellow-faced Grassquits was best explained
by a model that featured tree density (TDEN), and detection by sampling occasion and shrub
density (AIC = 0.30). The influence of tree density was negative, nearly overlapping 0 (Beta =
0.30 0.15; Figure 9, bottom panel). Variability in occupancy data for Gray Kingbird was
mostly explained by a model that featured fruit availability (FAI) and tree density (TDEN), and
detection by seasonal fruit availability (AIC = 0.30, Table 3). The influence of these covariates
was negative, but not strong (FAI Beta = -2.10 1.47; TDEN Beta = -0.61 0.34).
DISCUSSION
As expected, we documented structural vegetation changes in coffee plantations over
time-since-restoration categories as a result of the restoration program. Notable patterns included
increasing percent forest cover (shaded coffee and secondary forest) and food availability,
features that go along with increasing trends in tree density and DBH. The strongest evidence
supporting a progressive change in habitat structure (i.e., forest cover), although qualitative,
came from assessing selected old farms using aerial photography. Other studies have also
documented increases in structural complexity as a result of shade-management efforts (Hardt et
al. 2015). Our study expands this body of work because we sampled a suite of farms restored at
different times over a 13 year period. Findings suggested that shade restoration efforts reached or
exceeded the program’s target canopy cover of 30-40% at ≥ 6 years post-restoration, or the
intermediate stage in our study design. During and after this intermediate stage we could most
readily detect changes in avian species’ occupancy and density estimates.
Forest (canopy) cover and food availability could be viewed as “keystone structures”
favor the presence of forest-specialists in Puerto Rico (Lugo et al. 2012). Thus, it was not
surprising that occupancy and abundance patterns for most frugivorous species met our
prediction of responding positively to habitat change. Likewise, several insectivores/granivores
exhibited a strong, but opposite response (e.g., Yellow-faced Grassquit). However, other species
of both focal groups exhibited similar occupancy and abundance similar across farms restored at
different times (e.g., Loggerhead Kingbird, Lesser Antillean Pewee, Antillean Euphonia).
Species like the Puerto Rican Vireo, an insectivore with strong forest affinities, was most
abundant in farms with higher forest cover. The mix of species responses likely accounts for the
similarity in avian community composition irrespective of time-since-restoration. Similarities
may have been mediated by the intrinsic ability of island species to exploit altered or novel
habitats (Acevedo and Restrepo 2008; Lugo et al. 2012). This plasticity is exemplified by species
like the Antillean Euphonia, a forest-dwelling frugivore, that occurred at high levels in recently
restored farms (0.92 0.04).
Measuring ecosystem services was beyond the scope of this work; however, our findings
provide valuable insights on the types of services that a restoration program might help to retain.
Carlo et al. (2003) highlighted the importance of resident frugivores in seed dispersal in forested
landscapes in Puerto Rico. These were most prevalent in intermediate to old farms. Borkhataria
et al (2006) highlighted the benefits of insectivores in controlling coffee pests (e.g., coffee bean
borer), a finding in accord with other studies (Karp et al. 2013; Vandermeer et al. 2012; Wilby
and Thomas 2002; Borkhataria et al. 2012b; Perfecto et al. 2004). While prevalent in recently
restored farms, insectivores were also present in all farms regardless of time since restoration.
Thus, pest control services are not lost. Species like Northern Mockingbirds and Gray Kingbirds,
reforestation through their seed-dispersal abilities (Carlo and Morales 2016). This ecological
service is valuable in many conservation contexts, including restoring cover in abandoned farms.
Services also extend to recreational activities (e.g., hunting), in this case, provided by the
Scaly-naped Pigeon in farms exhibiting highest amount of forest cover (D. Ocasio, Puerto Rico
Department of Natural and Environmental Resources, pers. communication). We note that the
similarity in trajectory between occupancy and abundance estimates raises the possibility of only
estimating one metric in future studies. The decision, of course, will be predicated by the
objectives. For example, to assess ecological services, abundance should be the preferred metric.
Ecosystem services (e.g., bio-control, seed dispersal) could be estimated through knowledge of
the abundance of focal species, as estimated in this study, combined with estimates of removal or
predation rates of a target resource (Carlo et al. 2004, Carlo 2005). Clearly, efforts to address
these assessments at the community level should group species by guilds and habitat affinities as
suggested by Kremen and Ostfeld (2005) and this study.
Shaded coffee plantations purportedly played a role in minimizing extinction rates in
Puerto Rico (Brash 1987). This hypothesis is predicated on the plantations’ ability to function as
forested habitats (Borkhataria et al. 2012a; Perfecto and Vandermeer 2015), a hypothesis that is
gaining greater support. Studies have shown shaded plantations provide foraging resources to
many resident species (Carlo 2005), and suitable habitat for successful reproduction, a fitness
parameter (Gleffe et al. 2006). Our study offers additional support for the functional equivalency
hypothesis as many avian species exhibited similar or higher occupancy rates in farms as
compared to forested sites. Moreover, we documented habitat selectivity of restored habitat (i.e.,
shaded coffee), and lower inter-annual local extinction probability as forest cover increases in
reasonable foundation to formulate avian conservation strategies using the shade restoration
program as an integral component to enhance species persistence.
Admittedly, other factors are considered during conservation planning processes,
including accounting for projected costs and accretion of ecological benefits. We contribute to
this process by suggesting that changes in occupancy and abundance are most likely detectable
≥6 years post-restoration. We suggest that, given the rapid growth rates of trees in Puerto Rico
(Weaver and Birdsey 1991), detectable ecological changes in restored plantations could be
accelerated if the DBH of trees delivered to farmers is slightly greater (i.e., >3 cm). Certainly,
our findings could be used to guide the formulation of local and landscape level conservation
strategies across intensively cultivated coffee landscapes. Mounting evidence suggests that
shade-restored farms can function as a secondary forest, providing compelling support for the
use of shade restoration actions in conservation strategies, while supporting the livelihood of
local communities in Puerto Rico or wherever coffee is cultivated in the tropics (Perfecto and
Vandermeer 2015).
LITERATURE CITED
Acevedo, M.A. and C. Restrepo. 2008. Land-cover and land-use changes and its contribution to
the large-scale organization of Puerto Rico’s bird assemblages. Diversity and
Distributions, 14, 114-122.
Alldredge, M. W., K. H. Pollock, T. R. Simons, J. A. Collazo and S. A. Shriner. 2007. Time of
detection method for estimating abundance from point count surveys. Auk 124:653-664.
Barral, M. P., J. M. Rey-Benayas, P. Meli, and N. Maceira. 2015. Quantifying the Impacts of
Ecological Restoration on Biodiversity and Ecosystem Services in Agroecosystems: A