Abstract
RAMACHANDRAN, LAKSHMI. Automated Assessment of Reviews. (Under the direction of Dr. Edward F. Gehringer.)
Reviews are text-based feedback provided by a reviewer to the author of a submission. Reviews are used not only in education to assess student work, but also in e-commerce applications, to assess the quality of products on sites like Amazon, e-bay etc. Since reviews play a crucial role in providing feed-back to people who make assessment decisions (e.g. deciding a student’s grade, choosing to purchase a product) it is important to ensure that reviews are of a good quality. In our work we focus on the study of academic reviews.
A review is considered to be of a good quality if it can help authors identify mistakes in their work and help them learn possible ways of fixing them. Reviews can be evaluated bymetareviewing. Metareviewing is the process ofreviewingreviews. An automated metareviewing process provides quick and reliable feedback to reviewers on their assessment of authors’ submissions. Timely feedback on reviews may help reviewers correct their assessments and provide more useful and effective feedback to authors.
Our work investigates the use of metrics such asrelevanceof a review to the submission, content typesof a review, a review’scoverageof a submission,tone,quantityandplagiarismto determine the quality of a review. We use natural language processing and machine learning techniques to calculate these metrics.
Relevance helps identify to what extent a review’s content pertains to that of the submission. Rele-vance metric helps distinguish generic or vague reviews from the useful ones. ReleRele-vance of a review to a submission can be determined by identifying semantic and syntactic similarities between them. Our work introduces the use of a word-order graph representation, where vertices, edges and double edges (two contiguous edges) help capture sentence-structure information. Our matching technique exploits contextual similarities to determine relevance across texts. We use a WordNet-based relations metric to identify relatedness. During graph matching single and contiguous edges are compared in same and different orders to identify possible paraphrases involving word order shuffling.
Reviews must be thorough in discussing a submission’s content. At times a review may be based on just one section in a document, say the Introduction. Review coverage is the extent to which a review covers the “important topics” in a document. We study the coverage of a submission by a review using an agglomerative clustering technique to group the submission’s sentences into topic clusters. Topic sentences from these clusters are used to calculate review coverage in terms of the degree of overlap between a review and the submission’s topic sentences.
Review tone helps identify whether a reviewer has used positive or negative words in the review, or has provided an objective assessment of the author’s work. While a positive or an objective assessment may be well received by the author, the use of harsh or offensive words or phrases may disincline the author from using the feedback to fix their work. A review’s tone is determined in terms of its semantic orientation, i.e., the presence or absence of positively or negatively oriented words. Review quantity is the number of unique tokens a review contains. The purpose of this metric is to encourage reviewers to write more feedback, since feedback with specific examples and additional explanation may be more useful to the author.
Plagiarism is an important metric because reviewers who are evaluated on the quality of their reviews may tend to game the automated system to get higher ratings. We look for plagiarism by comparing a review’s text with text from the submission and with text from the Internet to make sure that the reviewer has not copy-pasted text to make the review seem relevant.
© Copyright 2013 by Lakshmi Ramachandran
Automated Assessment of Reviews
by
Lakshmi Ramachandran
A dissertation submitted to the Graduate Faculty of North Carolina State University
in partial fulfillment of the requirements for the Degree of
Doctor of Philosophy
Computer Science
Raleigh, North Carolina
2013
APPROVED BY:
Dr. James Lester Dr. Kristy Boyer
Dr. Robin Dodsworth Dr. Edward F. Gehringer
Acknowledgments
Table of Contents
List of Tables . . . vi
List of Figures . . . viii
Chapter 1 Automating Review Assessment . . . 1
1.1 Problem . . . 2
1.2 Background . . . 3
1.3 Approach Overview . . . 4
1.3.1 Review relevance . . . 4
1.3.2 Review content . . . 4
1.3.3 Review tone . . . 5
1.3.4 Review coverage . . . 7
1.3.5 Review quantity . . . 7
1.3.6 Plagiarism . . . 7
1.4 The Expertiza Project . . . 8
1.5 Roadmap . . . 8
Chapter 2 Text Representation and Semantic Relatedness . . . 10
2.1 Graph Representation . . . 10
2.1.1 Related work . . . 11
2.1.2 Word-order graph generation . . . 12
2.2 Semantic Relatedness . . . 14
2.2.1 Existing models . . . 15
2.2.2 WordNet relations-based semantic metric . . . 18
2.2.3 Experiments . . . 19
2.3 Contributions . . . 21
2.4 Conclusion . . . 21
Chapter 3 Review Relevance . . . 22
3.1 Related Work . . . 24
3.2 Lexico-Semantic Graph-based Matching . . . 25
3.2.1 Phrase or token matching . . . 26
3.2.2 Context matching . . . 26
3.2.3 Sentence structure matching . . . 28
3.3 Experiment 1: Performance of Our Relevance Identification Approach . . . 29
3.3.1 Comparison with a text overlap-based approach . . . 30
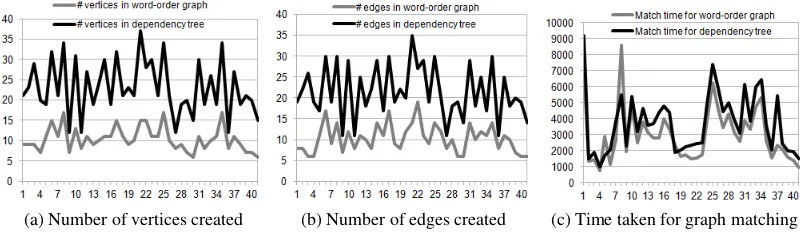
3.4 Experiment 2: Comparison of Word Order Graphs and Dependency Trees . . . 31
3.5 Experiment 3: Comparison of Different Semantic Relatedness Metrics . . . 32
3.5.1 Academic reviews dataset . . . 33
3.5.2 Product reviews from Amazon . . . 33
3.6 Experiment 4: Generalizability of Relevance Identification Problem and Approach . . . 34
3.7 Feedback to Reviewers—Relevance . . . 35
3.9 Conclusion . . . 37
Chapter 4 Review Content . . . 38
4.1 Related Work . . . 40
4.2 Graph Generation and Review State . . . 40
4.3 Identification of Semantic Patterns . . . 43
4.4 Experiments . . . 45
4.4.1 Review content type identification . . . 45
4.4.2 Goodness of semantic patterns . . . 48
4.5 Feedback to Reviewers—Content Type . . . 50
4.6 Contributions . . . 50
4.7 Conclusion . . . 51
Chapter 5 Review Coverage . . . 52
5.1 Related Work . . . 53
5.2 Cluster-based Topic Sentences Identification and Coverage Calculation . . . 54
5.2.1 Calculating semantic relatedness between sentences . . . 55
5.2.2 Grouping sentences into clusters . . . 55
5.2.3 Identifying topic sentences . . . 58
5.2.4 Measuring a review’s coverage . . . 59
5.3 Experiments . . . 61
5.3.1 Identification of Review coverage . . . 61
5.3.2 Evaluation of generated topic representative sentences . . . 64
5.4 Contributions . . . 65
5.5 Conclusion . . . 66
Chapter 6 A User Study on the Automated Assessment of Reviews . . . 67
6.1 The Study . . . 68
6.1.1 Participants . . . 69
6.1.2 Data collection . . . 69
6.2 User Experience Questionnaire . . . 70
6.2.1 Participant background . . . 70
6.2.2 Importance of reviews and metareviews . . . 70
6.2.3 Importance of metareview metrics . . . 71
6.2.4 Usefulness of system’s metareview output . . . 71
6.2.5 Other metrics . . . 72
6.3 Analysis of Data . . . 72
6.3.1 Importance of reviews and metareviews . . . 72
6.3.2 Importance of the review quality metrics . . . 73
6.3.3 Usefulness of system output . . . 74
6.3.4 Other metrics . . . 75
6.3.5 Usefulness of the overall automated assessment feature . . . 76
6.4 Threats to Validity . . . 76
6.5 Contributions . . . 77
Chapter 7 Assessment of Project Reviews . . . 78
7.1 Peer Reviews . . . 79
7.2 Project Review Metrics . . . 80
7.3 Approach to Calculate Project Review Metrics . . . 81
7.3.1 Determining metareview scores . . . 82
7.4 Evaluation . . . 82
7.4.1 Data and method . . . 82
7.4.2 Results and analysis . . . 83
7.5 Contribution . . . 83
7.6 Conclusion . . . 84
Chapter 8 Summary and Future Work . . . 85
8.1 Future Directions . . . 85
List of Tables
Table 1.1 Some examples of reviews. . . 2
Table 2.1 Evaluating the relative ordering of the WordNet match types with different sets of weight values assigned to each relation. . . 20 Table 2.2 Comparing WordNet-based semantic relatedness measures. This table contains
correlations of each of the measures’ values with human relatedness ratings on the WS353 and RG65 datasets. . . 21
Table 3.1 Comparing accuracy andf-measure values of identifying relevance produced by our word order graph and a dependency-tree representation. . . 30 Table 3.2 Using different semantic relatedness measures to determine relevance of reviews,
with data from Expertiza. . . 33 Table 3.3 Using different semantic relatedness measures to determine relevance of product
reviews from the Amazon dataset. . . 34 Table 3.4 Accuracy of identifying entailment for some tasks of the RTE data set.PP:
para-phrase recognition, CD: comparable documents, RC: reading comprehension, IR: information retrievalandQA: question-answer . . . 35 Table 3.5 Summary of findings—Relevance . . . 37
Table 4.1 Some examples of reviews belonging to the different review content classes. . . 39 Table 4.2 Sample edge patterns from each of the content classes. . . 44 Table 4.3 Average recall, precision andf-measure for each of the different classifiers. . . 47 Table 4.4 Comparing match produced by our patterns and by Opinosis with human-provided
topic representative sentences. . . 48 Table 4.5 Sample edge patterns from documents in the Opinosis dataset. . . 50 Table 4.6 Summary of findings—Content . . . 51
Table 5.1 Identifying the correlation between system-generated and human-provided cov-erage values on review data from Expertiza. . . 63 Table 5.2 Comparing ROUGE-1, ROUGE-2 and ROUGE-SU4 results from our system
with those from the Opinosis paper. . . 65 Table 5.3 Summary of findings—Coverage . . . 66
Table 6.1 Detailed set of instructions to help complete the survey . . . 70
Table 7.1 This rubric assesses the quality of the code based on its implementation, com-ments provided and ease of understanding. . . 78 Table 7.2 The following rubric focuses on the design aspects of the project. . . 79 Table 7.3 Rubric used for submissions of technical articles or papers. . . 80 Table 7.4 Frequent and semantically important patterns captured from the set of project
List of Figures
Figure 2.1 Charniak parser’s output for the text “The author writes like a professional.” . . 11 Figure 2.2 Dependency tree representations of the text “The study guide does not discuss
much of the basics of ethics.” . . . 12 Figure 2.3 Word-order representation of the text “The study guide does not discuss much
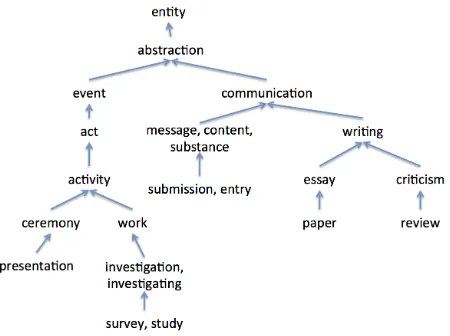
of the basics of ethics.” . . . 14 Figure 2.4 WordNet tree showing hypernym relations across synsets. . . 15
Figure 3.1 The figure contains a sample submission, a relevant review with explicit text overlaps, a relevant review which has lexico-semantic matches with the submis-sion’s text and a non-relevant review. . . 23 Figure 3.2 Displaying the ordering difference captured by the edges of a dependency tree
representation and a word-order representation for the text “The paper presented the important concepts.” . . . 25 Figure 3.3 Context matching across two text graphs. Similar dashed lines denote the pairs
of edges that are compared across for each type of context match. . . 26 Figure 3.4 Matching sentence segments across two text graphs. In the voice change match
the dashed lines denote the pairs of vertices that are compared when the sentence segments are compared—order of comparison is flipped. . . 28 Figure 3.5 Example of phrase or token matching and sentence structure match between a
review and a submission. . . 31 Figure 3.6 Comparison between word-order graph and dependency tree representations . . 32 Figure 3.7 Output from our review assessment system displaying relevance of reviews. . . 36
Figure 4.1 Illustration of our approach with examples of summative reviews . . . 43 Figure 4.2 Performance of differing number of patterns in identifying review content. . . . 47 Figure 4.3 Output from our review assessment system identifying content types for a review. 49
Figure 5.1 Submission with its topic sentences, and three reviews with high, medium and no coverage of the topic sentences. . . 53 Figure 5.2 Comparing sentences in a sample submission. The edges display the semantic
relatedness values between the sentences. . . 56 Figure 5.3 Two clusters formed by grouping the submission’s sentences . . . 57 Figure 5.4 Topic sentences are highlighted in red in each of the generated clusters. . . 61 Figure 5.5 Comparing sample reviews with the selected topic sentences. Review A has
more in common with the topic sentences, and so it has a higher coverage than reviews B and C. Some overt similarities have been highlighted. . . 62 Figure 5.6 Topic-representative sentences generated by our approach and by MEAD for a
sample submission. . . 64
Figure 6.3 Participants’ rating of motivation to use reviews and metareviews to improve the quality of their submission or review respectively. The chart also shows the par-ticipants’ estimation of usefulness of the automated metareview metrics’ output. 73 Figure 6.4 Participants’ ratings of the importance of each review quality metric. . . 74 Figure 6.5 Participants’ ratings of the usefulness of the system’s output for each review
Chapter 1
Automating Review Assessment
In recent years a considerable amount of research has been directed towards developing educational systems that foster collaborative learning. Collaborative learning systems provide an environment for students to interact with other students, exchange ideas, provide feedback and use the feedback to im-prove their own work. Systems such as SWoRD [2] and Expertiza [3, 1] are web-based collaborative, peer-review systems, which promote team work by getting students to work together to build shared knowledge with an exchange of ideas. The past few years have witnessed a growth in Massive Open Online Courses (MOOCs) such as Coursera and Udacity, as a platform for web-based collaborative learning. These systems also provide an environment for students to give feedback to peers on their work. MOOCs require a scalable means of assessment, and for material that cannot be assessed by multiple-choice tests, peer-review fills the bill. Feedback in the form of text-based reviews helps authors identify mistakes in their work, and learn possible ways of improving it.
The process of providing feedback to peers on their work helps the student learn more about the subject and develop their critical thinking. Rada et al. found that students who evaluated their peers’ work were more likely to improve the quality of their own work than those students who did not provide peer reviews [4]. The peer-review process is also likely to help the student learn to be more responsible. The classroom peer review process is very much similar to the process of reviewing scientific ar-ticles for journals, where students (reviewers) provide reviews and the instructor (editor) identifies the final grade (decision to accept or reject the submitted paper) based on the reviews. Scientific reviewers are likely to have prior experience reviewing articles and a considerable knowledge in the area of the author’s submission (the text under review). Students on the other hand are less likely to have had any prior reviewing experience. They have to be guided to provide high-quality reviews that may be useful to their peers.
Table 1.1: Some examples of reviews.
S No. Review
1 “The example needs work.” 2 “The organization is poor.”
3 “The example code for delegation is taken from one of the references listed at the bottom of the page.”
4 “I would like to see a better definition/explanation of each technique before getting into the advantages and disadvantages.”
can be poor, because of a lack of training or review skills—the same problem that makes metareviewing necessary.
Automatic essay-scoring systems and other intelligent tutoring systems provide automated evalua-tion of students’ work [7, 8]. However, few systems automatically provide feedback on the quality of reviews written by students. In this work we aim to develop a system that automatically evaluates stu-dent review responses and provides reviewers with metareview feedback that could help them provide better quality reviews. An automated metareview process ensures provision of immediate feedback to reviewers, which is likely to motivate them to improve their work and provide more useful feedback to the authors. It also ensures consistent, bias-free reviews to all reviewers.
1.1
Problem
Reviews aid in the decision-making process, whether it is a student’s grade or the decision to accept or reject a paper. It is therefore important to ensure that the reviews are of a good quality. Review comments may be vague or unjustified. The first two comments in Table 1.1 are generic and do not refer to a specific object in the author’s submission. For instance, what type of “work” does the “example” need? Or, why is the “organization” poor? These reviews are ambiguous, and need to be supported with more information. Reviews must provide detailed information, point out problems in the authors’ work or provide suggestions for improvement (similar to the last two comments in Table 1.1). Such a review would help authors understand where their work is lacking.
Since review comments contain unstructured text, it is important to identify metrics that suitably represent the features of a review. Some of the textual features of a review include its relevance to the submission, content, coverage, tone, quantity of feedback provided and plagiarism [9].
1.2
Background
An earlier approach to manually assessing the quality of peer reviews involved the creation and use of a Review Quality Instrument (RQI) [10]. Van Rooyen et al. use the RQI to check whether the re-viewer discusses the following: (1) importance of the research question, (2) originality, (3) strengths and weaknesses, (4) presentation and interpretation of results. In addition, the RQI also checks whether a review was constructive, and if the reviewer had substantiated their claims. We incorporate some of these metrics in our approach, e.g. detecting constructiveness in reviews (based on its content), check-ing whether reviewers substantiated their claims (by identifycheck-ing relevance to the author’s submission), to automatically assess review quality.
Nelson and Schunn studied feedback features that help authors understand and use reviews [11]. They found that features such as problem localization and solution suggestion helped authors understand feedback. These are some of the types of content we look for during review content identification.
Kuhne et al. use authors’ ratings of reviews to measure the quality of peer reviews [5]. They found that authors are contented with reviewers who appear to have made an effort to understand their work. This finding is useful to our automatic review quality assessment system, which assesses reviews based on the usefulness of its content. Our system also detects the relevance of reviews, which may be indica-tive of the effort made by a reviewer to understand and provide specific feedback.
Xiong et al. look for problems identified by reviewers in the author’s work, in peer reviews from the SWoRD system [12]. They use a bag-of-words exact-match approach to detect problem localization features. They use a shallow semantic match approach, which uses counts of nouns, verbs etc. in the text as features. Their approach does not incorporate relevance identification nor does it identify content type. Cho uses machine-classification techniques such as na¨ıve Bayes, support vector machines (SVM) and decision trees to classify review comments [13]. Cho manually breaks down every peer comment into idea units, which are then coded as praise, criticism, problem detection, solution suggestion, summary or off-task comment.
Review quality identification has been applied to study e-commerce reviews from Amazon, eBay etc. Product reviews’ helpfulness is determined based on how useful other users of a system think the reviews are. Zhang et al. determine review helpfulness based on ratings given by voters to a review [14]. Moghaddam et al.’s work on review helpfulness only takes raters’ information into consideration [15]. The authors suggest that the quality of a review depends on the type of reviewer, and hence they factor reviewer information into review helpfulness identification. They do not consider review content information while determining helpfulness. We do not take into consideration how other reviewers rank a certain review. Our approach aims to identify review quality based purely on the textual content of the review.
a review can be classified as recommended or not recommended. Turney’s approach to differentiate positive from negative reviews involves identifying similarity between phrases containing adverbs and adjectives and terms “excellent” and “poor” respectively. Turney uses semantic orientation to recom-mend products or movies. We also use semantic orientation, referred to as tone, to identify the degree of sensitivity (in terms of positive or negative words) with which reviewers conveyed their criticism.
Lim et al. identify reviewers who target e-commerce products and applications and generate spam reviews [19]. The problem of spamming may be analogous to the problem of copy-pasting text in order to game an automated assessment system into giving reviewers high scores on their reviews. Therefore, we introduce a metric to detect plagiarized reviews.
Some research works discuss metrics that are important in review quality identification, and some that apply shallow approaches to determine quality. However, there is no work that takes factors such as relevance, content type, coverage, tone, quantity and plagiarism into consideration while determining review quality. Our aim is to provide a suitable review assessment model that can be used to assess peer reviews as well as reviews in other application domains.
1.3
Approach Overview
Several factors help determine the quality of formative feedback. For example, the quality of feedback may depend on whether the reviewer was successful in identifying a problem in the author’s submission, or whether the reviewer provides the author suggestions or pointers to fix a problem. In order to assess quality, reviews have to be represented using metrics that capture their most important features. In gen-eral a good review contains: (1) coherent and well-formed sentences, which can be easily comprehended by the author, and (2) a sufficient amount of feedback.
In this section we discuss the metrics we use to assess reviews.
1.3.1 Review relevance
A review could be of a superior quality both semantically and syntactically, when compared to other high-quality reviews. However reviewers may tend to provide generic feedback. Reviews must be checked to ensure that they are written for the right submission. Thus a review’s relevance to a sub-mission is identified to ensure that the reviewer has correctly paraphrased concepts of the subsub-mission, and has provided justifications for any criticisms.
1.3.2 Review content
under evaluation, whileevaluativereviews criticize the author’s work and may include suggestions for improvement.
Contentof a review identifies the type of feedback provided by the reviewer. We identify content type of reviews based on whether they contain praise or a summary of the author’s work, are identifying problems or are suggesting possible improvements to the work. We look for the following types of content in a review:
• Summation:Summative reviews contain either a positive or a neutral assessment of the author’s submission. These reviews tend to be summaries of the author’s work.Example:“I guess a good study has been done on the tools as the content looks very good in terms of understanding and originality. Posting reads well and appears to be largely original with appropriate citation of other sources.” The reviewer praises the author’s work, and does not point out any problems in the work nor offer suggestions for improvement.
• Problem detection:Reviews in this category are critical of the author’s submission and point out problems in the submission.Example:“There are few references used and there are sections of text quoted that appear to come from a multitude of web sites.” The reviewer identifies the lack of references and also a possible case of plagiarism in the author’s work. Problem detection reviews only find problematic instances in the author’s work and do not offer any suggestions to improve the work.
• Advisory:Reviews that offer the author suggestions on ways of improving their work fall into this category.Example:“Although the article makes use of inline citations which is a plus, there are only a few references. Additional references could help support the content and potentially provide the examples needed.” Advisory reviews display an understanding of the author’s work, and explain the need for adding “more reference”. Also, advisory reviewers indicate that the reviewer has taken the effort to provide the author with constructive feedback.
Different types of review content have different degrees of usefulness. For instance summative re-views provide only summaries of the author’s work and are less useful to the author, whereas rere-views that identify problems in the author’s work or provide suggestions can be used by authors to improve their work, and are hence considered more important.
1.3.3 Review tone
of three types of tones—positive, negative or neutral. We use positive and negative indicators from an opinion lexicon provided by Liu et al. [21] to determine the semantic orientation of a review. Semantic orientation or tone of the text can be classified as follows:
• Positive:A review is said to have a positive tone if it predominantly contains positive feedback, i.e., it uses words or phrases that have a positive semantic orientation.Example:“The page is very well-organized and the information under corresponding titles is complete and accurate.” Adjec-tives such as “well organized”, “complete” and “accurate” are indicators of a positive semantic orientation.
• Negative:This category contains reviews that predominantly contain words or phrases that have a negative semantic orientation. Reviews that provide negative criticism to the author’s work fall under this category, since while providing negative remarks reviewers tend to use language or words that are likely to offend the authors. Such reviews could be morphed or written in a way that is less offensive to the author of a submission.Example:“The approach is trivial, and the paper has been formatted very poorly.” The given example contains negatively oriented phrases “trivial” and “very poorly”. The author could consider such a review to be rude. One of the ways in which this review could be re-phrased to convey the message politely is—“The approach needs improvement. In its present form it does not appear to be conveying any new information. The paper could have been formatted better.”
• Neutral:Reviews that do not contain either positively or negatively oriented words or phrases, or contain an equal amount of both are considered to be neutral.Example:“The organization looks good overall. But lots of IDEs are mentioned in the first part and only a few of them are compared with each other. I did not understand the reason for that.” This review contains both positively and negatively oriented segments, i.e., “The organization looks good overall” is positively oriented, while “I did not understand the reason for that.” is negatively oriented. The positive and negatively oriented words when taken together give this review a neutral orientation.
1.3.4 Review coverage
Reviews of submissions such as technical articles, documents, must be thorough in discussing its con-tent. At times a review may be based on just one section in a document, say theIntroduction, and may provide no feedback on any of the other sections in the document. We would like reviewers to pro-vide feedback on as many (if not all) sections of a submission. Review coverage identifies the extent to which a review covers the “important topics” in a document. Coverage of a review helps ensure the completeness of a review with respect to the submission.
1.3.5 Review quantity
Text quantity is important in determining review quality since a good review provides the author with sufficient feedback. We plan on using this metric to indicate to reviewers how much feedback they have provided in comparison to the average review quantity (from other reviewers of the system). This may motivate reviewers to provide more feedback to the authors. We identify quantity by taking a count of all the unique tokens in a piece of review. For instance, consider the following review, “The article clearly describes its intentions. I felt that section 3 could have been elaborated a little more.” The number of unique tokens in this review is 15 (excluding articles and pronouns).
1.3.6 Plagiarism
In an automated assessment system we might encounter reviewers who may copy-paste review responses or copy text from the submission or the Internet to make their reviews appear relevant and lengthy. Therefore we include an additional metric that detects plagiarism.
Reviewers do tend to refer to content in the author’s submission in their reviews. Content taken from the author’s submission or from some external source (Internet) should be placed within quotes in the review. If reviewers copy text from the author’s submission and fail to place it within quotes (knowingly or unknowingly) it is considered to be plagiarism.
1.4
The Expertiza Project
Expertiza is a collaborative web-based learning application that helps students work together on projects and critique each other’s work using peer reviews [3, 22, 1]. Expertiza frequently hosts courses related to software engineering. Reviews completed using Expertiza provide us with the data for analyzing the performance of our review quality metrics.
When students submit their work (a link to a page they created or edited online, or a document), other students are assigned to review their work. The review process is double-blinded, i.e., the author and reviewer information is anonymized to avoid recognition and possible collusion. Rubrics are provided to guide reviewers in the reviewing process. Student reviewers provide text and numeric feedback to authors. Authors use these reviews to update and improve their work.
Reviews submitted by students are manually metareviewed to ensure that the reviews are useful. Our aim is the automation of the metareview process—to provide instantaneous feedback to reviewers on the quality of their reviews.
1.5
Roadmap
In this thesis we address the problem ofautomatically assessing reviews. The following is the structure of the thesis:
Chapter 2discusses the text-representation and semantic-matching technique that aid solving the sub-problems of the review assessment task. The chapter describes our graph-based text representation, and includes the approach of creating word-order graphs. The chapter also discusses the semantic-relatedness metric our approach uses for graph matching.
Chapter 3discusses the sub-problem of identifying the degree of relevance between a review and the author’s submission. In this chapter we describe the use of a graph-based text matching approach to determine relevance. This chapter discusses related work in the area of paraphrase identification and text summarization. It also discusses experiments that evaluate our review relevance identification approach. Chapter 4discusses the sub-problem of identifying the type of content a review contains. This chapter describes the use of graphs to identify semantic patterns that suitably represent the different types of review content. We use a cohesion-based pattern-identification technique to capture the meaning of a class of reviews. The chapter also discusses evaluations of our content identification approach on reviews from peer-reviewing systems such as Expertiza and Scaffolded Writing and Rewriting in the Discipline (SWoRD).
identification approach on peer-review data from Expertiza.
Chapter 6discusses the user study we conducted to evaluate our automated review quality assessment system.
Chapter 7discusses the evaluation of project reviews using review quality metrics.
Chapter 2
Text Representation and Semantic
Relatedness
Several applications in natural language processing and related areas involve comparison of similar-meaninged texts. An approach that relies only on a simple lexical match across compared texts may not be effective at classifying or clustering semantically related texts [23].
Identifying a review quality metric such as relevance may involve looking for lexico-semantic matches between review sentences and submission sentences. A review’s content type may be iden-tified with the help of the most representative patterns for each content type. Our aim is to use lexical and syntactic features to identify relations within and across texts. We therefore need a representation that captures the syntax or order of tokens in a text. Hence we use a word order graph. Word order graphs are suited for identifying lexical and voice changes, which are common among paraphrased text. In this chapter we discuss the use of a meaning-based similarity metric to determine relatedness across two documents. We identify semantic relatedness between texts using a WordNet-based metric [24].
The word-order graph representation and the relations-based semantic metric we introduce in this chapter are used to determine the value of review quality metrics such asrelevance, content typeand coverage, discussed in Chapters 3, 4 and 5 respectively.
2.1
Graph Representation
Conventional text representation techniques include the vector-space model1, where every value in the vector represents a token in the text. Vectors capture information such as presence or absence of a token, or the number of occurrences of a token in a document. This is a bag-of-words representation, which does not capture ordering or syntax information.
Figure 2.1: Charniak parser’s output for the text “The author writes like a professional.”
Output from parsers such as the Charniak parser [25], Stanford NLP parser [26] contain syntactic parse trees, which contain labels such as S, NP or PP2. Figure 2.1 depicts the output from the Charniak parser for a piece of text. Output from a parser does not contain additional grammatical information [27] and may not be suitable for a lexico-semantic text matching.
The output from parsers may be used to generate dependency trees. Vertices in a dependency tree represent words and edges capture the asymmetric dependency relationships between a head and its modifier (modifier→head). Figure 2.2 contains a dependency tree representation [28] for the text “The study guide does not discuss much of the basics of ethics.” We see that every token in the text is a vertex in the tree and edges depict governance relations. For example, “does” is the root of this sentence, and the edge between “guide” and “does” signifies a subject relationship represented by SBJ.
Dependency trees succeed in capturing only governance information. They do not capture ordering information. In this chapter we propose the use of a graph representation for texts that extends the dependency-tree based representation to capture word-ordering information.
2.1.1 Related work
In this section we discuss some of the commonly used forms of graph-based text representations such as dependency trees, sentence graphs, concept graphs and lexical chains, used for tasks such as textual entailment, pattern identification and summarization.
Haghighi et al. [29] use a dependency tree representation to determine text entailment. They use node and edge subsumption metrics to determine relationships between texts. Lin and Pantel [30] use dependency trees to identify inference rules in a piece of text. These rules represent associations between a pair of paths in a dependency tree. Dependency trees that they use capture relationships between words and their modifiers. The trees do not maintain word-order information.
Mihalcea [31] use sentence graphs to perform text extraction and summarization. In sentence graphs each sentence in a document is represented as a vertex in the graph, and the weighted edges represent the degree of overlap across content of the sentences. This representation was found to be useful in extracting the most similar sentences, which form the document’s summary.
Sinha and Mihalcea [32] use concept graphs in their work to carry out word-sense disambiguation. Coursey and Mihalcea [33] identify the topic of an input document using concept graphs, and Erkan
2
Figure 2.2: Dependency tree representations of the text “The study guide does not discuss much of the basics of ethics.”
and Radev [34] perform text summarization using a sentence ranking approach. Barzilay and Elhadad [35] use lexical chains to perform text summarization. Lexical chains establish links across tokens that are semantically related. Concept graphs and lexical chains represent relationships between categories extracted from a knowledge resource such as Wikipedia. These representations do not maintain the original words or ordering information. In the next section we discuss our approach to generate word-order graphs.
2.1.2 Word-order graph generation
Vertices represent noun, verb, adjective or adverbial words or phrases in a text, and edges represent relationships between vertices. Our graph generation includes the following steps:
Dividing text into segments:A piece of text may contain multiple text segments. A text segment is a complete grammatical unit. Each segment of a sentence is separated by period (.), semicolon (;), exclamation point (!) or question mark (?). We use the listed set of punctuation to break the text into multiple segments.
Part-of-speech (POS) tagging:The text is then tagged with part-of-speech information (NN, DT, VB, RB2 etc.) We use the Stanford NLP POS tagger to generate the tagged text [26]. This information is useful in determining how to group words into phrases while still maintaining the order. For exam-ple, the text “The study guide does not discuss much of the basics of ethics” after POS tagging looks as follows—“The/DT study/NN guide/NN does/VBZ not/RB discuss/VB much/JJ of/IN the/DT basic-s/NNS of/IN ethicbasic-s/NNS”2.
Vertex and Edge creation:The vertex and edge creation steps are explained in Algorithm 1. From each sentence segment consecutive subject or noun components (also referred to as asubstantive3), which in-clude nouns, prepositions, conjunctions and Wh-pronouns are combined to form a subject vertex (Lines 4–8 of Algorithm 1). Consecutive verbs (or modals) are combined to form a verb vertex (Lines 18– 23); similarly with adjectives (Lines 33–38) and adverbs. In Figure 2.3 tokens “study” and “guide” are combined to form the vertex “study guide”.
When a subject vertex is created the algorithm looks for the last created verb vertex to form an edge
3
Algorithm 1:Vertex and Edge Creation Algorithm Input: Text segments
Output: Graph representation ofs 1 foreach tokenwin segmentsdo 2 switchwdo
3 casesubstantive
4 ifprevious vertex was a substantivethen
5 Concatenatewwith previous vertex/* updating vertex */
6 else
7 Create a new substantive vertexw/* creating a new vertex */
8 end
9 ifan adjectivejwas the previous vertexthen
10 ifa predicative adjective edge exists betweenjand previous substantiven0then 11 Delete edge betweenjandn0
12 end
13 Add an attributive adjective edge betweenjandw
14 end
15 ifverbvexistsandverb-substantive edge (v,w) does not existthen 16 Add an edge betweenvandw/* predicate creation */
17 end
18 caseverb or modal
19 ifprevious vertex was a verbthen
20 Concatenatewwith previous vertex/* updating verb */
21 else
22 Create a new verb vertexw
23 end
24 ifan adverbrwas the previous vertexthen
25 ifedge exists betweenrand previous verbv0then 26 Delete edge betweenrandv0;
27 end
28 Add an attributive adverb edge betweenrandw
29 end
30 ifsubstativenexistsandsubstantive-verb edge (n,w) does not existthen 31 Add an edge betweennandw/* substantive–verb edge creation */
32 end
33 caseadjective
34 ifprevious vertex was an adjectivethen 35 Concatenatewwith previous vertex
36 else
37 Create a new adjective vertexw
38 end
39 ifsubstantivenexistsandpredicative adjective edge (n,w) does not existthen 40 Add a predicative adjective edge betweennandw
41 end
42 caseadverb
/* Similar to adjective creation. */
43 endsw
44 endsw
Figure 2.3: Word-order representation of the text “The study guide does not discuss much of the basics of ethics.”
between the two (Lines 15–17), i.e., create the predicate. When a verb vertex is found, the algorithm looks for the latest subject vertex to create a subject–verb edge (Lines 30–32). Ordering is maintained when an edge is created i.e., if a verb vertex was formed before a subject vertex a verb–subject edge is created, else a subject–verb edge is created.
An adjective or adverb may be used in the attributive (precedes the noun or verb) or predicative (linked to the subject usually through a verb) position.4 Initially the property is attached to a former substantive or verb vertex i.e. a predicative adjective is created (Lines 39–41). If a substantive or verb vertex is found to immediately follow the adjective, the property is removed from the former vertex and is attached to the new vertex i.e., an attributive adjective or adverb is created (Lines 9–14).
Labeling graph edges:Graph edges that are created in the previous step are labeled with dependency (word-modifier) information. After edge creation, we iterate through all the graph edges to determine whether a dependency relation exists between the edge’s vertices. If a dependency relation exists the relation information is added as the edge’s label as shown in Figure 2.3.
Word-order graphs are used to determine the values of review quality metrics–relevance, content type andcoverage. The different graph structures—vertices, edges and double edges (two contiguous edges), capture context and ordering information, and aid graph matching. Our graph-based lexico-semantic matching has been explained in greater detail in Chapter 3.
2.2
Semantic Relatedness
Current approaches to identifying semantic relatedness use knowledge resources such as Wikipedia [36] and its web-counterpart DBPedia [37]. When comparing two terms, Wikipedia articles or concepts con-taining the terms to be compared are queried from over 3 million articles (≈3GB in size) [38]. Current techniques are also burdened by time-consuming preprocessing techniques [39]. Although Wikipedia has been shown to perform well at identifying semantic relatedness, its large size and querying time makes it difficult for smaller applications that do not have access to large clusters of parallel computers to adopt it as a knowledge resource.
Expensive preprocessing may also have scalability issues, especially when comparing texts
con-4
Figure 2.4: WordNet tree showing hypernym relations across synsets.
taining hundreds of tokens. Consider the task of review relevance identification (described in detail in Chapter 3). We calculate relevance by identifying lexico-syntactic matches between the review and sub-mission texts. This matching is across documents, which contain more than hundreds of words. Apart from being time-consuming, Wikipedia-based approaches seem to work well when noun entities (topics) are compared.
Relevance identification involves checking for paraphrases [40], i.e., identifying lexical or word-order changes, use of synonyms, definitions or examples of tokens etc. Such a comparison between reviews and submissions would involve checking for relatedness across verb, adjective or adverbial-forms, checking for cases of nominalizations (noun form of adjectives) etc. Using vectors of concepts (as done by Gabrilovich et al. [37]) to represent review and submission texts may not be suitable for the task of relevance identification.
WordNet is a widely used resource for measuring similarity. WordNet is a network of nouns, verbs, adjectives and adverbs, which are grouped intosynsets(synonymous words), and linked by lexical rela-tions [24]. WordNet does not perform as well as Wikipedia due to its limitarela-tions in terms of the domains it covers, and its lack of real-world knowledge. However WordNet is faster to query and involves no additional preprocessing. WordNet also allows comparison across different word forms.
In this paper we introduce a unique WordNet relations-based matching approach to determine rele-vance, as an improvement over conventionally used path and distance-based measures [41, 42].
2.2.1 Existing models
Information content and path-based measures
Semantic relatedness using WordNet taxonomy has been explored by content and path-based measures, which make use of distances between synsets to match words. We introduce a few content and path-based measures in this section, and describe their approach to calculate relatedness.
Information content of a word is calculated in terms of its probability of occurrence in a corpus. Path-based measures determine relatedness between wordsw1 andw2 by identifying the distance between
two nodess1ands2in a taxonomy that are representative of the words. In a taxonomy such as WordNet,
s1ands2represent the synsets (or synonym sets) of two wordsw1andw2respectively.
Jiang and Conrath [43] use Information Content (IC) to determine relatedness between terms.lcsis the lowest common subsumer of the nodess1 ands2. The lowest common subsumer is the node in the
taxonomy that is general enough to subsume the meanings of both wordsw1andw2. For instance in the
WordNet taxonomy in Figure 2.4, “activity” is the lowest common subsumer of the word “presentation” and the set “survey, study”. Relatedness is calculated using the formula:
Jiang(s1, s2) =IC(s1) +IC(s2)−2×IC(lcs)
Jiang’s formula captures the cumulative information content of the two synsets s1 ands2. Since
both synsets include the information content of their lowest common subsumer, it is deducted from the formula in order to only consider each synset’s information content in the relatedness measure.
Leacock and Chodorow [42] determine relatedness in terms of the shortest distance (length) between two nodes in a taxonomy. In the following formula5Dis the maximum depth of the taxonomy. Accord-ing to Leacock and Chodorow’s formula relatedness is inversely proportional to the length between the two nodes or WordNet synsets. The greater the length, the lower the relatedness value. The length has been normalized using the maximum depth of the taxonomy.
Leacock(s1, s2) =−log
length
2×D
!
Wu and Palmer [41] determine relatedness between tokens in terms of the depth of their least com-mon subsumer and the depth of their nodes in the taxonomy.
Wu(s1, s2) =
2×depth(lcs) (depth(s1) +depth(s2))
Later on in this chapter we compare our relations-based metric with each of these content and path-based measures.
Wikipedia-based measures
Wikipedia is a widely used knowledge resource that helps determine relatedness across concept tokens. Strube and Ponzetto [36] compare the usefulness of both WordNet (path and information-content based
5
measures) and Wikipedia in identifying semantic similarity across tokens or phrases. They found that WordNet performs well on Miller & Charles [44] and Rubenstein & Goodenough (RG65) [45] datasets, while Wikipedia performed well on the WordSim353 (WS353) [46] dataset. Strube and Ponzetto found that WordNet did not suffer from limited coverage, since only 2 out of the 353 words in the WS353 dataset were absent in WordNet as opposed to 13 absent words in Wikipedia.
Gabrilovich et al. [37] represent text as vectors of concepts extracted from Wikipedia (which are pre-dominantly nouns and named entities). This type of approach may be suited for tasks such as identifying topics among texts that are abounding in named entities (e.g. news articles). Their approach involves the extraction and processing of 3 million URLs containing 70GB of data.
Agirre et al.’s [39] approach to identify relatedness involves the generation of a personalized6 PageR-ank graph for every pair of words, which are compared (different edge weights). Generating a graph for every pair of words may not be feasible when identifying similarities between two large documents. Their technique takes about 15 minutes on 2000 cores to generate the corpus used for matching.
Word-sense disambiguation measures
Another category of measures makes use of the compared words’ senses to determine relatedness be-tween them. Sense of a word pertains to its meaning. For example, the word “bank” may be used to mean a river’s bank or a financial institution, i.e., these are two different senses of the word “bank”. Sense identification or disambiguation techniques use context-based measures [47]. Lesk identifies overlaps between the definition of a word whose sense is to be determined, and a word whose sense is already known. Greater the overlap, higher the likelihood of both words having the same sense or meaning.
Abhishek [48] proposed a word-sense similarity metric, which utilizes the frequency of terms’ senses in a document to identify its similarity with another document. Such an approach ensures that the terms are used in the same sense in both documents. Similarity between two tokenst1 andt2 is
calculated using the following equation.
WordSense(t1, t2) =cosine(sensevector(t1),sensevector(t2)) (2.1)
Limitations of existing models
Wikipedia or DBPedia-based approaches seem to work well in cases where only concepts or topics (nouns) are compared. Datasets on which Wikipedia-based approaches are evaluated: WordSim353 (WS353) [39], Rubenstein and Goodenough (RG65) [45] and Miller and Charles (MC30) [44] con-tain mainly synonymous nouns. When comparing text documents we encounter words that are of type verbs, adjectives, adverbs etc. For instance while searching DBPedia for information on the termrun7,
6
Biased PageRank, where the transition to from a nodeutovdepends on the weight on the edges.
7
we find instances referring to a baseball run, movies or songs that contain the term run in it. The mean-ing ofrunwe are looking for “move at a speed faster than a walk, never having both or all the feet on the ground at the same time” is available when we search for the termrunning8 (a noun). Therefore, querying using knowledge resources such as Wikipedia involves:
1. Time-consuming preprocessing and data transformation steps.
2. Ambiguity in determining the search term (e.g. use of noun “running” to extract the verb “run”).
In the next section we discuss our relations-based metric to determine semantic match between tokens.
2.2.2 WordNet relations-based semantic metric
In order to identify similarity, we use a relations-based metric. Relatedness between two terms vand
w, known asmatch(v,w) is one of those listed below. Each of these types of matches is given a weight value depending on the importance of the match. Similarity matches are assigned values in the range of 0–6, where 6 represents the best match (an exact match) and 0 represents a distinct or non-match.
• vandwareexactlythe same. This match is given a weight value of 6. • vandwaresynonymous. This match is given a weight of 5.
• vis ahypernymofw(i.e.,vis more generic than the tokenw) or vice versa. Orvis ahyponym ofw(i.e.,vis a more specific form ofw) or vice-versa. This match is given a weight of 4.
• v is ameronymofw (i.e.,vis a sub-part of w) or vice versa. Orv is aholonymofw (i.e.,v
containswas a sub-part) or vice-versa. For example, “arm” is a meronym of the token “body” and “body” is the holonym of the term “arm”. This type of match is given a weight of 3.
• Ifvandwhavecommon parents(excluding generic parents such as “object”, “entity”, “organ-ism” etc.), the normalized distance9between the two tokens’ synsets is identified. (1−distance) gives the similarity between the two tokens, which is then scaled in the range of 0 to 6 (the lowest and highest values of our semantic metrics). If the scaled value is>0, then a common parents match exists betweenvandw. This match is given a weight of 2.
• Lesk [47] identifies matches between the definition of a word, whose sense is to be determined and the word, whose sense is already known. A high degree of overlap indicates that the two tokens share the same sense. We useoverlapping definitionsas a metric to determine possible 8
DBPedia page forrunning: http://dbpedia.org/page/Runing
9
context-based similarity across tokens. For instance, tokens “quantity” and “enough” have over-lapping definitions. The word “adequate” can be found in both tokens’ definitions, i.e., quantity’s definition—an adequate or large amount and enough’s definition—an adequate quantity. We also findoverlaps across examplesof the words. If two tokens have overlapping definitions or examples, then the match gets a weight value of 1.
• vandwcontaindistincttokens or phrases. Distinct match is given a weight of 0.
We use a combination of the token and its POS information for comparison with another token. This matching ensures that the right type of words is being compared. POS information helps extract the ap-propriate set of synonyms, hypernyms etc. for a token. For instance, the synonym set generated for verb “run” is [runner, running, operation, operator, operative, operant, functioning, campaign, campaigner, hunt, hunter, hunting, race, racer, racing], and for noun “run” is [tally, test, stream, campaign, ravel, lad-der, runny, discharge]. Thus, the meaning of the generated synonyms differs with the POS information. Therefore, our metric determines relatedness using the POS values of the compared tokens.
2.2.3 Experiments
In this section we conduct some preliminary evaluations to study the ordering of the relations (e.g. exact match, synonym match etc.) in our semantic metric. We demonstrate that the relative ordering of the weight values plays an important role in identifying matches, i.e., exact matches are more important than synonyms, which are more important than hypernyms or hyponyms and so on. We also evaluate the performance of our metric by comparing it with existing WordNet-based content and path measures (listed in Section 2.2.1). We use two different datasets WS353 and RG65 for our evaluation.
Dataset
The WS353 similarity and relatedness collection contains 353 pairs of words. 13 annotators evaluated 153 word pairs, and 16 annotators evaluated 200 word pairs on a scale of 0 to 10. We use the mean sim-ilarity scores for our evaluation purposes. The RG65 dataset consists of 65 pairs of synonymous nouns. The WS353 and RG65 datasets contain the average relatedness ratings provided by human annotators. We compare the similarity values produced by our WordNet metric with the scores from the annotators. We have not calculated the mean values or made any other changes to the existing datasets.
Evaluation of relative ordering
Table 2.1: Evaluating the relative ordering of the WordNet match types with different sets of weight values assigned to each relation.
WordNet metric WS353-Full WS353-Test RG65
0–6 scale 0.43 0.47 0.83
Exponential values 0.41 0.45 0.83
Random values 0.42 0.46 0.83
assigned to the matches. We use exponential values (1, 2, 4, 8, 16, 32, 64) and random values (2, 10, 23, 40, 47, 50, 52) as weights for the WordNet metrics.
System-generated values just like the human relatedness ratings are ordinal i.e., they exhibit a rela-tive ranking and cannot be interpreted on an interval or ratio scale. Since Spearman10correlation mea-sure is more suited to determining correlations between ordinal data, we use it to correlate the system-generated values with human-provided relatedness values. Results listed in Table 2.1 indicate that the correlations achieved by the exponential and random weights are comparable to those achieved by the [0–6] weight scale. Thus we see that irrespective of the values, the relative ordering of the WordNet metrics used by our approach produces high correlations. Therefore the values of the weights are not as important as their relative order.
Comparison with other relatedness metrics
In order to ensure that our WordNet-based relations metric is a suitable semantic relatedness metric, we compare our approach’s results with other measures, which use only WordNet and no external knowl-edge resources or corpuses. We use WordNet to implement the information content, path-based and word-sense disambiguation measures.
Table 2.2 lists the Spearman correlation values achieved by each of the similarity metrics with the human annotations, for the above-mentioned datasets. Values 0.43, 0.47 and 0.83 achieved by our metric on the WS353-Full, -Test and RG65 datasets indicate that our metric has a positive correlation with human annotations.
It must be noted here that our approach produces a correlation of 0.83 on the RG65 dataset, which is greater than the correlation of 0.82 achieved by a Wikipedia-based approach proposed by Gabrilovich and Markovitch [37]. The words used in the WS353 and RG65 datasets include commonly used nouns, and we have shown that our metric has a good correlation with human-provided relatedness values on other types of datasets.
10
Table 2.2: Comparing WordNet-based semantic relatedness measures. This table contains correlations of each of the measures’ values with human relatedness ratings on the WS353 and RG65 datasets.
Similarity Metrics WS353-Full WS353-Test RG65
Our WordNet measure 0.43 0.47 0.83
Wu[36] 0.30 0.28 0.82
Leacock[36] 0.34 0.35 0.86
Jiang 0.31 0.36 0.54
WordSense 0.28 0.31 0.56
2.3
Contributions
Some of the chief contributions of this work are:
1. A unique graph representation, which captures word order, syntax and role information.
2. A WordNet order-based relatedness metric to capture similarity across tokens.
3. We compare our metric with several WordNet-based relatedness metrics on WS353 and RG65 datasets and show that our relatedness metric produces higher correlations than the other mea-sures.
2.4
Conclusion
In this chapter we introduce a graph-based text representation that captures word-ordering information. We use this word-order graph representation to calculate some of the review quality metrics such as rel-evance, review content type and review coverage, which involve a lexico-semantic matching approach (explained in detail in the following chapters). We introduce a unique relations-based semantic relat-edness measure. We use features such as exact matches, synonymy, hypernymy, hyponymy, holonymy, meronymy, common parents and overlapping definitions to determine matches between texts.
Chapter 3
Review Relevance
Reviews are text-based feedback that help people make assessment decisions, e.g., for grading students, accepting manuscripts for publication, funding grants or deciding whether to use the reviews to improve the submission. Therefore, the review’s content must be useful to the decision-making party. Kuhne et al. [5] found that authors are contented with reviewers who make an effort to understand their work. Nelson and Schunn [11] found that reviews help authors understand and use feedback effectively, if they locate specific problematic instances in the author’s work, or provide suggestions for improvement. We manually investigated peer reviews from Expertiza and found that reviewers often tend to pro-videvagueorgenericcomments. Comments such as, “Yes, it is good” and “It is very well organized” are frequent in the data set. These review comments appear to be generic and they do not reflect the re-viewer’s understanding of the author’s work. Authors are less likely to be pleased with generic reviews, especially because these reviews cannot be used to improve the quality of their work.
Consider the comment, “I felt that some of the examples were clich´ed.” The reviewer is criticizing the “examples” in the author’s work but does not provide any justification. The review does not reference specific examples that the reviewer finds “clich´ed”. Unjustified review comments, which do not identify specific problematic instances in the author’s work, may not be useful to the author.
Arelevant reviewparaphrases the concepts described in a submission, with possible descriptions of problems identified in the author’s work. Our aim is to decide whether a review is relevant to the work it was written for.
Definition LetSbe the set of sentences in the text under review (the submission) andR be the set of review sentences. Letsandrrepresent a sentence in the submission and review respectively.
relevance(S, R) = |R1| P ∀r∈R
{argmax
∀s∈S
(lexicoSemSim(s, r))} (3.1)
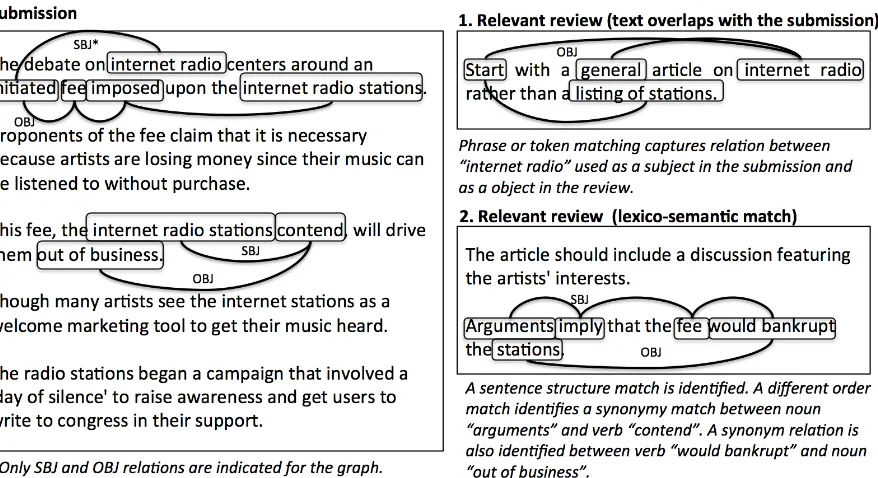
Figure 3.1: The figure contains a sample submission, a relevant review with explicit text overlaps, a relevant review which has lexico-semantic matches with the submission’s text and a non-relevant review.
approach to determining the lexico-semantic match between review and submission sentences has been described in Section 3.2.
Figure 3.1 contains a sample submission and three sample reviews. The first review has some in-stances of exact match with the submission and is therefore relevant to the submission. A text-overlap match may not determine the relevance of the second review. The third review is distinct from the sub-mission.
Conventional text-similarity matching approaches look for frequentn-gram matches across texts. Papineni et al. [49] comparen-grams to identify the degree of similarity between a machine-translated candidate text and a human-provided reference text. Such similarity matching techniques may not be good at identifying the relevance of the above-mentioned types of reviews. Therefore, more sophisti-cated text-matching techniques and metrics are required to identify relevance.
We propose the use of a graph-based text representation and matching technique to identify rele-vance between review and submission texts. We use the word-order graph representation and semantic-relatedness metric described in Chapter 2 to identify relevance.
lexico-semantic graph-based matching approach to identify relevance. Section 3.3 discusses the experiment we conducted to evaluate our approach on review-submission data from Expertiza. Section 3.4 discusses the performance of our word-order graph (discussed in Chapter 2) in comparison to that of a dependency tree representation. Section 3.5 demonstrates the performance of our semantic-relatedness metric (also discussed in Chapter 2). Section 3.6 contains a discussion on the generalizability of our approach for the textual entailment identification task. Section 3.7 describes the format of relevance feedback presented to reviewers. Section 3.8 lists the contributions of this work, and Section 3.9 concludes the chapter with a summary.
3.1
Related Work
There is little previous work in the area of identifying relevance between a review and a submission. Our approach is one of the first to use relevance as a metric to study review helpfulness. Due to the lack of sufficient work in relevance identification, we discuss existing research in the related application domains of text paraphrasing and summarization. Work on paraphrasing is close to our problem, since paraphrased texts may be lexico-semantically similar in meaning to the text being paraphrased. We also discuss some related work in the area of graph-based text matching.
Text paraphrasing is close to our approach since we aim to identify paraphrases in reviews, and since paraphrases and summaries tend to involve changes to word order while maintaining the original meaning of the text. Boonthum [50] lists six patterns followed commonly while paraphrasing a piece of text. Some of the patterns include the use of synonyms, change in voice, change in sentence structure and providing definitions of words. According to Liu et al. [51] a paraphrase preserves the original meaning of the text but may also contain some syntactic changes.
Kauchak et al. [52] suggest an automated technique to create paraphrases for human and machine-translated text pairs by substituting words in machine machine-translated texts by their synonyms. They define paraphrases primarily in terms of synonyms of individual tokens. Although their token-substitution technique takes into consideration some context information they do not consider other paraphrasing techniques, which involve word or phrase shuffling across the length of the text. Qiu et al. [53] use a dissimilarity-based paraphrase identification technique. They use the significance or insignificance of unpaired sentence tuples to identify paraphrases between a pair of texts.
(a) Dependency tree (b) Word-order graph
Figure 3.2: Displaying the ordering difference captured by the edges of a dependency tree representa-tion and a word-order representarepresenta-tion for the text “The paper presented the important concepts.”
The document index graph (DIG) used by Hammouda and Kamel, capture phrases of a document [55]. Although the DIG captures order of words within a phrase, it does not capture the order of phrases within a document. As a result this representation does not capture complete sentence-structure infor-mation, which may be necessary to decide whether a review contains sentence-structure changes.
Haghighi et al. [29] use dependency trees to determine text entailment. They determine text entail-ment with the help of node and path substitutions across directed graph representations of the hypothe-sis and the text. They determine the cost of substituting vertices and paths in the hypothehypothe-sis with those found in the text. Match across the graphs is determined by comparing vertices as well as edges. They do not perform comparisons across edges in different orders to account for word-order shuffling during paraphrasing. Dinu and Lapata [56] use dependency trees to identify similarity between patterns using context information coded as latent variables in the words’ vector representations.
Ham et al. construct phrase nets using regular expressions [57]. Phrase nets are constructed for specific relations between tokens e.g. “X at Y” may indicate location of object X. Phrase nets are used as a tool to determine relations between objects in literary texts.
Although there exist independent research works that discuss graph-based summarization and para-phrasing techniques, they use only content overlap or synonym matches to determine paraphrases. They do not consider context during text comparison. Our approach uses both semantic and syntactic features during relevance identification, and this helps determine any syntactic similarities or dissimilarities that exist between texts.
3.2
Lexico-Semantic Graph-based Matching
Paraphrasing is the process by which an idea is restated by the paraphraser, thus displaying an under-standing of the text [50]. While paraphrasing it is common for paraphrasers to restructure their sentences. Therefore we perform paraphrase detection by matching graph vertices and edges (edges maintain word order information).
ref-(a) Ordered match. (b) Lexical change
Figure 3.3: Context matching across two text graphs. Similar dashed lines denote the pairs of edges that are compared across for each type of context match.
erences specific concepts in the submission (i.e., provides justifications). The degree of match between two graphs depends on the degree of match between their vertices and edges.
3.2.1 Phrase or token matching
In phrase or token matching, vertices containing phrases or tokens are compared across graphs. This matching succeeds in capturing semantic relatedness between single or compound words. When vertices “concepts” and “points” (in Figure 3.3a) are compared using WordNet, a common parents match is identified. This match would have been missed when using only an exact or synonym match.
Phrase(S, R)= |V1
r|
P ∀r(v)∈Vr
argmax
∀s(v)∈Vs
{match(s(v), r(v))} (3.2)
An overall phrase match is determined by taking the average of the best match that every review phrase has with a corresponding submission phrase. Similarity between two vertices is calculated as the average of matches between their constituent words or phrases. Match could be one of the WordNet relations metrics listed in Chapter 2 Section 2.2.2. In Equation 3.2,r(v)ands(v) refer to review and submission vertices respectively, and Vr andVs are the set of vertices in a review and a submission respectively.
3.2.2 Context matching
• Ordered match: Ordered match preserves the order of phrases in a text. We compare same-type edges1 with the same vertex order. Relatedness between edges is the average of the vertex matches. Edge labels are compared in ordered matching, and the match value is halved if the edge labels are different. Edge labels have a high weight in the comparison, and so the average match value decreases when no edge match is identified.
Figure 3.3a shows the comparison of single edges from two review graphs. A match is identified between edges “important–concepts” and “necessary–points”, because they capture the noun-modifier relationship (NMOD), and because a common parents relation exists between tokens “concepts” and “points”.
• Lexical change: Lexical match flips the order of comparison, e.g., we compare subject–verb with verb–object edges or vice versa. The match identifies paraphrases, which contain lexical changes. Figure 3.3b depicts lexical-change match. When comparing edge “paper–presented” with edge “included–points”, we compare vertex “paper” with “points” and “presented” with “included”. A match is found between tokens “paper” and “points” causing the edge pair to get a match value
>0.
• Nominalization match: The match identifies noun nominalizations—nouns formed from verbs or adjectives (e.g. abstract→abstraction, ambiguous→ambiguity). We compare vertices of differ-ent types, e.g., the subject and verb vertices or the subject and adjective vertices. This match also captures relations between nouns and their adjective forms (e.g. ethics→ethical), and nouns and their verb forms (e.g. confusion→ to confuse). When we compare the edge “paper–presented” with edge “presentation–included”, we compare “paper” with “included” and “presented” with “presentation”. Token “presentation” is the nominalization of “presented”, as a result of which a match is identified between the two edges.
Context(S, R)= 3|E1
r|
P
r(e)∈Er
argmax
∀s(e)∈Es
{matchord(s(e), r(e))}+
P
r(e)∈Er
argmax
∀s(e)∈Es
{matchlex(s(e), r(e))}+ P r(e)∈Er
argmax
∀s(e)∈Es
{matchnom(s(e), r(e))}
(3.3) In Equation 3.3, r(e) and s(e) refer to review and submission edges. The formula calculates the average for each of the above three types of matches matchord, matchlex and matchnom. Er andEs
represent the sets of review and submission edges.matchord,matchlexandmatchnom are calculated as
the average of the best ordered, lexical or nominalization matches that each of the review edges have with corresponding submission edges.
1