Bioavailability of sediment-associated mercury to
Hexagenia
mayflies in a contaminated floodplain
river
Teresa J. Naimo, James G. Wiener, W. Gregory Cope, and Nicolas S. Bloom
Abstract: We examined the bioavailability of mercury in sediments from the contaminated Sudbury River (Massachu-setts, U.S.A.). Mayfly nymphs (Hexagenia) were exposed in four 21-day bioaccumulation tests to contaminated and ref-erence sediments (treatments) from reservoirs, flowing reaches, palustrine wetlands, and a riverine lake. Mean total mercury (SHg) ranged from 880 to 22 059 ng·g dry weight–1in contaminated sediments and from 90 to 272 ng·g–1in reference sediments. Mean final concentrations of methyl mercury (MeHg) in test water were greatest (8–47 ng Hg·L–1) in treatments with contaminated wetland sediments, which had meanSHg ranging from 1200 to 2562 ng·g–1. In may-flies, final mean concentrations of MeHg were highest in treatments with contaminated wetland sediments (122–183 ng Hg·g–1), intermediate in treatments with contaminated sediments from reservoirs, flowing reaches, and a riverine lake (75–127 ng Hg·g–1), and lowest in treatments with reference sediments (32–41 ng Hg·g–1). We conclude that the poten-tial entry of MeHg into the benthic food chain was greater in contaminated palustrine wetlands than in the contami-nated reservoirs, which had the most contamicontami-nated sediments.
Résumé : Nous avons étudié la biodisponibilité du mercure dans les sédiments d’un cours d’eau pollué des États-Unis (rivière Sudbury, au Massachusetts). Des nymphes d’éphémères (Hexagenia) ont été exposées, dans le cadre de quatre épreuves de bioaccumulation de 21 jours, à des sédiments de référence et à des sédiments contaminés provenant de ré-servoirs, de tronçons d’eau vive, de milieux humides palustres et d’un lac fluvial. La quantité moyenne de mercure to-tal (SHg) était comprise entre 880 et 22 059 ng·g poids sec–1dans les sédiments contaminés et entre 90 et 272 ng·g–1 dans les sédiments de référence. La concentration moyenne finale de méthyl mercure (MeHg) dans l’eau étudiée était au plus haut (8–47 ng Hg·L–1) dans les expériences sur des sédiments contaminés provenant de milieux humides, dont laSHg moyenne était comprise entre 1200 et 2562 ng·g–1. Chez les éphémères, la concentration moyenne finale de MeHg était au plus haut dans les expériences sur des sédiments contaminés de milieux humides (122–183 ng Hg·g–1), intermédiaire dans les expériences sur des sédiments contaminés provenant de réservoirs, de tronçons d’eau vive et d’un lac fluvial (75–127 ng Hg·g–1) et au plus bas dans les expériences en présence de sédiments de référence (32–41 ng Hg·g–1). Nous concluons que la possibilité d’entrée du MeHg dans la chaîne alimentaire benthique était plus grande dans les milieux humides palustres contaminés que dans les réservoirs contaminés, qui pourtant renfer-maient les sédiments les plus contaminés.
[Traduit par la Rédaction] Naimo et al. 1102
Introduction
The Sudbury River in eastern Massachusetts (U.S.A.) has
been contaminated by chemical wastes originating from the
Nyanza chemical waste dump site (Nyanza site), a former
industrial complex in the town of Ashland. Large quantities
of mercury, a toxic metal with no known essential biological
function, were released to the environment at the Nyanza
site (NUS Corporation 1992; Wiener and Shields 2000). The
fine-grained sediments in downstream reaches of the
Sudbury River now contain a substantial quantity of
inor-ganic mercury (Colman et al. 1999; Frazier et al. 2000),
pos-ing a potential hazard to biota in the river and its adjoinpos-ing
wetlands. High concentrations of mercury were found in fish
taken downstream from the Nyanza site (NUS Corporation
1992), but it was not known whether the mercury
accumu-lating in fish and other biota was derived from contaminated
sediments or from other inputs to the river.
Information on the bioavailability of mercury in
contami-nated sediments in the Sudbury River and its floodplain was
needed to assess the potential entry of methyl mercury
(MeHg) into aquatic food chains supporting fish and higher
trophic levels. Potential sources of MeHg to riverine biota
include methylation of inorganic mercury in flowing
reaches, reservoirs, riverine lakes, and adjoining wetlands
(St. Louis et al. 1994; Hurley et al. 1995; Krabbenhoft et al.
1995; Rudd 1995). MeHg may also enter the river in
atmo-spheric deposition (Rudd 1995).
In the present study, the bioavailability of mercury in
fine-Received June 20, 1997. Accepted May 6, 1999.J14076
T.J. Naimo,1J.G. Wiener, and W.G. Cope.2
U.S. Geological Survey, Biological Resources Division, Upper Midwest Environmental Sciences Center, 2630 Fanta Reed Road, La Crosse, WI 54603, U.S.A. N.S. Bloom. Frontier Geosciences, 414 Pontius Avenue North, Suite B, Seattle, WA 98109, U.S.A.
1Author to whom all correspondence should be addressed.
e-mail: teresa_naimo@usgs.gov
2Present address: Department of Toxicology, North Carolina
grained, surficial sediments from the Sudbury River was
as-sessed in bioaccumulation tests with burrowing mayfly
nymphs (Hexagenia) experimentally exposed to sediments
from the river basin. Hexagenia is a benthic detritivore
com-mon in many North American rivers, including the Sudbury
River. Burrowing mayflies and other benthic invertebrates
are potentially important in the trophic transfer of MeHg
be-cause of their significance in the diets of fish and certain
waterfowl. Hexagenia nymphs select substrates with high
organic and silt content, an association that increases their
exposure to sediment-associated contaminants. Hexagenia
nymphs have been widely used as test organisms in
labora-tory tests, including bioaccumulation tests with inorganic
mercury and MeHg (Saouter et al. 1991, 1993; Odin et al.
1994, 1995). Burrowing mayflies readily bioaccumulate
MeHg associated with ingested sediment and detritus
(Saouter et al. 1991, 1993; Odin et al. 1994, 1995).
Bio-accumulation tests with Hexagenia, therefore, provide an
in-direct measure of the production of MeHg in
mercury-contaminated surficial sediments and of the potential entry
(flux) of MeHg into the benthic food chain.
Our objectives were (i) to determine if Hexagenia mayfly
nymphs exposed to mercury-contaminated surficial sediment
from the Sudbury River accumulate MeHg, (ii) to determine
if the accumulation of MeHg in mayflies is related to total
mercury (
S
Hg) concentration in sediment, and (iii) to assess
which contaminated areas on the Sudbury River have the
greatest potential for MeHg transfer from sediments into the
benthic food chain.
Methods
Experimental approach
Four 21-day bioaccumulation tests were conducted with nymphs of Hexagenia experimentally exposed in the laboratory to sedi-ments from the river basin. In 1994, bioaccumulation tests were conducted with sediments sampled from impoundments, flowing reaches, and a riverine lake during July (test 1) and September (test 2). In 1995, the bioaccumulation tests focused on wetland areas within the river floodplain, with sediments obtained in May (test 3) and September (test 4).
Microbial methylating activity in aquatic sediments follows an annual cycle that is closely linked to temperature, with peak MeHg production occurring during the warmest months (Ramlal et al. 1993). Our sediment sampling was done in May, July, and Septem-ber, months of active MeHg production (Ramlal et al. 1993). Each bioaccumulation test employed a randomized block experimental design; tests 1 and 2 included six replicates of six sediment treat-ments, whereas tests 3 and 4 had nine replicates of four sediment treatments.
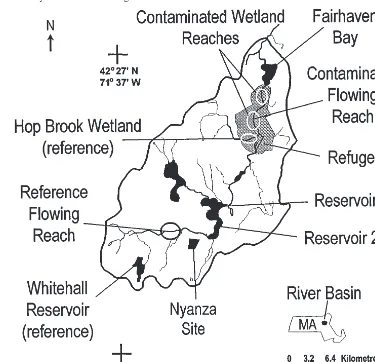
Test sediments
Sediments for the four tests were obtained from a total of nine study areas, with sediments from a given study area representing a treatment in our tests. In tests 1 and 2, sediments were obtained from four depositional areas and two free-flowing reaches in the Sudbury River basin (Fig. 1). Three of the depositional areas (Res-ervoir 1 (49 ha), Res(Res-ervoir 2 (47 ha), and Fairhaven Bay (27 ha)) were contaminated areas that spanned the mercury contamination gradient attributed to the Nyanza site (NUS Corporation 1992). The fourth depositional area, the Whitehall Reservoir (233 ha), was a reference area that had not been directly contaminated by wastes from the Nyanza site. The two free-flowing reaches included one
contaminated site (within the Great Meadows National Wildlife Refuge) and one upstream reference site that had not been directly contaminated by wastes from the Nyanza site.
Test sediments for tests 3 and 4 were obtained from four study areas, including two contaminated wetlands (both containing mer-cury from the Nyanza site), one reference wetland (Hop Brook wetland, not measurably contaminated by mercury from the Nyanza site), and one contaminated depositional area (Fairhaven Bay) (Fig. 1). Sediments from Fairhaven Bay were included in all four tests to facilitate comparison of test results between years. About 8% of the 427-km2Sudbury River watershed is covered by nonforested wetlands (NUS Corporation 1992). In particular, the reach about 20–35 km downstream from the Nyanza site contains an extensive floodplain and associated palustrine wetlands, lying within the 12-km2 Great Meadows National Wildlife Refuge. These wetlands have been classified as palustrine wetlands with scrub-shrub and persistent, emergent herbaceous plants (Harris 1996).
Within each area, sediment was obtained from randomly se-lected sampling sites, identified by latitude and longitude coordi-nates. The spatial randomization of sampling allowed extrapolation of test data from the sampled sites to the soft sediments within a defined study area. When sampling in wetland reaches, we first lo-cated the randomly selected position in the main channel of the stream and then randomly selected a sampling site in the adjoining floodplain within 10 m (in 1-m increments) of either the left or right stream bank.
Surficial sediments (uppermost 4–6 cm) for tests 1 and 2 were obtained with a Van Veen sampler, and sediments for test 3 were taken with an Ekman grab sampler (American Society for Testing and Materials 1992). During test 4, sediments in the three wetland areas were exposed due to drought-associated low water levels, and sampling of wetland sediments was done with a stainless steel spatula. In Fairhaven Bay, sediments for test 4 were taken with an Ekman sampler. Sediment for all tests was passed on site through a 2-mm Nalgene® sieve. Each sample was placed into a 1.9-L Nalgene®container with a screw top, held on ice in the field, and later stored at 10 ± 5°C for a maximum of 24 days before begin-ning a bioaccumulation test.
Test sediments were analyzed for texture (sieve-pipet method; Guy 1969; Plumb 1981) and for volatile matter content (loss on ig-nition at 550°C), a surrogate for organic matter content. Two tex-tural groups were delineated, sand (62–2000mm) and silt plus clay (<62mm). During tests 1 and 2, the physical characteristics of test sediment varied significantly among treatments (Table 1). In partic-ular, sediment from the Whitehall Reservoir had greater volatile matter content (about 60%) than sediment from the other treat-ments (range 14–25%). Seditreat-ments from five of the six study areas in tests 1 and 2 were primarily silt and clay (Table 1). The physical characteristics of sediments in tests 3 and 4 were less variable than those in tests 1 and 2 (Table 1). The mean textural composition of sediments from the Hop Brook wetland treatment differed from the that of other treatments in test 3 but not in test 4 (Table 1).
Bioaccumulation tests
The experimental unit in each 21-day bioaccumulation test was a 4-L glass beaker containing 725 mL of wet sediment from a given sampling site and 2900 mL of test water, providing a 4:1 (v/v) water to sediment ratio. During the allocation of test sediment to each beaker, a sample (>10 g wet weight) of the sediment added was placed into a 125-mL Nalgene®container. Samples of test sed-iment were stored in a freezer at –15°C or colder until analyzed for SHg.
Each beaker was covered with a 20-cm-diameter watch glass to reduce evaporation of test water. The 36 experimental units in each test were held within two 900-L water baths. A temperature of
© 2000 NRC Canada
Naimo et al. 1093
J:\cjfas\cjfas57\cjfas-05\F00-043.vp Friday, April 28, 2000 9:25:19 AM Color profile: Disabled
20 ± 2°C was maintained by a recirculation pump. Photoperiod was 16 h light : 8 h dark.
The overlying test water was soft, similar in hardness and pH to water from the Sudbury River. The test water was prepared by add-ing 36 mg NaHCO3·L–1, 7.5 mg CaSO
4·L–1, 7.5 mg MgSO4·L–1, and 0.009 mL 36 N H2SO4·L–1to deionized water. During the four tests, the test water before sediment addition had a mean pH of 6.9, a mean conductivity of 234mS·cm–1, a mean total alkalinity of 29.1 mg CaCO3·L–1, and a mean total hardness of 34.9 mg CaCO3·L–1. During each test, the overlying water in each beaker was gently aerated to maintain sufficient dissolved oxygen (>5 mg·L–1) for mayflies. Gaseous mercury (Hg0) was removed from the air supply with two gold-coated quartz sand traps (Fitz-gerald et al. 1991) placed in series in the air line delivering air to all beakers.
Hexagenia nymphs (almost entirely Hexagenia bilineata) were obtained with a Ponar dredge within 1 day before the start of each bioaccumulation test from Pool 8 of the Upper Mississippi River, an area with lowSHg concentrations in both sediment and resident Hexagenia (Beauvais et al. 1995). The mean initial (day 0) concen-trations (±1 SE) ofSHg and MeHg were 81 ± 8 ng·g dry weight–1 and 28 ± 10 ng Hg·g–1, respectively, based on analysis of three composite samples of 10 whole mayflies per bioaccumulation test.
Each mayfly was measured (total length) and transferred into a beaker with a spoon-shaped piece of Nitex® mesh attached to a glass rod. Fifteen nymphs, ranging from 10 to 19 mm in total length, were randomly allocated to each beaker 7–10 days after the test sediment and water had been placed into the beaker. Day 0 of a
given test was defined as the day on which mayflies were intro-duced into the beakers.
On day 21 of each test, about 100 mL of overlying water, to be an-alyzed for MeHg, was taken from each beaker by immersion of a 125-mL Teflon®-coated bottle. Water samples were stored at –15°C or colder until analyzed. Mayflies in each beaker were separated from the test sediment by passing the sediment through a 2-mm Nalgene®sieve. Mayflies retained on the sieve were removed with forceps, counted, and measured. Ten nymphs from each beaker were placed into a single 125-mL Nalgene®container to yield one composite sample to be analyzed forSHg and MeHg; these sam-ples were stored at –15°C or colder until analyzed. We were inter-ested in the trophic transfer of MeHg from sediments into the benthic food chain; therefore, we did not allow mayflies to depurate their gut contents before analysis (Hare et al. 1989).
Test water
taken from each beaker and analyzed for hardness, alkalinity, and conductivity. In tests 1 and 2, conductivity and hardness in the Whitehall Reservoir treatment were significantly lower than in the other five treatments, which did not differ. Conductivity also var-ied among treatments in tests 3 and 4 (Table 1). Mean alkalinity varied significantly among treatments in all four tests, with means for individual treatments ranging from 12 to 58 mg CaCO3·L–1. Total ammonia nitrogen and un-ionized ammonia nitrogen, deter-mined in water from one randomly selected beaker from each treat-ment, ranged from 0.05 to 1.20 mg·L–1and from 0.2 to 5.2mg·L–1, respectively, in the tests.
Diet and ration
To supply organic carbon to support microbial activity, each beaker was provided with dried, finely ground leaves of submersed aquatic plants. In tests 1 and 2, we used wild celery (Vallisneria americana) from Lake Onalaska (Pool 7, Upper Mississippi River) as a source of organic carbon. Curly pondweed (Potamogeton crispus) was used in tests 3 and 4 because wild celery was not yet available when test 3 was initiated. Fresh leaves were dried at 104°C for 72 ± 12 h, ground to a fine homogenate with a mortar and pestle, and stored in Nalgene® bottles in a desiccator. Begin-ning 2–3 days before day 0 of a test, 193 ± 5 mg dry weight of curly pondweed or 228 ± 5 mg dry weight of wild celery was added to each beaker every third day. These rates of wild celery and curly pondweed addition equated to a mean daily loading rate of organic carbon of about 100 mmol per square metre of sediment surface in our beakers, a typical value for mesotrophic freshwater ecosystems (C.A. Kelly, Department of Microbiology, University of Manitoba, Winnipeg, MB R3T 2N2, Canada, and J.W.M. Rudd,
Department of Fisheries and Oceans, Freshwater Institute, 501 University Crescent, Winnipeg, MB R3T 2N6, Canada, personal communication). Concentrations of MeHg in a subsample of the plant homogenate were 5.1, 1.1, 5.3, and 4.2 ng Hg·g dry weight–1 in tests 1, 2, 3, and 4, respectively.
During test 3, we evaluated the potential effect of the change in plant species on test results by placing sediment from a given site into two separate beakers and adding pondweed to one beaker and wild celery to the other. This evaluation was done with sediments from one sampling site in each of two sediment treatments (a con-taminated wetland and a riverine lake). Test results were not mea-surably affected by the difference in plant species used as a source of carbon. At the end of test 3, the MeHg concentration in over-lying water from beakers with sediment from the contaminated wetland was 11.8 ng Hg·L–1in the beaker provided wild celery and 13.8 ng Hg·L–1in the beaker provided curly pondweed. The MeHg concentration in overlying water from beakers with sediment from the riverine lake was 0.7 ng Hg·L–1 in the beaker provided wild celery and 1.0 ng Hg·L–1in the beaker provided curly pondweed.
Mercury determinations
For determinations ofSHg, 1.0-g samples of sediment and 0.1-g aliquots of the mayfly composites were digested in refluxing 7:3 HN03–H2S04(Bloom and Crecelius 1987) and analyzed by SnCl2 reduction, dual gold amalgamation, and atomic fluorescence detec-tion (Bloom and Crecelius 1983; Bloom and Fitzgerald 1988). For determination of MeHg in mayflies, 0.1-g samples were digested in 25% KOH in methanol (Bloom 1989, 1992), and aliquots were analyzed by aqueous-phase ethylation (Bloom 1989), carbotrap collection, isothermal gas chromatographic separation (Liang et al.
© 2000 NRC Canada
Naimo et al. 1095
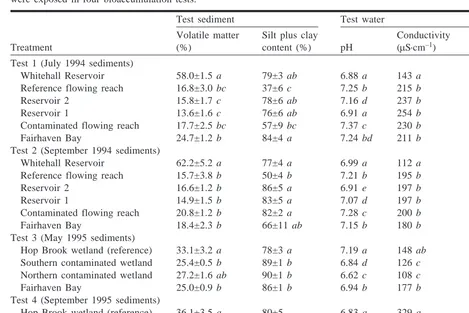
Test sediment Test water
Treatment
Volatile matter (%)
Silt plus clay content (%) pH
Conductivity (mS·cm–1)
Hardness (mg CaCO3·L–1)
Test 1 (July 1994 sediments)
Whitehall Reservoir 58.0±1.5 a 79±3 ab 6.88 a 143 a 11.6 a
Reference flowing reach 16.8±3.0 bc 37±6 c 7.25 b 215 b 33.9 b
Reservoir 2 15.8±1.7 c 78±6 ab 7.16 d 237 b 33.5 b
Reservoir 1 13.6±1.6 c 76±6 ab 6.91 a 254 b 43.7 b
Contaminated flowing reach 17.7±2.5 bc 57±9 bc 7.37 c 230 b 42.6 b
Fairhaven Bay 24.7±1.2 b 84±4 a 7.24 bd 211 b 36.9 b
Test 2 (September 1994 sediments)
Whitehall Reservoir 62.2±5.2 a 77±4 a 6.99 a 112 a 10.3 a
Reference flowing reach 15.7±3.8 b 50±4 b 7.21 b 195 b 37.2 b
Reservoir 2 16.6±1.2 b 86±5 a 6.91 e 197 b 28.6 b
Reservoir 1 14.9±1.5 b 83±5 a 7.07 d 197 b 30.3 b
Contaminated flowing reach 20.8±1.2 b 82±2 a 7.28 c 200 b 42.4 b
Fairhaven Bay 18.4±2.3 b 66±11 ab 7.15 b 180 b 34.9 b
Test 3 (May 1995 sediments)
Hop Brook wetland (reference) 33.1±3.2 a 78±3 a 7.19 a 148 ab 26.4 a
Southern contaminated wetland 25.4±0.5 b 89±1 b 6.84 d 126 c 16.7 b
Northern contaminated wetland 27.2±1.6 ab 90±1 b 6.62 c 108 c 13.1 b
Fairhaven Bay 25.0±0.9 b 86±1 b 6.94 b 177 b 40.0 a
Test 4 (September 1995 sediments)
Hop Brook wetland (reference) 36.1±3.5 a 80±5 6.83 a 329 a 78.5
Southern contaminated wetland 26.2±1.7 ab 90±1 6.50 d 214 ac 37.9
Northern contaminated wetland 27.2±2.4 ab 91±1 5.93 c 301 ac 41.0
Fairhaven Bay 21.7±3.5 b 63±10 7.18 b 201 bc 48.0
Note: Means for a given variable and test that are not accompanied by a common letter were significantly different (Tukey’s HSD procedure,a= 0.05). Treatments (sediment source) for each test are listed in longitudinal sequence from upstream to downstream. Table 1. Mean (±1 SE) values for selected characteristics of test sediment and test water to which Hexagenia mayflies were exposed in four bioaccumulation tests.
J:\cjfas\cjfas57\cjfas-05\F00-043.vp Friday, April 28, 2000 9:25:22 AM Color profile: Disabled
1994), and atomic fluorescence detection. Water samples (35 mL) were pre-separated by distillation (Horvat et al. 1993; Bloom and Von Der Geest 1995) before analysis for MeHg by the ethylation technique.
An aliquot of each sample of sediment and mayflies was ana-lyzed for percent dry solids. The dry fraction was determined gravimetrically after drying overnight in an oven at 105 ± 5°C. Mercury concentrations in sediment and mayflies were reported on a dry weight basis.
Quality assurance
All samples were handled according to chain-of-custody proce-dures. All glassware, plasticware, and tubing used in the bio-accumulation tests was acid washed (10% HNO3for 24 h) before use. Precision (relative standard deviation) during volatile matter and particle size determinations on sediment and during determina-tions of total alkalinity, total hardness, and conductivity in water (day 21) was estimated from triplicate analyses of 10% or more of the samples analyzed. Relative standard deviations were 0–15% for total alkalinity, 0–11% for total hardness, 0–3% for conductivity, 0.1–5% for volatile matter, 2–44% for percent sand, and 0.3–1% for percent silt plus clay (data from all four bioaccumulation tests combined).
During the determination ofSHg and MeHg in mayflies, water, and sediment, we analyzed one method blank, appropriate certified reference materials, analytical duplicates, and blind duplicates per 20 samples analyzed. Concentrations ofSHg and MeHg in certified reference materials (dogfish muscle (DORM-2) and marine sedi-ment (PACS-1)) were within the certified ranges, whereas our mean concentration of 78.7 ± 2.9 ng·g dry weight–1 forSHg in estuarine sediment (NIST-1646) slightly exceeded the certified range of 63 ± 11 ng·g dry weight–1. Estimated method detection limits were 0.053 ng Hg·L–1 for MeHg in water, 0.44 ng·g wet weight–1forSHg in sediment, 3.5 ng Hg·g wet weight–1for MeHg in mayflies, and 1.8 ng·g wet weight–1forSHg in mayflies. Mean (±1 SD) matrix-spike percent recoveries were 97 ± 13 for MeHg in water, 105 ± 14 forSHg in sediment, 109 ± 15 for MeHg in may-flies, and 97 ± 11 forSHg in mayflies. The mean relative percent difference between duplicate samples ranged from 4 to 25%.
Statistical analyses
Mercury concentrations in sediment, water, and mayflies were tested for normality and homogeneity of variance. The data were not normally distributed and had inequality of variances; thus, all subsequent analyses were performed on rank-transformed data. For each bioaccumulation test, variation in mean concentrations ofSHg or MeHg in sediment, mayflies, and water among treatments was compared by one-way analysis of variance. Tukey’s HSD multiple range test was performed to compare treatment means when the analysis of variance was significant. The mean net MeHg accumu-lation (nanograms per mayfly) in each experimental unit was cal-culated as the mean final MeHg burden minus the mean initial burden. Estimates of mayfly dry weights used in this calculation were predicted from regression of total length (millimetres) and dry weight (milligrams) of Hexagenia mayflies sampled during 1994 and 1995 in the Upper Mississippi River (log dry weight = –2.666 + 2.849(log total length); r2= 0.80, n = 633). A Type I er-ror of 0.05 was used to judge the significance of all statistical tests.
Results
Mercury in sediment, water, and mayflies
Mean concentrations of
S
Hg in test sediments varied more
than 100-fold among the six treatments in both test 1 and
test 2 (Table 2). Mean concentrations in sediments ranged
from 90 to 272 ng·g dry weight
–1in the reference areas,
from 880 to 1920 ng·g
–1in the contaminated flowing reach
and Fairhaven Bay, and from 7548 to 22 059 ng·g
–1in
Res-ervoirs 1 and 2. In contrast, mean concentrations of MeHg in
water at the end of tests 1 and 2 (all treatments) varied only
10-fold (Table 2). In general, concentrations of MeHg in test
water were lowest in the reference flowing reach,
intermedi-ate in Fairhaven Bay, the contaminintermedi-ated flowing reach, and
Reservoir 1, and highest in Reservoir 2.
Mayflies
exposed
to
sediments
from
mercury-contaminated sites accumulated more MeHg than did
may-flies exposed to reference sediments (Table 2).
Concentra-tions of MeHg in mayflies exposed to sediments from the
four contaminated areas were two (test 2) to three (test 1)
times those in mayflies exposed to sediments from the two
reference areas. In mayflies, the fraction of
S
Hg present as
MeHg ranged from 1.2 to 28.5%, with the highest percent
MeHg occurring in mayflies exposed to sediment from the
reference areas (Table 2).
In tests 3 and 4, mean concentrations of
S
Hg in sediments
varied about 10-fold among the four treatments, ranging
from 186 to 261 ng·g
–1in the reference wetland and from
1200 to 2562 ng·g
–1in the two contaminated wetland areas
and Fairhaven Bay (Table 2). MeHg concentrations in test
wa-ter varied considerably among treatments at the end of tests 3
and 4 (Table 2). In both tests, waterborne concentrations of
MeHg were much greater in treatments with contaminated
wetland sediments (8–47 ng Hg·L
–1) than in the treatment
with reference wetland sediments (0.9–2.1 ng Hg·L
–1).
Mean concentrations of MeHg in mayflies at the end of
tests 3 and 4 ranged from 122 to 184 ng Hg·g
–1in treatments
with contaminated wetland sediments, whereas
concentra-tions in mayflies exposed to reference wetland sediments
av-eraged about 36 ng Hg·g
–1. The fraction of
S
Hg present as
MeHg ranged from 11 to 41%; the highest percentage was in
mayflies exposed to sediments from the reference wetland
(Table 2). Net MeHg accumulation was significantly greater
in mayflies exposed to mercury-contaminated wetland
ments than in mayflies exposed to reference wetland
sedi-ment (Table 2).
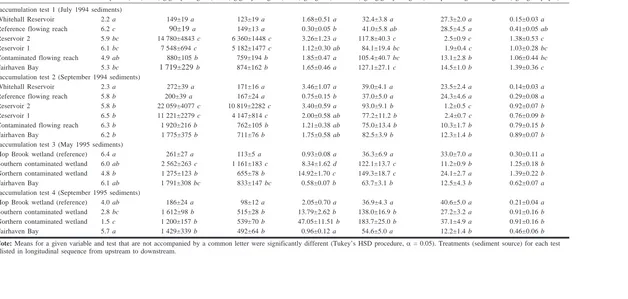
When data from all four bioaccumulation tests were
com-bined, there was a significant, positive correlation between
the concentration of
S
Hg in mayflies and that in test
sedi-ment (Fig. 2). In general, concentrations of
S
Hg in mayflies
were less than those in sediments. However, the net amount
of MeHg accumulated in mayflies was not correlated with
the concentration of
S
Hg in sediments (Spearman
correla-tion, r
s= 0.54, p = 0.32).
Mayfly growth and survival
The survival of Hexagenia in the four bioaccumulation
tests was unrelated to the concentration of
S
Hg in test
sedi-ment. The overall survival of Hexagenia mayflies ranged
from 90% in test 3 to 96% in test 2. The mean survival of
nymphs did not vary among treatments in any test (p
³
0.38
in all tests).
©
2000
NRC
Canada
Naimo
et
al.
1097
Treatment
Growth of mayflies (mm)
SHg in sediment (ng·g dry weight–1)
SHg in mayflies (ng·g dry weight–1)
MeHg in water (ng Hg·L–1)
MeHg in mayflies (ng Hg·g dry weight–1)
MeHg as mean percentage ofSHg
MeHg accumulation (ng Hg·mayfly–1) Bioaccumulation test 1 (July 1994 sediments)
Whitehall Reservoir 2.2 a 149±19 a 123±19 a 1.68±0.51 a 32.4±3.8 a 27.3±2.0 a 0.15±0.03 a
Reference flowing reach 6.2 c 90±19a 149±13 a 0.30±0.05 b 41.0±5.8 ab 28.5±4.5 a 0.41±0.05 ab
Reservoir 2 5.9 bc 14 780±4843 c 6 360±1448 c 3.26±1.23 a 117.8±40.3 c 2.5±0.9 c 1.38±0.53 c
Reservoir 1 6.1 bc 7 548±694 c 5 182±1477 c 1.12±0.30 ab 84.1±19.4 bc 1.9±0.4 c 1.03±0.28 bc
Contaminated flowing reach 4.9 ab 880±105 b 759±194 b 1.85±0.47 a 105.4±40.7 bc 13.1±2.8 b 1.06±0.44 bc
Fairhaven Bay 5.3 bc 1 719±229b 874±162 b 1.65±0.46 a 127.1±27.1 c 14.5±1.0 b 1.39±0.36 c
Bioaccumulation test 2 (September 1994 sediments)
Whitehall Reservoir 2.3 a 272±39 a 171±16 a 3.46±1.07 a 39.0±4.1 a 23.5±2.4 a 0.14±0.03 a
Reference flowing reach 5.8 b 200±39 a 167±24 a 0.75±0.15 b 37.0±5.0 a 24.3±4.6 a 0.29±0.08 a
Reservoir 2 5.8 b 22 059±4077 c 10 819±2282 c 3.40±0.59 a 93.0±9.1 b 1.2±0.5 c 0.92±0.07 b
Reservoir 1 6.5 b 11 221±2279 c 4 147±814 c 2.00±0.58 ab 77.2±11.2 b 2.4±0.7 c 0.76±0.09 b
Contaminated flowing reach 6.3 b 1 920±216 b 762±105 b 1.21±0.38 ab 75.0±13.4 b 10.3±1.7 b 0.79±0.15 b
Fairhaven Bay 6.2 b 1 775±375 b 711±76 b 1.75±0.58 ab 82.5±3.9 b 12.3±1.4 b 0.89±0.07 b
Bioaccumulation test 3 (May 1995 sediments)
Hop Brook wetland (reference) 6.4 a 261±27 a 113±5 a 0.93±0.08 a 36.3±6.9 a 33.0±7.0 a 0.30±0.11 a Southern contaminated wetland 6.0 ab 2 562±263 c 1 161±183 c 8.34±1.62 d 122.1±13.7 c 11.2±0.9 b 1.25±0.18 b Northern contaminated wetland 4.8 b 1 275±123 b 655±78 b 14.92±1.70 c 149.3±18.7 c 24.1±2.7 a 1.39±0.22 b
Fairhaven Bay 6.1 ab 1 791±308 bc 833±147 bc 0.58±0.07 b 63.7±3.1 b 12.5±4.3 b 0.62±0.07 a
Bioaccumulation test 4 (September 1995 sediments)
Hop Brook wetland (reference) 4.0 ab 186±24 a 98±12 a 2.05±0.70 a 36.9±4.3 a 40.6±5.0 a 0.21±0.04 a Southern contaminated wetland 2.8 bc 1 612±98 b 515±28 b 13.79±2.62 b 138.0±16.9 b 27.2±3.2 a 0.91±0.16 b Northern contaminated wetland 1.5 c 1 200±157 b 539±70 b 47.05±11.51 b 183.7±25.0 b 37.1±4.9 a 0.91±0.16 b
Fairhaven Bay 5.7 a 1 429±339 b 492±64 b 0.96±0.12 a 54.6±5.0 a 12.2±1.4 b 0.46±0.06 b
Note: Means for a given variable and test that are not accompanied by a common letter were significantly different (Tukey’s HSD procedure,a= 0.05). Treatments (sediment source) for each test are listed in longitudinal sequence from upstream to downstream.
Table 2. Mean growth of Hexagenia mayflies and mean (±1 SE)SHg in test sediment and mayflies, MeHg in test water and mayflies, percentage ofSHg present as MeHg, and net MeHg accumulation in mayflies exposed to sediments from the Sudbury River basin in 21-day bioaccumulation tests.
J:\cjfas\cjfas57\cjfas-05\F00-043.vp
treatments in test 2 (Table 2). In tests 3 and 4, the growth of
Hexagenia varied among treatments and between tests. In
test 3, the mean growth of mayflies in the northern
contami-nated wetland treatment (4.8 mm) was significantly less than
that in the reference wetland treatment (Table 2). In test 4,
the growth of mayflies averaged 1.5 mm for the northern
contaminated wetland, 2.8 mm for the southern
contami-nated wetland, 4.0 mm for the reference wetland, and
5.7 mm for Fairhaven Bay (Table 2). The overall mean
growth of mayflies (all treatments combined) was greater in
test 3 (5.8 mm) than in test 4 (3.5 mm). Variation in the
growth of mayfly nymphs was seemingly unrelated to
mer-cury exposure, given that growth did not diminish with
in-creasing concentrations of MeHg in test water,
S
Hg in
sediment,
S
Hg in mayflies, or MeHg in mayflies (Fig. 3).
Discussion
The concentrations of
S
Hg in our test sediments far
ex-ceeded the estimated natural abundance of 40–50 ng·g dry
weight
–1(Frazier et al. 2000), confirming substantial
mer-cury contamination throughout the studied 34-km reach of
the Sudbury River. Test sediments from the three reference
areas had mercury concentrations ranging from two to five
times the estimated natural abundance, indicating the
pres-ence of anthropogenic mercury throughout the basin.
Con-centrations of
S
Hg in surficial sediments diminished, as
expected, with increasing distance downstream from the
Nyanza site (Fig. 4). The greatest concentrations of
S
Hg in
sediments in this study were in Reservoir 2, about 3 km
downstream from the Nyanza site. In sediments taken 25–
35 km downstream from the Nyanza site, the concentration
of mercury was roughly 10-fold higher than concentrations
in the reference flowing reach, upstream of the Nyanza site.
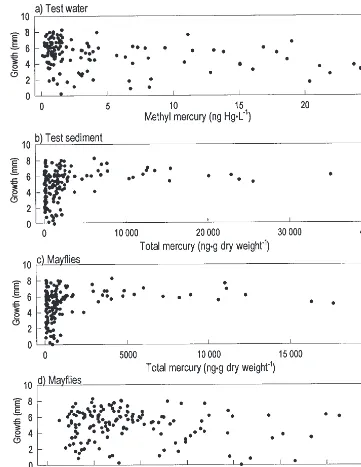
The growth of mayflies was unrelated to the
S
Hg
concen-tration in sediment. The slower growth of Hexagenia
ex-posed to sediments from Whitehall Reservoir (tests 1 and 2)
may have resulted from the physical characteristics of
sedi-ment, given that Whitehall Reservoir sediments contained
more volatile matter than other sediments (Table 1).
May-flies exposed to wetland sediment grew less in test 4 than in
test 3, probably because of differences in test conditions
re-lated to water levels in the wetlands when test sediments
were obtained. Wetland sediments for test 3 were obtained
from an inundated floodplain, whereas wetland sediments
for test 4 were not inundated, due to severe drought
condi-tions in the basin during the summer of 1995. Growth was
slowest in mayflies exposed to sediments taken from the
northern contaminated wetland in September 1995; this
treatment had the highest MeHg concentration and the
low-est pH (mean 5.9) in tlow-est water. This pH value is near the pH
threshold of 5.2–5.5 suggested by McNicol et al. (1995) as
the pH below which recolonization of lake sediments by
acid-sensitive invertebrate taxa is unlikely. We suspect that
the lower pH of our test waters in wetland treatments in test
4, relative to test 3, resulted from the release of hydrogen
ion during oxidation of sulfide in the air-exposed wetland
sediment (Yan et al. 1996; Anisfeld and Benoit 1997). In
contrast with the wetland areas studied, sediments from
Fair-haven Bay were inundated during sampling for tests 3 and 4,
and the growth of mayflies in the Fairhaven Bay treatment
did not differ between the two tests.
The concentration of
S
Hg was not a reliable indicator of
MeHg concentration in mayflies in our study. Neither the
concentration nor the burden of MeHg accumulated by
may-flies was correlated with the concentration of
S
Hg in the
sediment to which they were exposed. In addition, the
frac-tion of
S
Hg present as MeHg in exposed mayflies was
highly variable, ranging from 1 to 41% in our tests. The
MeHg to
S
Hg ratio in mayflies was greatest in nymphs
ex-posed to reference sediments and lowest in nymphs exex-posed
to the most contaminated sediments. These observations
re-inforce the importance of measuring MeHg in benthic
macro-invertebrates such as aquatic insects (Hall et al. 1998). In our
study, no inferences on MeHg contamination of
sediment-dwelling mayflies could be made from information on
con-centrations of
S
Hg in either sediment or mayflies.
The whole-body content of metals in benthic insects can
be influenced by ingested materials, such as sediment
parti-cles, in the gut (Hare et al. 1989; Cain et al. 1995). We
esti-mated the potential contribution of gut contents to the
whole-body burdens of
S
Hg and MeHg accumulated by
mayfly nymphs in our tests by assuming that the gut of a
Hexagenia contained 1.2 mg dry weight of ingested
sedi-ment, a value derived for individual Hexagenia rigida by
Odin et al. (1997). In mayflies exposed to sediments from
contaminated reaches, we estimated that from 13 to 52% of
the
S
Hg in the whole mayfly was contributed by gut
con-tents, with the remainder of the whole-body burden
contrib-uted by bioaccumulation and adsorption. In mayflies
exposed to reference sediments, we estimate that from 6 to
28% of the
S
Hg in the body was contributed by ingested
sediment in the gut. To assess the potential contribution of
ingested sediment to MeHg burdens in mayflies, we used
data from Colman et al. (1999) on maximum concentrations
of MeHg in surficial sediments from contaminated palustrine
wetlands along the Sudbury River. The gut of an individual
mayfly would have contained an estimated maximum of
0.02 ng of mercury present as MeHg. During our tests,
indi-vidual mayflies exposed to contaminated wetland sediments
Fig. 2. Relationship betweenSHg concentration in Hexageniaaccumulated between 0.91 and 1.39 ng of mercury as MeHg.
Our admittedly crude calculations indicate that very little, at
most perhaps 2%, of the MeHg in the whole body was
con-tributed by MeHg in ingested sediment present in the gut.
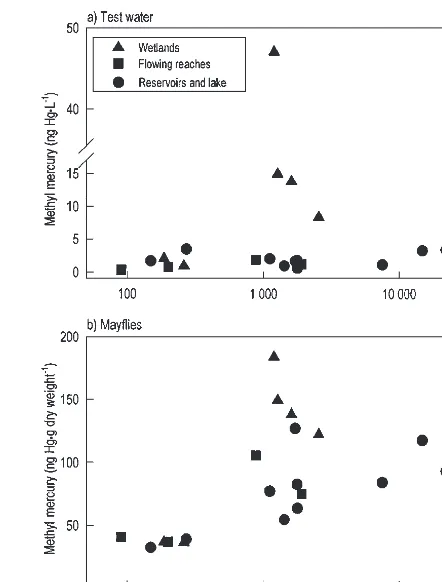
Comparison of MeHg in test water and mayflies with
S
Hg
in test sediments from the two highly contaminated
reser-voirs indicated that very little MeHg was produced from the
large sedimentary inventories of inorganic mercury at these
sites (Fig. 5). In contrast, our tests clearly showed that
MeHg, the form readily accumulated in fish and
biomagni-fied in aquatic food chains (Bloom 1992; Wiener and Spry
1996), was actively produced in surficial sediments from the
lesser contaminated wetlands (Fig. 5). Moreover, this MeHg
was available for uptake by detritus-feeding benthic
orgisms in the riverine food web. Colman et al. (1999), who
an-alyzed sediment cores from wetlands on the Sudbury River
floodplain, found that MeHg concentrations in both bulk
sediment and pore water were greatest in the uppermost
stra-tum of each core. Within this upper strastra-tum, concentrations
of MeHg ranged from about 6 to 22 ng Hg·g dry weight
–1in
bulk sediments (six cores) and from about 4.5 to 7.1 ng
Hg·L
–1in pore water (three cores). Moreover, MeHg was
present in the wetland sediments throughout the summer,
even when floodplain sediments were exposed to the
atmo-sphere (Colman et al. 1999).
Our results showing the importance of wetland sediments
as active sites of MeHg production agree with the results of
Waldron et al. (2000), who examined spatial trends in the
© 2000 NRC Canada
Naimo et al. 1099
Fig. 3. Growth of Hexagenia mayfly nymphs during all four 21-day bioaccumulation tests with sediments from the Sudbury River basin, with the increase in total length plotted against (a) MeHg in test water, (b)SHg in test sediments, (c)SHg in mayflies, and (d) MeHg in mayflies.
J:\cjfas\cjfas57\cjfas-05\F00-043.vp Friday, April 28, 2000 9:25:27 AM Color profile: Disabled
abundances of MeHg and
S
Hg in water from the Sudbury
River. MeHg production in wetlands has also been
docu-mented elsewhere, including boreal forest ecosystems in
Canada (St. Louis et al. 1994, 1996; Kelly et al. 1997) and
several watersheds in Wisconsin (Hurley et al. 1995;
Krabbenhoft et al. 1995). St. Louis et al. (1994), for
exam-ple, reported that MeHg yields from wetlands were 26–79
times greater than yields from purely upland catchment
ar-eas. In subsequent work, St. Louis et al. (1996) documented
that different types of wetlands (i.e., headwater wetlands,
riverine wetlands, valley-bottom wetlands) can function as
sources or sinks of MeHg and
S
Hg to downstream reaches,
depending on the percent wetland in a given catchment and
the annual water yield. Furthermore, yields of MeHg from
wetland areas can greatly exceed the inputs of MeHg in
at-mospheric deposition (Krabbenhoft et al. 1995).
The net production of MeHg in our treatments with
wet-land sediments may have been enhanced partly by low pH.
Several studies have shown that the net rate of microbial
production of MeHg (i.e., methylation minus demethylation)
in aquatic ecosystems increases in response to acidification
or lowered pH (Xun et al. 1987; Gilmour et al. 1992). The
northern contaminated wetland treatment had the lowest
mean pH and the highest mean MeHg in water (15 ng Hg·L
–1at pH 6.6 in test 3 and 47 ng Hg·L
–1at pH 5.9 in test 4)
measured in the present study. Moreover, mean
concentra-tions of MeHg in water in the three treatments with wetland
sediments were higher in test 4, which had lower pH in test
water, than in test 3.
Viewed longitudinally, the patterns of MeHg in
sediment-exposed mayflies and in river water (Waldron et al. 2000)
clearly did not correspond to the spatial gradient in
S
Hg
concentration in the surficial sediments (Fig. 4). MeHg
con-centrations peaked about 3–5 km downstream from the
Nyanza site, leveled off between 5 and 25 km downstream
from the Nyanza site, and peaked again in the contaminated
wetland reaches (Fig. 4). Moreover, the spatial trend in
MeHg concentrations in mayflies paralleled the spatial trend
in abundance of MeHg in water from the river (Waldron et
al. 2000). In their field study, Waldron et al. (2000) found
that MeHg concentrations in unfiltered river water were
highest in the reach just downstream from the Nyanza site
(0.19–0.29 ng Hg·L
–1), substantially lower at sampling
points between 5 and 25 km downstream from the Nyanza
site (0.11–0.15 ng Hg·L
–1), and higher in the wetland
reaches (0.19–0.23 ng Hg·L
–1).
Fish in natural waters obtain MeHg almost entirely
through the diet (Rodgers 1994; Wiener and Spry 1996; Hall
et al. 1997). Our estimates of net MeHg accumulation in
dividual mayfly nymphs consequently provide a relevant
in-dex of the potential transfer (flux) of MeHg from the
sediments into aquatic food webs. Mayflies accumulated
be-tween 0.14 and 1.4 ng of mercury (as MeHg) per nymph
during our 21-day bioaccumulation tests. Nymphs exposed
Fig. 4.SHg in test sediments (solid circles) and MeHg inHexagenia mayflies (open circles) as a function of distance downstream from the Nyanza site (combined data from all four bioaccumulation tests). Approximate downstream distances from the Nyanza site were as follows: Reservoir 2, 4 km; Reservoir 1, 6 km; contaminated flowing reach and contaminated wetland reaches, 25–31 km; Fairhaven Bay, 34 km. The three reference areas (Whitehall Reservoir, reference flowing reach, and Hop Brook wetland) were plotted as negative distance because all are upstream from or uninfluenced by the Nyanza site.
to mercury-contaminated sediments usually accumulated
considerably more MeHg than those exposed to reference
sediments. The potential significance of the
mercury-contaminated wetland areas as sources of MeHg in this
eco-system is increased by the tendency of wetland habitats to
ex-port waterborne MeHg to adjoining surface waters (Hurley et
al. 1995; St. Louis et al. 1996; Waldron et al. 2000).
In conclusion, mayfly nymphs accumulated significant
quantities of MeHg during 21-day exposures to
contami-nated
sediments
from
the
Sudbury
River.
Mercury-contaminated, surficial sediments from impoundments,
flow-ing reaches, and palustrine wetlands in the basin were not
toxic to burrowing mayflies, and the growth of mayflies was
unrelated to the concentration of
S
Hg in sediments.
Concen-trations of MeHg were greatest in mayflies and test water
exposed to sediment from contaminated wetland areas about
30 km or more downstream from the Nyanza site. The
pro-duction of MeHg and its potential entry into the benthic
food web in this ecosystem were greater in the contaminated
floodplain wetlands than in the more heavily contaminated
reservoirs nearer the Nyanza site.
Acknowledgments
This work was funded by the U.S. Environmental
Protec-tion Agency (Region I) through an interagency agreement
with the U.S. Fish and Wildlife Service (Region V). We
thank the staff of the Great Meadows National Wildlife
Ref-uge for use of their facility during sampling trips. The
assis-tance of Pamela Shields (U.S. Environmental Protection
Agency), Susan Svirsky (U.S. Environmental Protection
Agency), and Steven Mierzykowski (U.S. Fish and Wildlife
Service) during planning of the study is gratefully
acknowl-edged. Assistance in the field and (or) laboratory was
pro-vided by Lori Bliss, Erika Damschen, Martin Deters,
Bradley Frazier, Michael Oetker, Peter Rust, and Kimberly
Skroch. We thank John Besser, Britt Hall, James Hurley,
Efrosini Tsalkitzis, and two anonymous reviewers for
help-ful comments on earlier drafts of the manuscript.
References
American Society for Testing and Materials. 1992. Annual book of ASTM standards. Vol. 11.04. Water and environmental technol-ogy. Standard Guide E 1391-90. Collection, storage, character-ization, and manipulation of sediments for toxicological testing. American Society for Testing and Materials, Philadelphia, Pa. Anisfeld, S.C., and Benoit, G. 1997. Impacts of flow restrictions on
salt marshes: an instance of acidification. Environ. Sci. Technol. 31: 1650–1657.
Beauvais, S.L., Wiener, J.G., and Atchison, G.J. 1995. Cadmium and mercury in sediment and burrowing mayfly nymphs (Hexagenia) in the Upper Mississippi River, U.S.A. Arch. Environ. Contam. Toxicol. 28: 178–183.
Bloom, N.S. 1989. Determination of picrogram levels of methyl-mercury by aqueous phase ethylation, followed by cryogenic gas chromatography with cold vapour atomic fluorescence detec-tion. Can. J. Fish. Aquat. Sci. 46: 1131–1140.
Bloom, N.S. 1992. On the chemical form of mercury in edible fish and marine invertebrate tissue. Can. J. Fish. Aquat. Sci. 49: 1010–1017.
Bloom, N.S., and Crecelius, E.A. 1983. Determination of mercury in seawater at sub-nanogram per liter levels. Mar. Chem. 14: 49–59. Bloom, N.S., and Crecelius, E.A. 1987. Distribution of silver,
mer-cury, lead, copper, and cadmium in central Puget Sound sedi-ments. Mar. Chem. 21: 377–390.
Bloom, N.S., and Fitzgerald, W.F. 1988. Determination of volatile mercury species at the picogram level by low temperature gas chromatography with cold vapor atomic fluorescence detection. Anal. Chim. Acta, 208: 151–161.
Bloom, N.S., and Von Der Geest, E.J. 1995. Matrix modification to improve the recovery of MMHg from clear water using distilla-tion. Water Air Soil Pollut. 80: 1319–1323.
Cain, D.J., Luoma, S.N., and Axtmann, E.V. 1995. Influence of gut content in immature aquatic insects on assessments of environmen-tal meenvironmen-tal contamination. Can. J. Fish. Aquat. Sci. 52: 2736–2746. Colman, J.A., Waldron, M.C., Breault, R.F., and Lent, R.M. 1999. Distribution and transport of total mercury and methylmercury in mercury-contaminated sediments in reservoirs and wetlands of the Sudbury River, east-central Massachusetts. U.S. Geol. Surv. Water-Resour. Invest. Rep. 99-4060.
Fitzgerald, W.F., Mason, R.P., and Vandal, G.M. 1991. Atmospheric cycling and air–water exchange of mercury over mid-continental lacustrine regions. Water Air Soil Pollut. 56: 745–767.
Frazier, B.E., Wiener, J.G., Rada, R.G., and Engstrom, D.R. 2000. Stratigraphy and historic accumulation of mercury in recent depositional sediments in the Sudbury River, Massachusetts, U.S.A. Can. J. Fish. Aquat. Sci. 57: 1062–1072.
Gilmour, C.C., Henry, E.A., and Mitchell, R. 1992. Sulfate stimu-lation of mercury methystimu-lation in freshwater sediments. Environ. Sci. Technol. 26: 2281–2287.
Guy, H.P. 1969. Laboratory theory and methods for sediment anal-ysis. Techniques of water resources investigations. Book 5, Chap. C1. U.S. Geological Survey, Washington, D.C.
Hall, B.D., Bodaly, R.A., Fudge, R.J.P., Rudd, J.W.M., and Rosenberg, D.M. 1997. Food as the dominant pathway of methylmercury uptake by fish. Water Air Soil Pollut. 100: 13–24. Hall, B.D., Rosenberg, D.M., and Wiens, A.P. 1998. Methyl
mer-cury in aquatic insects from an experimental reservoir. Can. J. Fish. Aquat. Sci. 55: 2036–2047.
Hare, L., Campbell, P.G.C., Tessier, A., and Belzile, N. 1989. Gut sediments in a burrowing mayfly (Ephemeroptera, Hexagenia limbata): their contribution to animal trace element burdens, their removal, and the efficacy of a correction for their presence. Can. J. Fish. Aquat. Sci. 46: 451–456.
Harris, S.L. 1996. Massachusetts wetland resources. In National water summary on wetland resources. U.S. Geol. Surv. Water-Supply Pap. 2425. pp. 225–230.
Horvat, M., Liang, L., and Bloom, N.S. 1993. Comparison of dis-tillation with other current isolation methods for the determina-tion of methyl mercury-compounds in low-level environmental samples. 2. Water. Anal. Chim. Acta, 282: 153–168.
Hurley, J.P., Benoit, J.M., Babiarz, C.L., Shafer, M.M., Andren, A.W., Sullivan, J.R., Hammond, R., and Webb, D.A. 1995. In-fluences of watershed characteristics on mercury levels in Wis-consin rivers. Environ. Sci. Technol. 29: 1867–1875.
Kelly, C.A., Rudd, J.W.M., Bodaly, R.A., Roulet, N.P., St. Louis, V.L., Heyes, A., Moore, T.R., Schiff, S., Aravena, R., Scott, K.J., Dyck, B., Harris, R., Warner, B., and Edwards, G. 1997. Increases in fluxes of greenhouse gases and methyl mercury fol-lowing flooding of an experimental reservoir. Environ. Sci. Technol. 31: 1334–1344.
Krabbenhoft, D.P., Benoit, J.M., Babiarz, C.L., Hurley, J.P., and Andren, A.W. 1995. Mercury cycling in the Allequash Creek wa-tershed, northern Wisconsin. Water Air Soil Pollut. 80: 425–433.
© 2000 NRC Canada
Naimo et al. 1101
J:\cjfas\cjfas57\cjfas-05\F00-043.vp Friday, April 28, 2000 9:25:31 AM Color profile: Disabled
Liang, L., Bloom, N.S., and Horvat, M. 1994. Simultaneous deter-mination of mercury speciation in biological materials by GC/CVAFS after ethylation and room temperature precollection. Clin. Chem. 40: 602–607.
McNicol, D.K., Bendell, B.E., and Mallory, M.L. 1995. Evaluating macroinvertebrate responses to recovery from acidification in small lakes in Ontario, Canada. Water Air Soil Pollut. 85: 451–456. NUS Corporation. 1992. Final remedial investigation report. Nyanza
Operable Unit III, Sudbury River study, Middlesex County, Mas-sachusetts. Vol. 1. NUS Rep. W92194F. NUS Corporation, Wil-mington, Mass.
Odin, M., Feurtet-Mazel, A., Ribeyre, F., and Boudou, A. 1994. Actions and interactions of temperature, pH, and photoperiod on mercury bioaccumulation by nymphs of the burrowing mayfly Hexagenia rigida, from the sediment contamination source. En-viron. Toxicol. Chem. 13: 1291–1302.
Odin, M., Ribeyre, F., and Boudou, A. 1995. Cadmium and methylmercury bioaccumulation by nymphs of the burrowing mayfly Hexagenia rigida from the water column and sediment. Environ. Sci. Pollut. Res. 2: 145–152.
Odin, M., Ribeyre, F., and Boudou, A. 1997. Depuration processes after exposure of burrowing mayfly nymphs (Hexagenia rigida) to methylmercury and cadmium from water column or sediment: effects of temperature and pH. Aquat. Toxicol. 37: 125–137. Plumb, R.H., Jr. 1981. Procedures for handling and chemical
anal-ysis of sediment and water samples. Tech. Rep. EPA/CE-81-1. U.S. Environmental Protection Agency and U.S. Army Corps of Engineers, Technical Committee on Criteria for Dredged and Fill Material, Vicksburg, Miss.
Ramlal, P.S., Kelly, C.A., Rudd, J.W.M., and Furutani, A. 1993. Sites of methyl mercury production in remote Canadian Shield lakes. Can. J. Fish. Aquat. Sci. 50: 972–979.
Rodgers, D.W. 1994. You are what you eat and a little bit more: bioenergetics-based models of methylmercury accumulation in fish revisited. In Mercury pollution: integration and synthesis. Edited by C.J. Watras and J.W. Huckabee. Lewis Publishers, Boca Raton, Fla. pp. 427–439.
Rudd, J.W.M. 1995. Sources of methyl mercury to freshwater eco-systems: a review. Water Air Soil Pollut. 80: 697–713.
Saouter, E., Ribeyre, F., Boudou, A., and Maury-Brachet, R. 1991. Hexagenia rigida (Ephemeroptera) as a biological model in aquatic ecotoxicology: experimental studies on mercury trans-fers from sediment. Environ. Pollut. 69: 51–67.
Saouter, E., Hare, L., Campbell, P.G.C., Boudou, A., and Ribeyre, F. 1993. Mercury accumulation in the burrowing mayfly Hexa-genia rigida (Ephemeroptera) exposed to CH3HgCl or HgCl2in water and sediment. Water Res. 27: 1041–1048.
St. Louis, V.L., Rudd, J.W.M., Kelly, C.A., Beaty, K.G., Bloom, N.S., and Flett, R.J. 1994. Importance of wetlands as sources of methyl mercury to boreal forest ecosystems. Can. J. Fish. Aquat. Sci. 51: 1065–1076.
St. Louis, V.L., Rudd, J.W.M., Kelly, C.A., Beaty, K.G., Flett, R.J., and Roulet, N.T. 1996. Production and loss of methylmercury and loss of total mercury from boreal forest catchments containing dif-ferent types of wetlands. Environ. Sci. Technol. 30: 2719–2729. Waldron, M.C., Colman, J.A., and Breault, R.F. 2000. Distribution,
hydrologic transport, and cycling of total mercury and methyl mercury in a contaminated river–reservoir–wetland system (Sudbury River, eastern Massachusetts). Can. J. Fish. Aquat. Sci. 57: 1080–1091.
Wiener, J.G., and Shields, P.J. 2000. Mercury in the Sudbury River (Massachusetts, U.S.A.): pollution history and a synthesis of re-cent research. Can. J. Fish. Aquat. Sci. 57: 1053–1061. Wiener, J.G., and Spry, D.J. 1996. Toxicological significance of
mercury in freshwater fish. In Environmental contaminants in wildlife: interpreting tissue concentrations. Edited by W.N. Beyer, G.H. Heinz, and A.W. Redmon-Norwood. Special Publi-cation of the Society of Environmental Toxicology and Chemis-try. Lewis Publishers, Boca Raton, Fla. pp. 297–339.
Xun, L., Campbell, N.E.R., and Rudd, J.W.M. 1987. Measurements of specific rates of net methyl mercury production in the water column and surface sediments of acidified and circumneutral lakes. Can. J. Fish. Aquat. Sci. 44: 750–757.