EVALUATION ON THE APPLICATION OF LIFE
CYCLE MATRIX (LCM) IN FORECASTING
HOUSING NEEDS AND HOUSING DEMAND IN
DEVELOPED AND DEVELOPING COUNTRIES
Ho Chin Siong1 and Lim Seng Boon2
1Professor at Faculty of Built Environment, Universiti Teknologi Malaysia 2Graduate student, Faculty of Built Environment, Universiti Teknologi Malaysia
ABSTRACT: The accuracy of forecasting of housing needs and demand is crucial to the preparation of development plan because residential land constitutes a greater share of the developed area of cities. Presently, many common methods are based on aggregate method, headship rates, household size, backlog and other accounting methods. Many of these methods have their strengths and weaknesses contributed by the assumptions and ‘intelligent guesses’ used in the calculations. This paper aims to explore alternative method of forecasting housing needs and demand by using Life Cycle Matrix. As a household undergoes change of stages in family life cycle, one’s housing needs and demand are experiencing gradual change. Therefore, it is essential to consider the life cycle change of a household in the analysis and forecasting of housing needs and demands. Life Cycle Matrix was initiated in Japan in 1980s to estimate housing needs based on population cohort and household distribution pattern. Comparative analysis using LCM is also being carried out in developed countries (Japan and United Kingdom) and developing countries (Philippines and Malaysia).
Keywords: Life Cycle Matrix, Housing Needs Analysis, Life Cycle Change Pattern, Japan, United Kingdom, Philippines
Introduction
Housing is a complex outcome of cultural, economic and regulatory environment (Tiwari, 2000). As a household undergoes change of stages in family life cycle, one’s housing needs and demand are experiencing gradual change. Therefore, it is essential to consider the life cycle change of a household in the analysis and forecasting of housing needs and demands1 (Yee 2002; Watkins, 2001, Lim, 2001, 2003; Tani, 1998; Ho,1994; Feitelson, 1993; Maclennan, 1992).
The differences �etween housing needs and housing demand are that housing demand takes intodifferences �etween housing needs and housing demand are that housing demand takes into that housing demand takes into
The purpose of this paper is to focus on exploring an empirical method for assessing housing needs and three cases are �eing compared, namely Japan, United Kingdom and Philippines. However, due to availa�ility of data, Japan is chosen as the main study case and its life cycle change and population structure will �e discussed in detail. The authors found that there is a typical life cycle change pattern, which existed among developed and developing countries. Beside development status, time period is also another factor, which contri�utes to the changing pattern. By analysing the life cycle change pattern, the authors could easily forecast the future housing needs of a population.
One of the importance of this paper is to present an alternative method of housing needs and demand analysis �ecause of the recent failure of effective housing planning has resulted to massive housing oversupply in Malaysia.( Alias 2007) This method which may require more aggregate and detail demographic data, �ut it will help to provide a �etter understanding of housing demand �y population cohort and a�le to guide housing developers or housing planners at local authority to match their supply with the demand.
The Concept of Life Cycle Matrix (LCM)
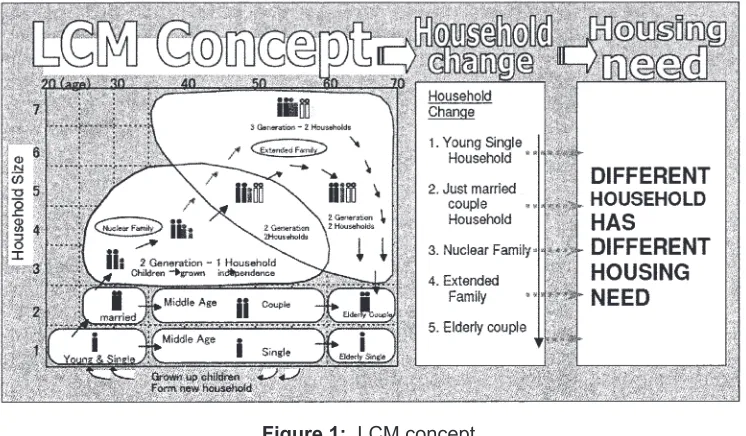
Life Cycle Matrix (LCM) commonly refers to cross ta�ulation matrix �etween the household head’s age and the size of household. A cell of matrix shows a group of household with similar age and household size. Housing needs of a household in each cell are �ased on the criteria of household size and age cohort. Therefore, if the distri�ution of the households in LCM shift, the housing needs for those population will also change.
2 The num�er of categories vary and depend on census data, country’s development and economic’s development and economics development and economic
Figure 1: LCM concept
In the case of LCM of Japan, the life cycle is divided into twelve (12) cohorts2 with interval of 5 years i.e., less than 25 years old, 25-29, 30-34, 35-39, 40-44, 45-50, 50-54, 55-59, 60-64, 65-69, 70-74, and more than 74 years old. The household size is again divided into 7 categories, 1 person, 2, 3, 4, 5, 6, and more than 6 persons per household. It forms a 12x7 matrix of households size with age cohorts. LCM helps to understand the housing need �ased on the demographic age cohort factor �y identifying the su� markets.
The four (4) main components involved in this forecasting process are population structure, household head structure �y age cohort, household size �y cells of LCM, and housing tenure in each cell of LCM. In this process, household headship ratio and the percentage of household size �y age cohort series will �ecome the main parameters of LCM (for detailed explanation, please refer to section 6).
Application of LCM In Japan
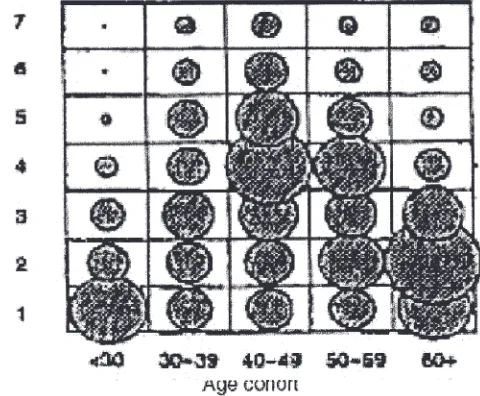
Normally, there are three (3) different types of LCM pattern, namely �y ‘real number’
Real num�er LCM is used for comparing the changing size of household to age cohort according to time series. For example, in Figure 3a, LCM of Japan in 1968 shows a concentration of 4 persons per principle household3 in age cohorts of 30-34, 35-39 and 40-44 years old. This pattern changed in 1998, which showed a higher num�er of single household in young age cohort of less than 25 years old (1.7 millions). Presently there is a trend where younger generation tends to stay single and more independent. Another o�served phenomenon is the increasing num�er of elderly couple and single. Those middle age (30-44 years old) households have changed gradually to smaller size. From this changing pattern, one will notice that elderly couples or singles, and young singles will continue to grow and thus, necessary efforts on providing small size housing or property policy should �e given priority.
In ‘ratio total’ LCM, each cell of real num�er is divided �y total num�er household in the same cohort. This can �e done �y summing up each cell to o�tain a total - Ni, and
then each total of the cell will be divided by this cell sum (∑ Ti). This type of LCM pattern shows a percentage distri�ution of each cell. Figure 3� shows higher percentage of cells happened in different time period and different age cohort: in 1968, 35-39 years old with 4 persons; �ut in 1998: elderly couple and single group. This morphology of change shows that Japan is moving towards an aging society with smaller household (1 to 3 persons).
The third LCM pattern - ‘ratio cohort’ pattern as shown in Figure 3, is �ased on a percentage of each cell against each cohort. The purpose of this ‘ratio cohort’ pattern is to understand the changing percentage and therefore facilitates the projection of real num�er. Different from ‘ratio total’, in 1968, high percentage of 30-44 years old households with 4 persons did not appear. It was due to distri�ution into other household size of 3 or 5 persons. Extended family is common in 1968 �ut slowly disappearing in today’s Japanese society. This shows a trend that in developed country, such as Japan, the preference of higher household privacy and social independent is �ecoming more important. Besides, highest percentage of young single (a�out 80%) and elderly
3According to 1998 Housing and Land Survey of Japan, if a household occupied an entire dwelling, the
couple (more than 64 years old) is clearly shown in 1998 ‘ratio cohort’ pattern. This pattern remains dominant �oth in ‘real num�er’ or ‘ratio total’.
Empirical Cases - LCM Pattern In Developed And Developing Countries
In order to evaluate the use of the LCM in developed and developing countries, Japan and United Kingdom are chosen as cases for developed nations whilst Malaysia and Philippines are chosen as cases for developing countries.
Source: Housing and Land Survey, Japan, 1993
Figure 4a: Japan LCM year 1993
Source: General Household Survey, London, 1991
Source: Census of Population and Housing, Philippines, 1990
Figure 4c:c:: Philippines LCM year 1990Philippines LCM year 1990 LCM year 19900
Figure 4a and Figure 4� of Japan and United Kingdom (UK) has similar LCM pattern, which show smaller household size (4 person and �elow) and high percentage of elderly people (aging society).
According to 1998 national housing survey, Japan has reached 44 millions households, and its household size has decreased from 4.77 to 2.80 persons per household over the period of 40 years (1958-1998). Figure 5 shows the comparison of household size, dwelling unit and population. On the other hand, with low growth rate of 0.2%, the latest census year 2000 shows a higher percentage of elderly persons (17.3% of elderly persons from the total of 127 millions people), increased 11.6% in the past 40 years period (5.7% of elderly persons in 1960).
Study in UK �ased on data shows a rapid increase of household as compared with the population. For instance, the population increased in 1961 to 1991 was only 8% as compared to 35% increased in household num�er. In 1902, the average household size in England and Wales was 4.6 persons; in 1939, 3.5; in 1961, 3.1; and in 1991, 2.5 persons per household.
while married or coha�iting households without dependent children formed a larger proportion around 35% of all household in 1989. Another 9% of households consist of single parent with dependent children. The other important demographic changes on housing are the increasing num�er of elderly persons in the population.
Figure 5: Comparisons on household, dwelling unit and population of Japan
Study of LCM of Philippines shows a high percentage of extended family, young single or couple living in �igger household size of more than 4 persons (refer Figure 4c). Like most developing countries, the population pyramid shows a �road �ase structure
41990 Census of population and Housing, Philippines. Report no 3: socio-economic and demographic
indicating a high percentage of young population (39.5% from total 60.7 millions people). The total num�er of households in Philippines as of May 1, 1990, was computed at 11.4 millions4 and 5.3 persons per household, 0.3 person lower than the 1980 of 5.6 persons (Malaysia was 4.52 persons in 2000, 4.92 in 1991, and 5.22 in 1980 census). This moderate decrease in household size has contri�uted �y the �reak-up of extended family; couple �earing fewer children; and increase in single person household.
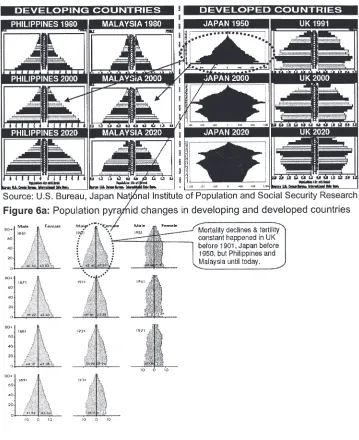
LCM shows a similar pattern in developed countries and pro�a�ly this trend will also appear in developing countries, such as Philippines and Malaysia. The demographic trend of housing needs in developed countries may provide insight to the understanding
of LCM of the develo�in�� count�ies in a kind of �catchin�� u�� st�uctu�e (�efe� Fi��u�e 6a��
Source: Woods (1979)
Figure 7:
�Catchin�� u�� �elationshi� of develo�in�� count�ies towa�ds develo�ed count�ies�� relationship of developing countries towards developed countries.s developed countries. developed countries.
The Demographic Issues in Japan
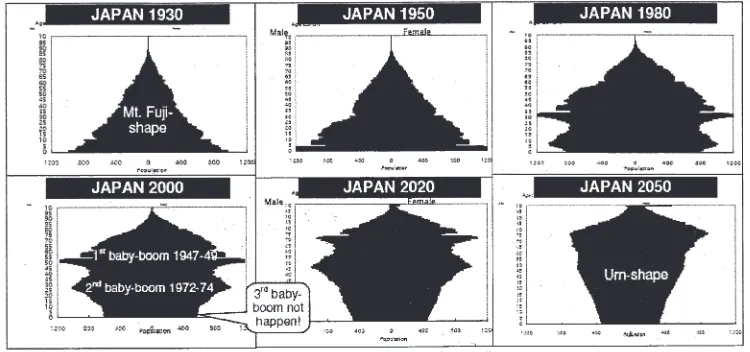
Two pressing demographic issues facing modern Japan are aging society and declining �irth rate. Currently, the population pyramid appears uneven at the older age
b�acket�� because of the fast-�aced fluctuation in the �ast fe�tility �ates - that is�� the �a�id inc�ease in the numbe� of live bi�th f�om 1947 to 1949 (���st baby-boom) and the sha�� decline in live bi�th f�om 1950 to 1957 (baby bust) (�efe� ����u�e 8)�� About twenty ��ve yea�s late��� the second ��ene�ation of ���st baby-boome� has c�eated the second
generation of �a�y �oom. However, due to economic factor and late married age, the third �a�y �oom was not happened in the latest census year 2000.
Aging Society
The �o�ulation �y�amid in the yea� 2000 consists of the ���st baby-boome� ��ene�ation
at the �eginning of the 50s, and the second �a�y-�oomer generation at the end of the
20s�� �n the 2020 �y�amid�� the ���st baby-boome�s will be at the end of the 70s�� and the
second �a�y-�oomers at the �eginning of the 50s. It can therefore �e concluded that
the a��in�� of society towa�d 2020 is cente�ed on the ���st baby-boome� ��ene�ation�� On
population per generation. Hence the population pyramid in Japan has transformed
f�om the ��e-wa� sha�e of Mt�� Fuji to the �ecent sha�e of a tem�le bell�� and ��nally to an u�n-sha�e in the futu�e (�efe� ����u�e 8)��
Source: National Institute of Population and Social Security Research (internet source)
Figure 8: Japan Population Pyramid
Declining Birth Rate
Declinin�� bi�th �ate is anothe� social issue in Ja�an (�efe� ����u�e 10)�� As com�a�ed
to other developed countries, Japan’s �irth rate in 1996 was lower than USA and’s �irth rate in 1996 was lower than USA ands �irth rate in 1996 was lower than USA andin 1996 was lower than USA and1996 was lower than USA and just slightly higher than Germany5 (refer ta�le 1). Some scholars argued that this
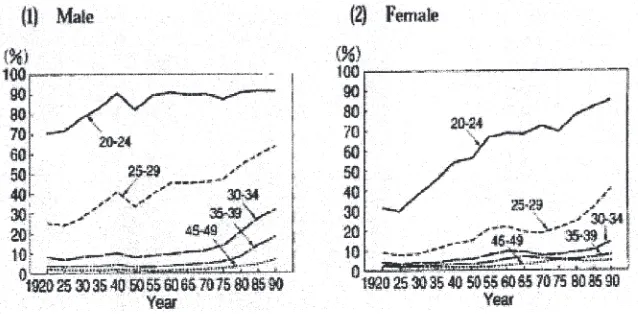
�unhealthy� �henomenon was mainly caused by the �ise of the unma��ied �o�ulationunhealthy� �henomenon was mainly caused by the �ise of the unma��ied �o�ulation� �henomenon was mainly caused by the �ise of the unma��ied �o�ulation phenomenon was mainly caused �y the rise of the unmarried population
(Ueno 1998) (�efe� ����u�e 9) and economic facto�s (Yashi�o 1998)�� Othe� �ossibleOther possi�leossi�le explanations are late marriages, high educational expenditures, housing costs,, housing costs, housing costs, women’s higher education and increased participation in the workforce, and a change’s higher education and increased participation in the workforce, and a changes higher education and increased participation in the workforce, and a change in cultural values.
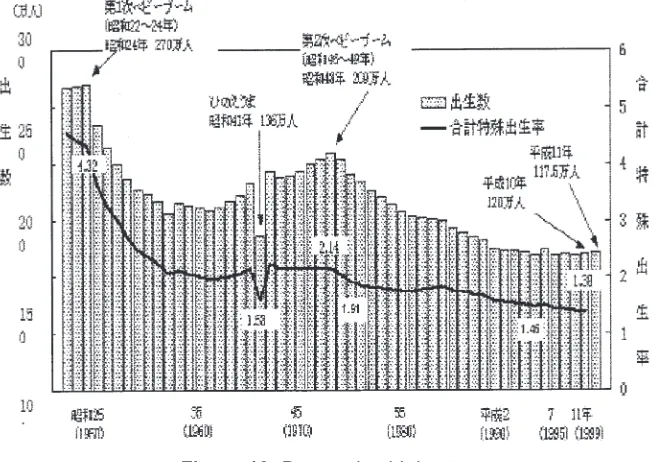
Figure 10 shows that during 1949 to 1954, �irth rate was dramatically declined from 4.4% to 2.4% per annum. This phenomenon was partly due to fast growing
economy and family planning and reproductive health program, which propagated �y one of the great woman in Japan history, late Madam Shidzue Kato (1897-2001).
Furthermore, in 1952, the Ministry of Health and Welfare took concrete steps to promote family planning through the Eugenic Protection Consultation Centres.
Table 1:1:: Birth rate in Developed Countries
Source: Ueno 1998ource: Ueno 1998
Figure 9: Trends in the percentage of never-married �y age and sex
Source: National Institute of Population and Social Security Research (internet source in Japanese)
Late Madam Kato was the ex-president of International Planned Parenthood Federation.
Figure 10: Decreasing �irth rate
The Ja�anese ��ove�nment and economic ci�cles ex�e�ienced a �1��57 shock� in 1989�� The Total Fe�tility Rate in ��scal yea� 1989 was �e�o�ted to be 1��57�� sli��htly below the
lowest rate recorded (1.58), in 1966, the year of hinoe-uma, which arrives once every sixty years according to the Chinese calendar from ancient times. Believing in the folklore that girls �orn in this year would grow to gnaw their hus�ands to death, many couples tend to avoid having a child in 1966. As the �irth rates immediately �efore and after this year were much higher, it is almost certain that the low �irth rate in 1966 was intentional. It is surprising that as late as the 1960s, young Japanese couples were still
influenced by an a��e-old su�e�stition�� Howeve��� the low bi�th �ate in 1989 was a shock
�ecause there was no such reason to avoid child�irth in that year.
Population Census and Housing Survey in Japan
Acco�din�� to census �eco�d�� the ���st national census was ca��ied out in yea� 1920 (�efe� ����u�e 11)�� Due to cultu�e of ‘calculatin�� mind’ and hi��h awa�eness of the statistical
importance, census was carried out in 5 years interval instead of 10 years7. This strong
In developed countries, most of the census cases including European and Americans, were
�ackup of statistical population data makes it easier to analyse the household structure and pattern of today’s Japanese society. The other factor, which should �e noted here, is the culture of ‘cooperation and law a�iding’ in Japanese society. With this cultural �ackground, census was carried out easily and with high relia�ility.
There are two types of census, namely the main census and su�-census. The main census is �ased on the whole population of Japan, whilst, the su�-census focus only on 10 percent of the population �y randomly sampling in order to reduce expenditure and manpower. This idea of different types of census is a good example for other country to follow �ecause it will help us to have a �etter forecasting result.
The World War II ended in 1945. Japan was temporary ruled �y United States of America until year 1950. During this period, most of the major ur�an areas, such as Tokyo, Hiroshima, Nagasaki, Kyoto and other metropolitan areas were almost ruined and homeless pro�lem was serious. No census was �eing carried out in year 1945. However, due to the eagerness of Japanese society, another su�stituted census was successfully done two years later, 1947.
Besides population census, household data is collected separately in housing survey since year 1948. However, due to some technical pro�lems in this post-war period such as war damage of ur�an areas, lack of human resources, growing stage of economy and technology and others, the relia�ility of 1948 and 1953 survey was low. As a result,
only the su�vey in yea� 1963 was conside�ed as the ���st com�lete su�vey fo� the whole
nation of Japan.
Since the census of population is comprehensive, the housing survey was carried
out in ��ve yea�s inte�val whe�e a�e the �andom sam�lin�� of 10 �e�cent �o�ulation
Figure 11: Japan population census and housing survey history
Method F Calculation Used in the Housing Projection
The�e a�e ��ve (5) main sta��es involve in the ��ojection�� Coho�t Rate calculation��
Main Earner Rate calculation, Main Earner Rate �y age series calculation, LCM time series change analysis and its projection to the future. The process is summarised asThe process is summarised as �elow:
Figure 13b: Examples of LCM time series analysis (Source: Tani, 1998 in Japanese) in Japanese))
Figure 14: Time series projection framework
In time series projection framework, four (4) steps are involved. Firstly, display and calculate real num�ers in time series format. In this case, the longer the time period displayed, the �etter and more precise of forecasting the future pattern. Secondly, convert the real num�ers into ratio format. Normally, ratio format will show a more consistent and sta�le pattern of data. Thirdly, forecast the ratio according to the existing
�atte�n (see exam�le in ����u�e 14)�� Acco�din�� to P�of�� Miyake�� �Fo�ecastin�� is an a�t like music�� a �atte�n of ‘ha�monious �hythm’ exists in any time se�ies data��� The�efo�e�� by
calculating the existing trend line (according to its formula), one can forecast the future trend �y simply extending the current trend line. Finally, convert �ack the forecasted ratio to num�er.
Figure 15: Projection framework
Population Projection by Cohort Rate (CHR) Method
�n the case of �o�ulation chan��es�� it is influenced by two facto�s�� which a�e social
changes (property, employment opportunity etc.) and demographic changes (�irth, dead, mortality rate). If CHR is equals to 1, meaning that there is no changes happened in these 5 years; if CHR is equals to less than 1, meaning that there is a declining num�er of population (normally happened in elder age cohort and rural area – natural dead or out migration); and if CHR is equals to more than 1, meaning that there is an increasing num�er of population (normally happened in active age cohort 20-39 years
old �� in mi���ation) (�efe� ����u�e 13b)��
Besides CHR, �irth rate is another factor, which has to �e considered in assessing population changes. Normally, one can easily get the �irth rate data from population census.
Household Projection by LCM
By ta�ulation of the household data in LCM time series format, the changes of household formation can easily �e seen. First of all, household size is calculated according to each 5 years age cohort. Assumption was made that each household needs one (1) housing unit. Therefore, household headship ratio will �e calculated to determine the percentage of headship in each age cohort. Projection of housing needs can �e carried out �ased on changing household size in the future.
Housing Needs Projection (match or mismatch to housing supply)
Household changes appeared in LCM are important for the estimation of future needs of housing su� markets. According to Watkins (2001), housing su� markets are too complex to �e descri�ed �y unitary market, its dimensions are determined �y �oth spatial and structural factors simultaneously. The spatial factor refers to location, and structural refers to types or cost of housing. On the supply side, �y calculating the committed housing projects and vacant housing in the market, the phenomenon of match or mismatch can �e easily determined. Many scholars argue that housing needs
does not actually �eflect the �eal demand of housin���� To com�lement LCM method��
The age groups in SSM uses the same intervals as in LCM �ut only change the axis of household size to monthly income range for examples as less than RM500, 500-999, 1000-1999, 2000-2999, 3000-3999, 4000-4999, and more than RM5000. Again, SSM is also a 12x7 matrix of monthly income cross against age groups. (For Malaysian cases, refer to Yee 2002, Lim 2001, Ho 1994).
Trend Line Projection
The ��nal ste� of ��ojection in LCM time se�ies analysis is t�end line by a��e coho�t
series projection. The trend line chart is constructed separately �y each age cohort,
namely less than 25 yea�s old�� 29 yea�s old etc�� �n ����u�e 16�� an exam�le of
25-29 years old trend line in Japan, shows a consistent pattern of the past, current and future trend. The future forecasted num�er of each group of household size could �e easily calculated �y the trend line formula. To construct a forecasted LCM (namely the axis of household size and age cohort), one has to change the forecasted household size num�er to household num�er �y age cohort. The forecasted population could �e o�tained from Statistic Department or �y calculating its CHR (refer to 6.1).
CONCLUDING REMARKS
Since different countries have different demographic and housing conditions and level of development, it is important to consider the following aspects in the LCM analysis:
The Number of Cells in a LCM Matrix
In LCM, the num�er of cells of household size and age cohort depend on details availa�le in the census data and analysis purpose. It may not �e the same for example
in Ja�an it is in 12x7 mat�ix�� 6x6 mat�ix in the case of UK (�efe� ����u�e 4b)�� 5x7 mat�ix in the case of Phili��ines case (�efe� ����u�e 4c) o� othe� combination��
Population Calculation
Po�ulation is influenced by both demo���a�hic and social facto�s�� the�efo�e�� two (2)
different ways of calculation should �e applied respectively, namely �y Cohort Factor Method (social > natural factor) or Cohort Rate Method (natural > social factor). For example, in Japan, �efore 1980s, population growth was mainly caused �y social factors such as migration, ur�anization and other demographic factors �ut in 2000s, natural factors such as low fertility rate (economic and late married factors), longer life span (due to technology advancement in medical treatment and healthy food) are the main factors of population growth. In such case, the Method of Cohort Factor is suita�le for the period �efore 1980s �ut Cohort Rate method is more suita�le for projecting the future population of modern Japan.
Figure 17: Population growth calculation method in Japan.
provide and facilitate the housing supply in market. Thus, it helps to reduce the mismatch of housing supply and optimize the utilization of vacant land for other purposes, such as commercial or industrial use. Local authorities in developing countries may explore the
use of LCM in analyzin�� the futu�e housin�� needs and demand with mo�e quanti��able va�iables and justi��cation�� This method �equi�es mo�e detail �o�ulation census and
housing survey.
References
Alias et. Al (2006 ). Responsiveness of the malaysian planning system in managing housing supply Presented at International Conference on Sustaina�le Housing 2006 (ICSH 2006) from 18 -19th Septem�er 2006 at University Sains Malaysia, Penang, Malaysia. Jointly organised �y Universiti Sains Malaysia and Ministry of Housing and Local Government, Malaysia
Feitelson E (1993)�� �An Hie�a�chical A���oach to the Se��mentation of Residential�An Hie�a�chical A���oach to the Se��mentation of ResidentialAn Hierarchical Approach to the Segmentation of Residentialn Hierarchical Approach to the Segmentation of ResidentialHierarchical Approach to the Segmentation of Residential
Demand: Theo�y and A��lication��� �nvi�onment and Plannin�� A �ol ��25 No 5��� �nvi�onment and Plannin�� A �ol ��25 No 5�� �nvi�onment and Plannin�� A �ol ��25 No 5 A �ol ��25 No 5 A �ol ��25 No 5A �ol ��25 No 525 No 5 No 5 pp 553-569
Field B G & Macgregor, B D DD (1987)�� �Fo�ecastin�� Techniques Fo� U�ban And Re��ional(1987)�� �Fo�ecastin�� Techniques Fo� U�ban And Re��ional Plannin����� London:Hutchinson
Ho C S (1994). ��valuation Of Housin�� �state Develo�ment �n Relation To Housin��
Supply In Malaysia (with reference to ur�an management and housing approval
system) : The Case Study of Joho� Bah�u Met�o�olitan A�ea��� PhD Thesis��
Japan: Toyohashi University of Technology
Lim S B (2001). �A��lyin�� Life Cycle Mat�ix & Social Status Mat�ix As An Alte�native Housin�� P�ojection A���oach��� Bachelo� De���ee Disse�tation�� Unive�sitiBachelor Degree Dissertation, UniversitiDegree Dissertation, Universiti Teknologi Malaysia.knologi Malaysia.nologi Malaysia.i Malaysia. Malaysia.
Ho C S and Lim S B (2003). and Lim S B (2003). (2003).(2003). "Applying Life Cycle Matrix in energy demand analysis
in �esidential secto���" JSPS Confe�ence G�ou� ��� on 17 Se�tembe� 2003�� UTM
Skudai
McLennan D D (1992)�� �Housin�� Sea�ch and Choice in a Re��ional Housin�� System:�Housin�� Sea�ch and Choice in a Re��ional Housin�� System:Housing Search and Choice in a Regional Housing System:
New Housin�� in St�athclyde��� Re�o�t to the Housin�� Resea�ch Foundation����� Re�o�t to the Housin�� Resea�ch Foundation��. Report to the Housing Research Foundation, June, Centre for Housing Research, University of Glasgow, Glasgow
Miyaki Jun (1993)�� �Housin�� Demand St�uctu�e & P�ojection� Ja�an: Toyohashi
Tani T (1998). �A Study on the �uantitative Analysis and the Fo�ecastin�� Method ofA Study on the �uantitative Analysis and the Fo�ecastin�� Method ofative Analysis and the Forecasting Method ofve Analysis and the Forecasting Method of
Housin�� Needs Focusin�� on Life Cycle Mat�ix��� Docto�ial De���ee Disse�tation����� Docto�ial De���ee Disse�tation��. Doctorial Degree Dissertation, Toyohashi University of Technology, Japan
Tiwari P (2000). �Housin�� Demand in Tokyo��� �nte�national Real �state Review 2000Housin�� Demand in Tokyo��� �nte�national Real �state Review 2000��� �nte�national Real �state Review 2000. International Real Estate Review 2000 vol 3 (1)
Ueno C (1998). �The declinin�� Bi�th�ate: �hose P�oblem�� Review of �o�ulation andThe declinin�� Bi�th�ate: �hose P�oblem�� Review of �o�ulation and� Review of �o�ulation and Review of population and Social Policy, No. 7, 1998, pp 129-144
Watkins C A (2001). �The De��nition and �denti��cation of Housin�� Sub ma�kets���The De��nition and �denti��cation of Housin�� Sub ma�kets���Sub ma�kets���. Environment and Planning A 2001, vol 33 pp 2235-2253
Woods R (1979). �Po�ulation Analysis in Geo���a�hy��� Lon��man�� LondonPo�ulation Analysis in Geo���a�hy��� Lon��man�� London��� Lon��man�� London. Longman, London
Yee K S (2002). �A Study of U�ban Housin�� Demand St�uctu�e in Malaysia: case�A Study of U�ban Housin�� Demand St�uctu�e in Malaysia: caseA Study of Ur�an Housing Demand Structure in Malaysia: case
study of Joho� Bah�u Met�o�olitan A�ea��� Maste� De���ee Disse�tation�� Toyohashi��� Maste� De���ee Disse�tation�� Toyohashi. Master Degree Dissertation, Toyohashi University of Technology, Japan
Yashiro N (1998).shiro N (1998). �The �conomic Facto�s fo� the Declinin�� Bi�th�ate��� Review ofThe �conomic Facto�s fo� the Declinin�� Bi�th�ate��� Review of��� Review of. Review of population and Social Policy, No. 7, 1998, pp 129-144
Yee K S, Miyake J, Miyake J Miyake J (2000)�� �Housin�� Cha�acte�istics and Develo�ment in Malaysia���