ABSTRACT
LI, SHUHAI. Comparing the Performance of Naturally Ventilated and Fan Ventilated Greenhouses. (Under the direction of Daniel H. Willits.)
In order to evaluate the comparative performance of natural ventilation (NV) and
fan-ventilation (FV) greenhouses, several aspects of cooling were considered: fog cooling and
control in NV houses; thermal stratification in FV houses; environmental comparison of NV
and FV houses and their suitability under a variety of climates.
Cooling efficiency and evaporation efficiency of low-pressure and high-pressure
fogging systems were compared. Data show that the high-pressure system had greater
evaporation efficiency and cooling efficiency than the low-pressure system. A control
strategy, NCSU control, was proposed to control both the pump and the vents in a
high-pressure fogging system for naturally ventilated greenhouses. NCSU control and four other
control strategies were tested. It was found that NCSU control cycled the pump less
frequently and resulted in higher cooling efficiency. NCSU control was shown to be able to
maintain air temperature and relative humidity simultaneously.
Thermal stratification in a fan-ventilated house was studied. Experimental data
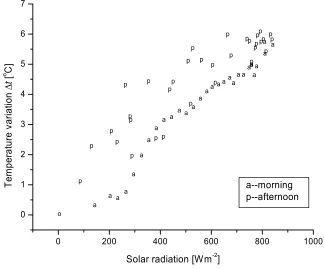
suggested that the vertical air temperature variation increased with solar radiation. Lower
ventilation rates, in conjunction with evaporative pad cooling, also created greater vertical air
temperature variations. The presence of a canopy reduced air temperature variation. A model
was developed to predict the air temperature distribution in the vertical direction. Simulations
suggested that increased ventilation reduced air temperature more in the upper part of the
greenhouse. Evaporative pad cooling reduced air temperature more in the lower part of the
The inside environment was compared between NV and FV houses. The spatial
variation of air temperature of the FV houses was more than in the NV houses and the air
temperature in the NV houses underwent less variation during the course of a day. Leaf
temperature was higher than air temperature when evaporative pads were used. The reverse
was true when evaporative pads were not used. The cooling abilities of fan-and-pad system
and high-pressure fog with natural ventilation were comparable in terms of temperature
reduction. Due to lower airflow in NV houses, inside enthalpy was higher in NV houses than
in FV houses.
The suitability of fan and natural ventilation with evaporative cooling (evaporative
pads and high-pressure fog) was investigated with a simulation model and the weather data
of selected locations. It is suggested that the suitability of various cooling technologies
depends on climate, evapotranspiration and the ventilation characteristics. The geographical
COMPARING THE PERFORMANCE OF NATURALLY VENTILATED AND FAN
VENTILATED GREENHOUSES
By
SHUHAI LI
A thesis submitted to the Graduate Faculty of
North Carolina State University
in partial fulfillment of the
requirements for the Degree of
Doctor of Philosophy
BIOLOGICAL AND AGRICULTURAL ENGINEERING
Raleigh, NC
2007
APPROVED BY:
________________________________ _________________________________ Mary M. Peet James H. Young
BIOGRAPHY
Shuhai Li was born in Henan Province, China on July 2nd, 1978. He earned his bachelor’s
degree from China Agricultural University in Agricultural Structure and Environmental
Engineering. He pursued his master’s degree at the same university and worked on
greenhouse environment modeling. In the fall of 2003, he entered the doctoral program in
Controlled Environment Agriculture at NC State under Dr. Daniel H. Willits and will
ACKNOWLEDGEMENTS
It is a great relief to finally arrive at this point after a long journey of dissertation writing,
feeling as if I am standing on an outlook platform after hiking a long trail. Looking back the
sophisticated terrain and dense canopy behind, I realized there were so many chances I could
have been lost in the forest without the invaluable guidance and assistance from the people to
whom I am indebted so much.
I express my deepest gratitude to Dr. Willits, my advisor, for his guidance during the
past four years. As his sole PhD student, I received much more attention and advice than
otherwise possible. His integrity, persistence and self-discipline will always be an inspiration
of what a scientist is supposed to be. I truly appreciate his numerous assistances during
research and personal issues. It is unforgettable that he once drove me to hospital after I cut
my finger accidentally.
I thank Dr. Jack Edward, Dr. Mary Peet and Dr. Jim Young for serving on my
committee. The efforts they put into my exams and the multitude of suggestions they gave on
my research are appreciated very much.
The person I would like to thank most is Cyrus Yunker. Over the years, we have been
working side by side. The friendship we developed will be lifelong treasure to me. I also
thank Justin Macialek, Chase Helms, Jessica Bradford, and Heidi Bunn for their excellent
work during the project.
The financial support for my PhD study from BARD is also acknowledged.
Finally, I would like to thank my parents, Fashan Li and Chuanqin Liu and my
TABLE OF CONTENTS
LIST OF TABLES………..……
x
LIST OF FIGURES………....….….
xi
CHAPTER 1 INTRODUCTION ... 1
1.1 Greenhouse Production in U.S. and World ...1
1.2 Greenhouse Cooling Technologies...2
1.3 Design Limitations...5
1.4 Objectives ...6
1.5 Dissertation Composition...8
References ...9
CHAPTER 2 COMPARING LOW-PRESSURE AND HIGH-PRESSURE FOGGING SYSTEMS IN NATURALLY VENTILATED GREENHOUSES ... 11
2.1 Introduction ...11
2.2 Materials and Methods ...12
2.2.1 Experiment Setup...12
2.2.2 Measurements ...13
2.2.3 Data Processing ...14
2.3 Results and Discussion ...16
2.3.1 Running Examples...16
2.3.3 Cooling Efficiency...26
2.4 Conclusions ...27
Nomenclature...27
References ...29
CHAPTER 3 CONTROL STRATEGIES FOR HIGH-PRESSURE FOG IN NATURALLY VENTILATED GREENHOUSES... 31
3.1 Introduction ...31
3.2 Materials and Methods ...33
3.2.1 Facilities...33
3.2.2 Control sensors ...35
3.2.3 Implementation of Control Strategies ...35
3.2.4 Oberved Data Measurement and Processing ...44
3.3 Results and Discussion ...45
3.4. Conclusions ...51
Nomenclature...52
CHAPTER 4 THERMAL STRATIFICATION IN FAN-VENTILATED GREENHOUSES-EXPERIMENTAL STUDY ... 55
4.1 Introduction ...55
4.2 Method and Material ...56
4.2.1 Greenhouses...56
4.2.3 Treatments ...57
4.2.4 Measurements ...58
4.3 Results and Discussion ...60
4.3.1 Airflow Patterns ...60
4.3.2 Effects of Ventilation Rate and Evaporative Pad on Thermal Stratification ...69
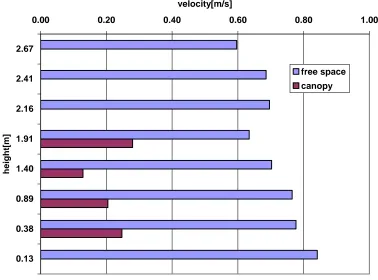
4.3.3 Effects of Canopy on Thermal Stratification ...83
4.4 Conclusions ...87
References ...88
CHAPTER 5 THERMAL STRATIFICATION IN FAN-VENTILATED GREENHOUSES - MODELING STUDY ... 90
5.1 Introduction ...90
5.2 Model Description ...93
5.2.1 Sensible Heat Conservation of Air...94
5.2.2 Water Vapor Conservation of Air...95
5.2.3 Heat Conservation of Canopy...97
5.3 Solution...98
5.3.1 Discretization...98
5.3.2 Programs...103
5.4 Calibration and Verification ...104
5.5 Simulations...106
5.1 Effects of Ventilation Rate and Evaporative Pad ...106
5.6 Conclusions ...114
Nomenclature...115
References ...117
CHAPTER 6 ENVIRONMENTAL COMPARISON OF NATURALLY VENTILATED AND FAN-VENTILATED GREENHOUSES... 119
6.1 Introduction ...119
6.2 Materials and Methods ...120
6.2.1 Structures and Facilities...120
6.2.2 Plants ...122
6.2.3 Measurements ...123
6.2.4 Data Processing ...123
6.3 Results and Discussion ...124
6.3.1 Spatial variation of air temperature...124
6.3.2 Temporal variation of air temperature...126
6.3.3 Leaf-air-temperature difference ...128
6.3.4 Comparison of FV+Pad and NV+hp Fog ...131
6.4 Conclusions ...133
References ...134
CHAPTER 7 THE SUITABILITY OF GREENHOUSE COOLING TECHNOLOGIES UNDER VARIOUS CLIMATES ... 135
7.2 Methods and Materials ...137
7.2.1 Simulation Model ...137
7.2.2 Locations and Weather Data ...140
7.2.3 Suitability Assessment ...141
7.3 Results and Discussion ...143
7.4 Conclusions ...147
Nomenclature...147
Reference ...148
CHAPTER 8 SUMMARY ... 150
APPENDICES... 153
Appendix A Experiment Setup and Procedures...154
A.1 Facilities and Equipment...154
A.3 Measurements ...160
A.4 Treatments...165
Appendix B Selection of experimental data in analyzing the cooling effect of fogging systems ...168
Appendix C High-pressure fog control with temperature and relative humidity --Control strategy 1 ...172
Appendix D High-pressure fog control based on Handarto’s paper---Control strategy 2 ...176
Appendix E High-pressure fog control with VPD---Control strategy 3 ...180
Appendix G NCSU control ---Control strategy 5...185
Appendix H Calibration procedure for leaf wetness sensor ...196
Appendix I MATLAB code for thermal stratification model without considering canopy...198
LIST OF TABLES
Table 2.1 Statistics of outside weather, spray rate, environment differences between the
fogged and unfogged greenhouses, cooling and evaporation efficiencies for the low-pressure
system ... 20
Table 2.2 Statistics of outside weather, spray rate, environment differences between the fogged and unfogged greenhouses, cooling and evaporation efficiencies for the high-pressure system ... 23
Table 3.1 Control actions taken for each zone when targeting a setpoint... 42
Table 3.2 Dependence of vent configuration of next decision cycle on β and the current vent onfiguration... 43
Table 3.3 Dependence of spray rate of next decision cycle on the value of λ and the current spray rate... 44
Table 3.4 Least square means of the cooling efficiency, evaporation efficiency, water use, action frequency of high-pressure pump and the percentage of wetting duration for the five control strategies ... 46
Table 5.1 Calibrated parameters ... 105
Table 5.2 Comparison of observed and predicted air temperatures... 106
Table 7.1 Locations selected for this study... 141
Table 7.2 Definition of suitability index ... 142
LIST OF FIGURES
Figure 1.1 Schematic of fan and pad systems... 4
Figure 1.2 Schematic of fogging systems in naturally ventilated greenhouses ... 5
Figure 2.1 Cooling efficiency and temperatures for the low-pressure system. Time was
Eastern Daylight Time (EDT)... 17
Figure 2.2 Relative humidities in the fogged, unfogged greenhouses and the outside for the
low-pressure system. Time was Eastern Daylight Time (EDT)... 18
Figure 2.3 Evaporation efficiency, spray rate and evaporation rate for the low-pressure
system. Time was Eastern Daylight Time (EDT). ... 19
Figure 2.4 Cooling efficiency and temperatures for high-pressure system. Time was Eastern
Daylight Time (EDT)... 21
Figure 2.5 Relative humidities in the fogged, unfogged greenhouses and the outside for the
high-pressure system. Time was Eastern Daylight Time (EDT)... 22
Figure 2.6 Evaporation efficiency, spray rate and evaporation rate for the high-pressure
system. Time was Eastern Daylight Time (EDT). ... 22
Figure 2.7 Effect of out humidity ratio deficit on evaporation efficiencies of low-pressure and
high-pressure systems ... 25
Figure 2.8 Effect of ventilation rate on evaporation efficiencies of low-pressure and
high-pressure systems... 25
Figure 2.9 Effect of spray rate on the cooling efficiencies of low-pressure and high-pressure
systems... 26
Figure 2.10 Effect of outside humidity ratio deficit on the cooling efficiency of low-pressure
Figure 3.1 Layout of the 24 high-pressure nozzles, with 12 nozzles for each level of fogging
... 34
Figure 3.2 Water treatment and valve system enabling two levels of fogging ... 35
Figure 3.3 Durations for cycle of vent control, fog control (pump) and disk write for strategy 4... 39
Figure 3.4 Zone classifications when targeting a setpoint ... 40
Figure 3.5 Outside, inside and target enthalpies at 5:00-6:00PM on Sept. 21, 2006 when strategy 5 was in effect ... 48
Figure 3.6 Evolution of the ventilation configuration affected by the normalized index β. β >1 indicates more airflow was required to adjust inside enthalpy to the target value; β <1 indicates less airflow was required. ... 49
Figure 3.7 Actual, target humidity ratio and change of fog level at 5:00-6:00PM on Sept. 21, 2006... 50
Figure 3.8 Inside temperature, relative humidity and the target values... 51
Figure 4.1 Crop configuration and positions of the air velocity sample points... 57
Figure 4.2 Double-row size for each canopy treatment... 58
Figure 4.3 Greenhouse geometric parameters and three sections where air velocities were measured ... 60
Figure 4.4 Velocity profile for treatment of LV and no canopy... 61
Figure 4.5 Velocity profile for treatment of HV and no canopy ... 61
Figure 4.6 Projected velocity profiles for five ventilation rates from LV to HV... 62
Figure 4.7 Velocity profile for treatment LV and canopy size 1... 63
Figure 4.9 Velocity profile for treatment LV and canopy size 2... 64
Figure 4.10 Velocity profile for treatment HV and canopy size 2 ... 65
Figure 4.11 Velocity profile for treatment LV and canopy size 3 ... 65
Figure 4.12 Velocity profile for treatment HV and canopy size 3 ... 66
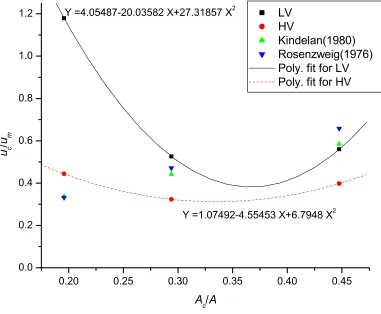
Figure 4.13 Ratio of canopy velocity to mean velocity (uc/um) as the function of the ratio of canopy area to greenhouse cross-section area (Ac/A) and ventilation rate... 68
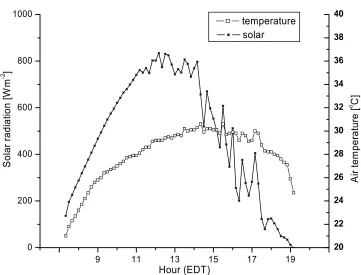
Figure 4.14(a) Outside solar radiation and dry bulb temperature (LV, pad off) ... 70
Figure 4.14(b) Temperatures measured by aspirated stations 3 to 7 (LV, pad off) ... 71
Figure 4.14(c) Vertical temperature variation vs. outside solar radiation (LV, pad off ) ... 71
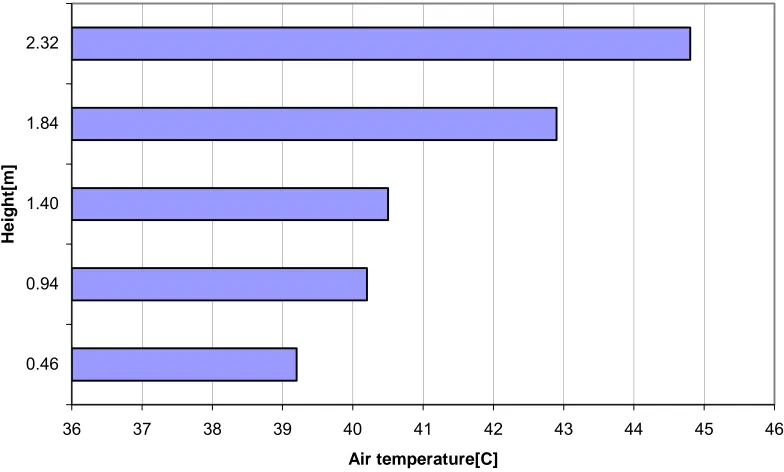
Figure 4.14(d) Vertical air temperature profile at 12:50 PM, EDT (LV, pad off ) ... 72
Figure 4.15(a) Outside solar radiation and dry bulb temperature (HV, pad off)... 73
Figure 4.15(b) Temperatures measured by the aspirated station 3-7 (HV, pad off)... 74
Figure 4.15(c) Vertical temperature variation vs. outside solar radiation (HV, pad off )... 74
Figure 4.15(d) Vertical air temperature profile at 12:50 PM, EDT (HV, pad off) ... 75
Figure 4.16(a) Outside solar radiation and dry bulb temperature (LV, pad on) ... 76
Figure 4.16(b) Temperatures measured by aspirated stations 3 to 7 (LV, pad on)... 76
Figure 4.16(c) Vertical temperature variation vs. solar radiation (LV, pad on) ... 77
Figure 4.16(d) Vertical air temperature profile at 11:40 AM, EDT (LV, pad on) ... 77
Figure 4.17(a) Outside solar radiation and dry bulb temperature (HV, pad on) ... 78
Figure 4.17(b) Temperatures measured by aspirated stations 3 to 7 (HV, pad on) ... 79
Figure 4.17(c) Vertical temperature variation vs. outside solar radiation (HV, pad on) ... 79
Figure 4.17(d) Vertical air temperature profile at 12:00PM, EDT (HV, pad on)... 80
Figure 4.19 Vertical temperature variations for LV and HV with pad on... 81
Figure 4.20 Vertical temperature variations vs. solar radiation with LV ... 82
Figure 4.21 Vertical temperature variations vs. solar radiation with HV ... 83
Figure 4.22 Vertical temperature variations for the greenhouses with and without plants... 84
Figure 4.23 Vertical temperature distributions for two greenhouses: one with plants and the other without ... 85
Figure 4.24 Air and leaf temperatures at top, middle and top sections of canopy... 86
Figure 4.25 Vertical air temperature distributions with various canopy heights ... 87
Figure 5.1 Directions x and z where temperature variation is likely to develop... 91
Figure 5.2 Model configuration and geometric parameters... 94
Figure 5.3 Discretization and mesh numbering ... 99
Figure 5.4 Temperature distributions for case of LV with evaporative pad off ... 107
Figure 5.5 Temperature distributions for case of LV with evaporative pad on... 107
Figure 5.6 Temperature distributions for case of HV with evaporative pad off ... 108
Figure 5.7 Temperature distributions for the case of HV with evaporative pad on ... 108
Figure 5.8 Effect of evaporative pad cooling on vertical temperature distribution: (a) vertical temperature distribution for LV; (b) vertical temperature distribution for HV. ... 109
Figure 5.9 Effect of ventilation rate on the vertical temperature distribution: (a) with evaporative pad off; (b) with evaporative pad on. ... 110
Figure 5.10 Vertical temperature distributions of the four combinations of evaporative cooling and ventilation rate...111
Figure 5.11 Air temperature distributions with canopy (HV, pad on)... 112
Figure 5.13 Leaf temperature distributions with canopy (HV, pad on). The blue area
represents the free space above the canopy... 113
Figure 5.14 Vertical air temperature distributions with and without canopy... 114
Figure 6.1 Layout of four greenhouses. Two were fan-ventilated (FV1 and FV2) and two were naturally ventilated (NV1 and NV2)... 121
Figure 6.2 Spatial variation of air temperatures in FV 1 and NV1. Data points were the maximum temperature reading minus the minimum and then averaged on daily basis... 125
Figure 6.3 Spatial variation of air temperatures in FV 2 and NV 2. Data points were the maximum temperature reading minus the minimum and then averaged on daily basis... 125
Figure 6.4 Temporal variation of air temperatures in FV1 and NV1. Data points were the maximum average temperature minus the minimum average temperature on daily basis. .. 127
Figure 6.5 Temporal variation of air temperatures in FV2 and NV2. Data points were the maximum average temperature minus the minimum average temperature on daily basis. .. 127
Figure 6.6 Leaf-air temperature differences in FV1 in 2003 ... 128
Figure 6.7 Leaf-air temperature differences in NV2 in 2003 ... 129
Figure 6.8 Leaf-air temperature differences in FV1 and NV1 in 2005... 130
Figure 6.9 Leaf-air temperature differences in FV2 and NV2 in 2005... 130
Figure 6.10 Temperatures in the FV house with the evaporative pad, the NV house with the high-pressure fog and the outside ... 131
Figure 6.11 Relative humidities in the FV house with the evaporative pad, the NV house with the high-pressure fog and the outside ... 132
Figure 7.1 Dependence of ventilation rate on wind speed... 139
Figure 7.2 Regression relationship between enthalpy and wet bulb temperature... 140
Figure 7.3 Suitability indices for the U.S. and Canadian locations. ‘4’ indicates that natural
ventilation without fog is suitable; ‘2 ‘indicates both fan-and pad system and natural
ventilation with high-pressure fog are suitable; ‘1’ indicates that only fan-and-pad system is
suitable; ‘0’ means neither of the cooling options is suitable. ... 145
Figure A.1 Layout of four greenhouses. Two were fan-ventilated (FV1 and FV2) and the
other two were naturally ventilated (NV1 and NV2)... 155
Figure A.2 Dimensions of FV greenhouses ... 155
Figure A.3 Dimensions of NV greenhouses (unit: m) ... 156
Figure A.4 Layout of nozzles of the low-pressure fogging systems. There were 24 foggers,
with 8 foggers in each of three separate rows. One row is in the middle and the other two are
on the both sides... 157
Figure A.5 Layout of high-pressure nozzles. The system consisted of 24 nozzles, with first 12
nozzles as the first level, and the last 12 as second level... 157
Figure A.6 Water treatment and configuration of fog levels... 158
Figure A.7 Positions of aspirated stations and dry & wet bulb boxes measuring air
temperatures and humidity in NV houses... 161
Figure A.8 Positions of aspirated stations and dry & wet bulb boxes measuring air
temperatures and humidity in FV houses... 162
Figure A.9 Measurement of leaf temperature with fine type-K thermocouples ... 163
Figure A.10 Anemometer and vane mounted on the steel frame to measure wind speed and
Figure B.1 Example of the days when the data were compromised and therefore not used
(Julian date 178)... 171
Figure B.2 Example of day when the data were regarded as valid and used (Jilian date 170)
... 171
Chapter 1 Introduction
1.1 Greenhouse Production in U.S. and World
Agricultural production can be categorized as either indoor or open field production.
Greenhouses are a type of indoor production facility characterized by transparent covers.
Greenhouse, nursery and floriculture products have become increasingly popular and have
become a fast growing sector of agricultural economy of the U.S. The expenditure per
household on nursery and greenhouse products increased by 54% from 1990 to 2004 (Noel,
2005). The value of vegetables, melons and other specialty crops was about $11.2 billion
(National Agricultural Statistics Service, 2005). Among them, greenhouse production
accounts for a significant portion.
Rapid increases in greenhouse production were seen in the past two decades across
the world. Increased and year-around demand for high quality produce, and increased
concern about food security, are some of the factors that have contributed to the rapid
development of the greenhouse industry. Aside from the several major export countries of
horticultural products such as the Netherlands and Israel, greenhouse production has become
an important industry in countries such as Spain, Greece, China, South Korea and Mexico. A
large portion of greenhouse production is concentrated in areas like the Mediterranean, North
Europe, East Asia and North America (Enoch and Enoch, 1999). Greenhouse produce
exported from these countries and regions is increasing every year.
As greenhouse production increases dramatically overseas, especially in developing
countries, greenhouse growers in the U.S. face increasing competition. They are looking for
migrate operations to warm regions to reduce heating costs in winter, a major operational
cost. However, cooling problems in summer have become of more concern because warm
winters are generally accompanied by hot summers. One straightforward solution to
avoiding summer cooling is to halt production during that period. However, keeping
greenhouses empty is not an economical option for many growers because they will lose
revenue by not fully using structures and equipment with limited lifetime (Beytes, 2006).
Moreover, year-round production is an important strategy to maintain an established brand. A
break of supply of several months could have a chilling effect on market share.
1.2 Greenhouse Cooling Technologies
To maintain summer production, cooling must be provided to ensure proper growth
conditions for the crop. Greenhouse cooling is achieved, first of all, by the intrinsic function
of plant-transpiration (Seginer et al., 2000). By evaporating water through leaf surfaces, plants keep leaf temperature from rising to detrimental levels. Ventilation, the process of
exchanging air inside the greenhouse with that outside (ASAE, 2003), is needed for plant
transpiration to take place continually, otherwise, water vapor will be built up inside the
greenhouse and transpiration will be suppressed.
Greenhouse ventilation is either driven by natural wind and/or buoyancy effect
(natural ventilation) or fans (fan ventilation). Studies have suggested that natural ventilation
(NV) driven by wind will be dominant over that driven by buoyancy when outdside wind
speed is above 1-2 m s-1. In summer, wind speeds in open areas are generally higher than that
because of atmospheric activities, therefore natural ventilation in summer is primarily wind
induced. For that reason, natural ventilation is unstable and unpredictable. In addition,
in FV houses than NV houses. Even on windy days where the performance of fans can be
affected, airflow will not deviate from design condition significantly. These differences
between NV and FV determine their respective cooling performance and their compatibilities
with other cooling systems.
When ventilation is not sufficient to mitigate the temperature in greenhouses,
evaporative cooling will generally be applied. Evaporative pad cooling and fogging are two
commonly used evaporative cooling technologies.
Evaporative pads are usually made of a water absorbent material and fabricated in
forms that allow air penetrating. When the pad is wetted by water supplied from above and
air is pulled through the pad, part of the sensible heat of the incoming air is transformed into
latent heat, resulting in reduced air temperature and increased relative humidity. Evaporative
pads are generally used with fan ventilation but not with natural ventilation. The reason is
that for evaporative pads to work properly, they must be installed at the air intake of a
greenhouse so that cooler air leaving the pad will move into the greenhouses. In NV houses,
more than one vent is generally installed so these vents can coordinate each other. When
some vents function as intakes, others may function as outlets. Since wind direction is
constantly changing, the vents that originally functioned as intakes may change to outlets and
vice versa. There are no fixed intakes so it is impossble to determine where pads should be
installed. Moreover, pads will reduce the already low ventilation rates in NV houses.
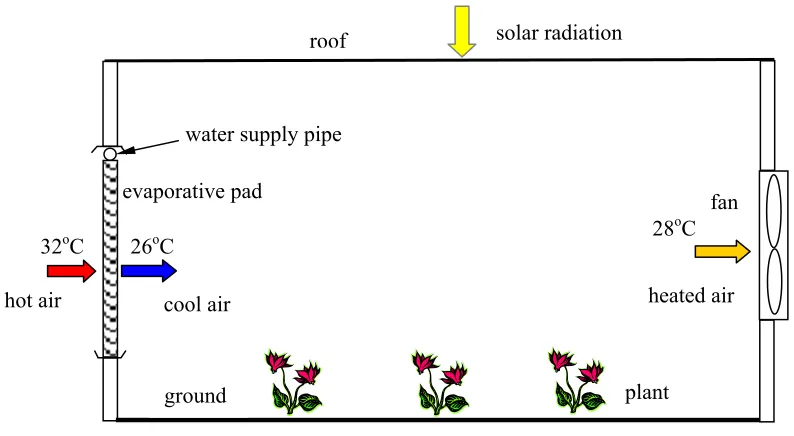
In FV houses, an evaporative pad is generally installed in an end wall and fans are
installed in the opposite wall. A schematic of a fan-and-pad system is shown in Fig.1.1. The
roof
evaporative pad
cool air hot air
fan
ground plant
solar radiation
heated air water supply pipe
28oC
32oC 26oC
Figure 1.1 Schematic of fan and pad systems
Fogging, a second measure of evaporative cooling, cools by spraying fine water
droplets into the air. During the course of drifting or falling, the droplets evaporate partially
or completely, converting some sensible heat of greenhouse air into latent heat. Air
temperature is thus reduced and relative humidity is increased. Based on working pressure,
fogging systems can be classified as low-pressure fogging or high-pressure fogging systems.
Low-pressure fogging systems typically work at the line pressure of city water supply (3-4
atm) without additional pressure boosting. The size of droplets produced by low-pressure
systems is typically 50 to 100 μm. The working pressure of high-pressure systems is much
higher (35-70 atm) than low-pressure systems and high-pressure pumps are typically utilized.
The droplet size produced by high-pressure systems is typically 2 to 60 μm.
Fogging is not as compatible with FV systems as evaporative pads because it is
difficult to keep unevaporated droplets from being blown out of the house through the fan(s).
mature technology, which works very well for most FV houses. There is no reason to use
fogging in FV houses. Fogging is generally used in NV houses since fogging is the only
evaporative cooling technology compatible with NV. A schematic of a fogging system in a
NV greenhouse is given in Fig.1.2.
roof
ground plant
solar radiation
fog nozzle
roof vent
side vent
outflow inflow
inflow or outflow wind direction
Figure 1.2 Schematic of fogging systems in naturally ventilated greenhouses
1.3 Design Limitations
As a principal method for controlling and regulating temperature, selection of the
ventilation system is a key step in designing a greenhouse. Currently, four greenhouse design
guidelines (ASABE, 2003; ACME, 1993; NGMA, 1998; ASHRAE, 1995) are available for
designers in the U.S., but none of the guidelines provide information on the choice of a
ventilation system. The selection of a greenhouse ventilation mechanism is still a practice
based on rule of thumb. An improper choice may waste money and/or expose the crop to
A controlled comparison of the performance of the two ventilation systems is a
pre-requisite for making a sound choice. A literature survey shows that most studies focus on
either NV or FV system (NV examples: Bot, 1983; De Jong, 1990; Lee and Short, 2000;
Wang, 1998; Teitel and Tanny, 1999; Boulard and Baille, 1995. FV examples: Walker, 1965;
Seginer and Livne, 1978; Willits, 2003). There have been essentially no studies on the
comparative performance of the two systems.
1.4 Objectives
To address these problems, this study will focus on the thermal environment (air
temperature, relative humidity and leaf temperature) of two ventilation systems, because
thermal environment is the one of the most important factors that affects plant growth. In
comparing the thermal environment of NV and FV systems, fogging in NV houses and
thermal stratification in FV houses are recognized as two important factors that affect the
comparative performance of NV and FV systems.
1.4.1 Fog Cooling in NV Houses
Fogging was chosen as a focus for this study because in order for NV houses to
compete with FV houses with pads, evaporative cooling must be provided. While evaporative
pads have been studied extensively and the cooling performance is well known, fogging
systems have been less well studied and the cooling performance is poorly known, thus,
fogging in NV houses needs to be better understood and controlled for an effective
comparison of NV and FV houses.
without a control, so it is not possible to isolate the effect of fogging from others such as
weather; 2) almost all of the studies did not consider the more fundamental charateristics of
greenhouse fogging (cooling efficiency and evaporation efficiency), only air temperature and
relative humidity were discussed; 3) the response of leaf temperature to fogging was not
considered in most studies; and 4) the studies focused on either low-pressure or high-pressure
fog, and none of them constrasted them. This study will attempt to address all of these
limitations.
Fogging systems are difficult to control in NV greenhouses, because fog evaporation
efficiency depends on weather conditions and ventilation rate. Since ventilation rate is
dependent on the wind, spray rates are impossible to determine in advance. To resolve the
difficulty, various fog control strategies will be explored and their performance will be
evaluated.
1.4.2 Thermal Stratification in FV Houses
Thermal stratification was chosen as a focus of this study because during the study
comparing NV and FV systems, vertical air temperature gradient in FV houses complicated
the comparison. Given the significant vertical temperature gradient observed, especially at
low ventilation rates, the control computer called for less cooling than required. The result
was that FV houses ended up with higher temperatures than the NV houses, even through the
cooling ability of the FV systems was superior to the NV systems at the time (Willits and Li,
2005).
To find out what the vertical air temperature distribution is and how weather, crop and
evaporative pad cooling affect it, experiments were performed and a model was constructed
1.5 Dissertation Composition
This dissertation consists of eight chapters. Chapters 2 and 3 focus on fogging
systems. In Chapter 2, cooling and evaporation efficiencies are compared for low-pressure
and high-pressure fogging systems in a NV greenhouse. Chapter 3 describes a new control
strategy for high-pressure fog in NV greenhouses. The new strategy, called NCSU control,
along with four existing strategies, were tested in a NV greenhouse. The performance of the
control strategies was evaluated and compared in terms of cooling efficiency, water use, duty
circle of high-pressure pump and leaf wetness duration.
Chapters 4 and 5 focus on thermal stratification in FV greenhouses. In Chapter 4,
observed airflow patterns and thermal stratification in a FV greenhouse are investigated. The
effects of solar radiation, ventilation rate, evaporative cooling and canopy on vertical
temperature profiles are presented. Chapter 5 describes a mechanistic model for the vertical
air temperature gradient in FV houses. Model calibration, verification and simulation results
are presented.
Chapters 6 and 7 compare the environment in NV and FV systems and investigate the
suitability of the two systems in different locations. Chapter 6 examines the spatial and
temporal variation of air temperature, leaf-air temperature difference of NV and FV systems.
The cooling performance of high-pressure fog in a NV system is compared with that of
fan-and-pad systems. Chapter 7 explores the suitability of various cooling technologies-NV, FV
and evaporative cooling (evaporative pad vs. fogging) under various climates using a
simulation model. The effects of evapotranspiration and ventilation characteristics of NV
discussed for the U.S.
Finally, Chapter 8 provides a summary for this study.
References
ACME. 1993. The greenhouse climate control book. ACME Engineering and Manufacturing Corp., Horticulture Division, Muskogee, OK
Arbel, A.; Yekutieli, O.; Barak, M. 1999. Performance of a fog system for cooling greenhouses.
Journal of Agricultural Engineering Research, 72: 129-136
Arbel, A.; Barak, M.; Shklyar, A. 2003. Combination of forced ventilation and fogging systems for cooling greenhouses. Journal of Agricultural Engineering Research, 84(1): 45-55
ASAE. 2003. Heating, ventilating and cooling greenhouses. ANSI/ASAE EP406.2. American Society of Agricultural Engineers, St. Joseph, MI
ASHARE. 1995. Environment control for animals and plants. In: 1995 ASHARE handbook: heating, ventilating and air-conditioning applications. ASHARE, Atlanta, GA
Beytes, C. 2006. What makes Cheshire tick? Grower Talks, 70(5): 80-88
Bot, G.P.A. 1983. Greenhouse climate: from physical processes to a dynamic model. PhD dissertation. Wageningen Agricultural University, Wageningen, Netherlands
Boulard, T.; Baille, A. 1995. Modeling of air exchange rate in a greenhouse equipped with continuous roof vents. Journal of Agricultural Engineering Research, 61:37-48.
De Jong, T. 1990. Natural ventilation of large multi-span greenhouses. PhD dissertation. Agricultural University, Wageningen, Netherlands
Enoch, H.Z. and Enoch, Y. 1999. The history and geography of greenhouse. In: Greenhouse ecosystems. Edited by Stanhill, G. and Enoch, H.Z. Elservier. Amsterdam, Netherlands
Giacomelli, G.; Giniger, M.S.; Krass, A.E. et al. 1985. Improved methods of greenhouse evaporative cooling. Acta Horticulturae. 1974: 49-55
Lee, I.; Short T.H. 2000. Two-dimensional numerical simulation of natural ventilation in a multi-span greenhouse. Transaction of the ASAE, 43(3): 745-753
Kittas, C.; Bartzanas, T.; Jaffrin, A. 2003. Temperature gradients in a partially shaded large
Montero, J.I.; Anton, A.; Biel, C. et al. 1990. Cooling of greenhouses with compressed air fogging nozzles. Acta Horticulturae, 281: 199-209
National Agricultural Statistics Service. 2005.
http://www.nass.usda.gov/Publications/Ag_Statistics/agr05/05_ch4.PDF
NGMA. 1998. Standards for ventilation and cooling greenhouse structures. National Greenhouse Manufacturer Association, Littleton, CO
Noel, J.E. 2005. The U.S. specialty crop industry: significance and sustainability. http://cissc.calpoly.edu/farmbill/USSpecCropIndSigandSust.pdf
Seginer, I; Livne, A. 1978. Effect of ceiling height on the power requirement of forced ventilation in greenhouses. Acta Horticulturae, 87: 51–68
Seginer, I.; Willits, D. H.; Raviv M.; Peet, M. M. 2000. Transpirational cooling of greenhouse crops. BARD Final Scientific Report IS-2538-95R, Bet Dagan, Israel
Teitel, M.; Tanny, J. 1999. Natural ventilation of greenhouses: experiments and model. Agricultural and Forest Meteorology, 96: 59-70Teitel, M. 2005. Personal communication
Walker, J. N. 1965. Predicting temperatures in ventilated greenhouses. Transactions of the ASAE, 8 (3): 445– 448
Wang, S. 1998. Measurement and modeling of natural ventilation in a large scale Venlo-type greenhouse. PhD dissertation. Gembloux, Belgium
Willits, D.H. 2003. Cooling fan ventilated greenhouses: a modeling study. Biosystems Engineering, 84(3): 315–329
Willits, D.H.; Li, S. 2005. A Comparison of naturally ventilated vs. fan ventilated
Chapter 2 Comparing Low-Pressure and High-Pressure
Fogging Systems in Naturally Ventilated Greenhouses
Abstract The cooling performance of low-pressure and high-pressure fogging systems was evaluated.
Two month long experiments were conducted in two empty, naturally ventilated greenhouses under
summer conditions. One greenhouse was used as the treatment greenhouse (fogged house) and the
other was used as the control house (unfogged house). Cooling efficiency was defined as the ratio of
the temperature difference between the unfogged and fogged greenhouses to the difference between
the temperature in unfogged house and the wet bulb temperature in the fogged greenhouse.
Evaporation efficiency was defined as the ratio of evaporation rate to spray rate. Cooling efficiency
and evaporation efficiency were compared for low-pressure and high-pressure systems after
accounting for differences in weather conditions. It is suggested that evaporation efficiency for the
high-pressure system was at least 64% greater than the low-pressure system; cooling efficiency for
the high-pressure system was at least 28% greater than for the low-pressure system on average.
2.1 Introduction
Fogging is one type of evaporative cooling that comes with a myriad of applications
and configurations. Cooling, humidification, and seed propagation are some of the principal
applications in protected horticulture. An important characteristic of fogging systems is the
working pressure, because it determines to a large extent the performance of fogging systems
(size of fog droplets, cooling effect) and the associated costs (installation and operational
costs). Low-pressure fogging systems typically work at the line pressure (3-4 atm) without
requiring additional pressure boosting. The size of droplets produced by low-pressure
systems is typically 50 to 100 μm. The working pressure of high-pressure systems is much
The droplet size produced by high-pressure systems is typically 2 to 60 μm.
High-pressure systems generally provide better cooling than low-pressure systems
since the finer droplets produced by high-pressure systems evaporate faster. However, better
cooling of high-pressure systems comes at the price of much higher initial investment and
operational costs. A quantitative evaluation and comparision of the two fogging systems is
required if a choice is to be made between them.
Previous studies (Walker et al, 1968; Montero et al, 1981; Montero et al, 1990; Giacomelli et al, 1985; Giacomelli and Roberts, 1989; Arbel et al, 1999; Arbel et al, 2003; Ozturk, 2003) focused on one or the other of the two systems, and none of them examined
them in contrast. To rectify this, the current study tested a low-pressure and a high-pressure
fogging system at the same time. Cooling efficiency and evaporation efficiency were
compared after accounting for differences in weather.
2.2 Materials and Methods
2.2.1 Experiment Setup
The experiments were conducted in two naturally ventilated, east-west oriented,
freestanding gutter-connected greenhouses at the Horticultural Field Laboratory of North
Carolina State University, Raleigh, NC (35o47′N; 78o39′W). The greenhouses were 6.4 x 11
m (width by length); the gutter height was 3.45 m and the ridge height was 5.36 m. Three
vents were installed at the north and south sides. The total opening area accounted for 35% of
the ground area. The two greenhouses (NV1 and NV2) shared a common end wall made of
double-polyethelene. Further details can be found in Appendix A.
consisted of 24 nozzles (Black EXL, Dig Corp) configured in three rows (two side rows and
a mid-row) in parallel with the ridge, eight in each row and suspended from the roof
structure. The nozzles in the mid-row were about 5.0 m above the ground and those in the
side rows were about 4.0 m above the ground. Two solenoids controlled the side rows and the
mid row separately. A booster pump maintained the line pressure at 4 atm. Anti-drip devices
at every nozzle prevented dripping once the line pressure dropped below the threshold of 2.4
atm. The nominal flowrate of the nozzles was 3.79 liter per hour.
A high-pressure fogging system was installed in NV1 at the end of the summer of
2005. The system was composed of 24 nozzles (Item #00002, Ecologic Technologies, Inc.)
installed at a height of 2.36 m. The nozzles were configured in seven rows normal to the
ridge, three or four in each row. City water was filtered and decalcified before the pressure
being boosted to 68 atm with a high-pressure pump (Fogco System Inc.). A valve system was
installed, enabling two levels of fogging, each with 12 nozzles. The nominal flowrate was
5.49 liter per hour. Further details can be found in Appendix A.
A computer controlled the fogging on the basis of 15-second intervals. Fog level and
duty cycle (number of 15-second intervals when fog was on during each 10-minute duration)
of the fogging systems were measured. Details of the fog control algorithms can be found in
Appendix A. For this study, both the high-pressure and low-pressure systems were operated
in NV1 (called fogged greenhouse hereafter). The other house, NV2, was used as the control
greenhouse (called unfogged greenhouse hereafter). The high-pressure system was run from
6/04 to 7/3 of 2006. The low-pressure system was run from 7/20 to 8/22 of 2006.
2.2.2 Measurements
enclosures, each containing a type-T thermocouple and humidity sensor (HM50U, Vaisala).
These were mounted in potential canopy area at three heights in each house (Willits et al., 2006). The data were recorded with a CR23X datalogger (Campbell Scientific, Inc., Utah).
Outside dry bulb and wet bulb temperatures, solar radiation, wind speed and direction
were monitored by a weather station located nearby (~26 m north of the test greenhouses)
and recorded by a datalogger (Helios I, Fluke Corporation). All data were recorded as
10-minute averages of 1-10-minute readings.
Three to five low-pressure and high-pressure nozzles were selected and their
flowrates were measured in situ during the experiments. By collecting fog with a cup and measuring the increase in weight during three to five minutes with a digital scale, the actual
flowrates were derived. The spray rate of fogging systems was calculated based on the
measured flowrates of the nozzles, fog level and the duty cycle of fogging.
2.2.3 Data Processing
The dataset included air temperatures and relative humidities in both the fogged
greenhouse and the unfogged greenhouse, outside weather (dry and wet bulb temperatures,
solar radiation, wind speed and direction) and fog spray rate. Inside air temperatures and
relative humidities were averaged for each greenhouse. The inside humidity ratio, enthalpy
and wet bulb temperature were calculated based on the average temperature and relative
humidity. The outside humidity ratio, enthalpy, and specific volume were calculated with the
dry bulb and wet bulb temperatures. The equations by Albright (1991) were used for the
psychrometric calculations.
al., 1991)
, unfog fog cool
unfog wb fog
t t
t t
η = −
− (2.1)
where ηcool is the cooling efficiency of fogging system; is the air temperature in the
unfogged greenhouse,
unfog
t
oC; is the air temperature in the fogged greenhouse, fog
t oC; and
is the web bulb temperature in the fogged greenhouse, ,
wb fog
t oC.
The evaporative efficiency was defined as the ratio of fog evaporation rate to spray
rate, i.e.
ηevap =m me/ (2.2)
where ηevap is the evaporation efficiency; meis the fog evaporation rate, g m-2[floor] s-1; and is the spray rate, g m
m -2[floor] s-1. The fog evaporation rate was
me= ⋅Q
(
ψ ψi− o)
(2.3)where Q is the ventilation rate, m3 m-2 s-1; and i
ψ andψo are the inside and outside water
vapor concentrations, g m-3. Ventilation rate was calculated according to Arbel et al. (1999) as
(
)
(
)
/
i o c g
o
i o
S U t t A A
Q v
h h
τ α
⋅ ⋅ − −
=
− (2.4)
are the inside and outside enthalpies, J kg-1. According to the measurement by Zamir et al. (1969), the product of τ and α was taken as 0.5. The overall heat transfer coefficient, U, was taken to be 4 Wm-2 oC-1 for double-polyethelene covers (ASAE, 2003).
To compare the low-pressure and high-pressure systems on a fair basis, the
differences in weather conditions and spray rate were accounted for using the least square
means procedure in GLM of SAS (SAS Institute Inc., 1989). The evaporation and cooling
efficiencies were regressed against the outside weather and spray rate as linear first-order
functions.
The data from days when extreme weather (storm, windy days) disrupted the
experiment for significant portion of daytime were excluded. The data compromised by
sensor breakdown and human misoperation were also assumed to be invalid and not used.
Details can be found in Appendix B.
2.3 Results and Discussion
2.3.1 Running Examples
2.3.1.1 Low-pressure system
The data from 7/31/2006 are presented to illustrate the effects of the low-pressure
9 10 11 12 13 14 15 16 17 24
26 28 30 32 34 36 38 40 0.2 0.3 0.4 0.5 0.6 0.7
T
emp
eratu
re [
o C]
Hour (EDT)
tunfog
to
tfog
twb,
fog
cooling efficiency
C
ool
ing e
ff
ici
en
cy
Figure 2.1 Cooling efficiency and temperatures for the low-pressure system. Time was Eastern Daylight Time (EDT).
Figure 2.2 shows the relative humidities in the fogged and the unfogged greenhouses
and the outside relative humidity. Relative humidity was increased by 26%, on average, from
41% in the unfogged greenhouse to 67% in the fogged greenhouse due to low-pressure fog. It
is also shown that the inside relative humidity in the fogged greenhouse was greater than the
9 10 11 12 13 14 15 16 17 0.3
0.4 0.5 0.6 0.7 0.8
R
ela
tiv
e h
um
id
ity
Hour (EDT) fogged
outside unfogged
Figure 2.2 Relative humidities in the fogged, unfogged greenhouses and the outside for the low-pressure system. Time was Eastern Daylight Time (EDT).
Figure 2.3 shows the spray rate, ; evaporation rates, m; and evaporation efficiency, η
e
m
evap, i.e. the ratio of evaporation rate to spray rate. The average ηevap during that day was 0.38, indicating 38% of the sprayed fog had contributed to the cooling while 62% of
9 10 11 12 13 14 15 16 17 0.05
0.10 0.15 0.20 0.25 0.30 0.35 0.40 0.20 0.25 0.30 0.35 0.40 0.45 0.50
evaporation rate spray rate
W
ate
r f
low
ra
te
[g
m
-2 s -1 ]
Hour (EDT)
evaporation efficiency
E
vapo
rati
on ef
fic
ienc
y
Figure 2.3 Evaporation efficiency, spray rate and evaporation rate for the low-pressure system. Time was Eastern Daylight Time (EDT).
Descriptive statistics for the low-pressure system are given in Table 2.1. The
experiment encompassed a relatively wide range of outside weather conditions. The average
air temperature reduction caused by the low-pressure fog was 4.3oC; relative humidity
increased by 22% on average.
The average cooling efficiency was 0.42 and the average evaporation efficiency was
39%. The cooling effect observed in this study was much more significant than the previous
related to spray rate.
Table 2.1 Statistics of outside weather, spray rate, environment differences between the fogged and unfogged greenhouses, cooling and evaporation efficiencies for the low-pressure system
Variable Unit Mean Std Dev Min Max
air temp. oC 31.7 2.3 25.9 36.6
solar radiation W m-2 540 206 94 905
RH - 0.55 0.08 0.37 0.78
*
o o
ψ ψ− kg kg-1 0.0143 0.0038 0.0052 0.0239
wind speed m s-1 2.29 0.97 0 5.12
Weather
wind direction degree 240 84 0 360
Spray rate g m-2 s-1 0.334 0.065 0.184 0.402
∆t oC 4.3 1.5 0.7 9.1
∆RH - 0.22 0.06 0.05 0.39
ηcool - 0.42 0.10 0.08 0.70
Performance
ηevap - 0.39 0.09 0.10 0.79
Note: ∆t is the air temperature in the unfogged greenhouse minus that of the fogged greenhouses, i.e. tunfog-tfog; ∆RH is the relative humidity in the fogged greenhouse minus that of the unfogged greenhouses, i.e. RHfog
-RHunfogged.
2.3.1.2 High-pressure system
Data from 6/20/2006 for the high-pressure system are presented in Figs 2.4 to 2.6.
Outside solar radiation that day exceeded 800 Wm-2 and the highest outside air temperature
was over 32 oC. The data for tfog, tunfog, twb,fog and to are shown in Fig.2.4. Comparing tfog with
8 9 10 11 12 13 14 15 16 17 20
22 24 26 28 30 32 34 36 38 0.40 0.45 0.50 0.55 0.60 0.65 0.70 0.75
T
em
perature [
o C]
Hour (EDT) t
unfog t
o t
fog t
wb,fog
cooling efficiency
Cool
ing ef
fic
ien
cy
Figure 2.4 Cooling efficiency and temperatures for high-pressure system. Time was Eastern Daylight Time (EDT).
Figure 2.5 shows the relative humidities in the fogged and unfogged greenhouses and
the outside. The relative humidity in the fogged greenhouse increased by 31% over the
relative humidity in the unfogged greenhouse on average. Figure 2.6 shows the spray rate,
evaporation rate and evaporation efficiency. Evaporation efficiency remained pretty much
constant. The average evaporation efficiency was 72%, indicating that a significant
8 9 10 11 12 13 14 15 16 17 0.2 0.3 0.4 0.5 0.6 0.7 0.8 0.9 R elativ e hum idit y Hour (EDT) fogged outside unfogged
Figure 2.5 Relative humidities in the fogged, unfogged greenhouses and the outside for the high-pressure system. Time was Eastern Daylight Time (EDT).
8 9 10 11 12 13 14 15 16 17
0.05 0.10 0.15 0.20 0.25 0.30 0.35 0.40 0.3 0.4 0.5 0.6 0.7 0.8 0.9 evaporation rate spray rate W ate r f lo w ra te [g m
-2 s
-1 ] Hour (EDT) evaporation efficiency Ev aporat ion ef fic ie nc y
Descriptive statistics for high-pressure system are presented in Table 2.2. The range
of weather conditions for high-pressure fog was wide, with air temperature ranging from 22.4
to 34.6 oC and solar radiation ranging from 219 to 880 Wm-2. The inside air temperature was
reduced by 5.8 oC and relative humidity increased by 29% on average (∆T and ∆RH in Table 2.2). The highest air temperature difference between the unfogged and fogged houses was
10.2 oC. The average cooling and evaporation efficiencies of the high-pressure system were
0.53 and 0.71 respectively.
Comparing the mean cooling efficiency (0.42 vs. 0.53) and evaporation efficiency
(0.39 vs. 0.71) between the low-pressure and high-pressure systems (Tables 2.1 and 2.2)
suggested better cooling performance for the high-pressure system than the low-pressure
system, though this is not a rigorous comparison.
Table 2.2 Statistics of outside weather, spray rate, environment differences between the fogged and unfogged greenhouses, cooling and evaporation efficiencies for the high-pressure system
Variable Unit Mean Std Dev Min Max
air temp. oC 28.7 2.7 22.4 34.6
solar radiation W m-2 630 161 219 880
RH - 0.48 0.10 0.31 0.75
*
o o
ψ ψ− kg kg-1 0.0139 0.0040 0.0047 0.0225
wind speed m s-1 2.68 0.91 0 5.28
Weather
wind direction degree 242 62 0 360
Spray rate g m-2 s-1 0.258 0.071 0.052 0.395
∆T oC 5.8 2.0 1.0 10.2
∆RH - 0.29 0.08 0.08 0.49
ηcool - 0.53 0.11 0.20 0.74
Performance
ηevap - 0.71 0.09 0.37 1.00
Note: ∆t is the air temperature in the unfogged greenhouse minus that of the fogged greenhouses, i.e. tunfog-tfog; ∆RH is the relative humidity in the fogged greenhouse minus that of the unfogged greenhouses, i.e. RHfog
2.3.2 Evaporation Efficiency
The regression of evaporation efficiency for the low-pressure case resulted in
18.08
(
*)
1.97evap o o Q
η = ψ ψ− + (R2=0.95) (2.5)
where *
o
ψ is saturated humidity ratio at to, kg kg-1; *
o o
ψ ψ− is the outside humidity ratio
deficit, kg kg-1. Equation 2.5 suggests that increasing airflow under drier weather will
promote fog evaporation.
The regression for the high-pressure case was
29.74
(
*)
4.83evap o o Q
η = ψ ψ− + (R2=0.96) (2.6)
By observing the coefficients of Eqns 2.5 and 2.6, evaporation efficiency, ηevap, for the high-pressure system should be higher than for the low-pressure system under the same
*
o o
ψ ψ− and Q. Given same ventilation rate Q, evaporation coefficiency, ηevap, for the
high-pressure system will be at least 64% greater than the low-high-pressure system (29.74 vs. 18.08).
Under the same *
o o
ψ ψ− , the evaporation efficiency of high-pressure system would always be
higher than the low-pressure system (4.83 vs. 1.97). The presentations ofηevap in Figs 2.7 and 2.8 give a clear contrast between the two systems and the positive dependences of ηevap on
*
o o
0.000 0.004 0.008 0.012 0.016 0.020 0.024 0.0
0.1 0.2 0.3 0.4 0.5 0.6 0.7 0.8 0.9 1.0
Ev
apora
tion e
ff
ici
ency
ψo*-ψo
high pressure fog low pressure fog
Figure 2.7 Effect of out humidity ratio deficit on evaporation efficiencies of low-pressure and high-pressure systems
0.00 0.02 0.04 0.06 0.08 0.10 0.12 0.14 0.16 0.18 0.20 0.0
0.1 0.2 0.3 0.4 0.5 0.6 0.7 0.8 0.9 1.0
Ev
apora
tion
effi
cien
cy
Ventilation rate [m3 m-2 s-1]
high pressure fog low pressure fog
2.3.3 Cooling Efficiency
Regression of ηcool for the low-pressure case was
1.06 4.2
(
*)
cool m o o
η = + ψ ψ− (R2=0.96) (2.7)
Whereas the regression for the high-pressure case was
1.36 11.2
(
*)
cool m o o
η = + ψ ψ− (R2=0.95) (2.8)
By comparing the coefficients of m in Eqns 2.7 and 2.8, it can be inferred that ηcool of the high-pressure fog will be at least 28% (1.36 vs. 1.06) greater than the low-pressure fog
given the same *
o o
ψ ψ− . Plotting cooling efficiency, ηcool, against m and *
o o
ψ ψ− in Figs 2.9
and 2.10 clearly displayed the relative significance of ηcool of the two systems.
0.00 0.05 0.10 0.15 0.20 0.25 0.30 0.35 0.40 0.45 0.0
0.1 0.2 0.3 0.4 0.5 0.6 0.7 0.8
Co
ol
ing e
ff
ici
en
cy
Spray rate [g m-2 s-1] high pressure fog
low pressure fog
0.000 0.004 0.008 0.012 0.016 0.020 0.024 0.0
0.1 0.2 0.3 0.4 0.5 0.6 0.7 0.8
C
ool
ing ef
fici
ency
ψ
o*-ψo
high pressure fog low pressure fog
Figure 2.10 Effect of outside humidity ratio deficit on the cooling efficiency of low-pressure and high-pressure systems
2.4 Conclusions
Experiments were performed with low-pressure and high-pressure fogging systems in
naturally ventilated greenhouses. The cooling and evaporation efficiencies of the two systems
were compared. High-pressure system had evaporation efficiencies at least 64% higher than
low-pressure system. The cooling efficiencies of high-pressure system were at least 28%
higher than low-pressure system.
Nomenclature
Ac greenhouse cover area, m2
Ag greenhouse ground area, m2
e
m fog evaporation rate, g m-2[floor]s-1
Q ventilation rate, m3 m-2[floor] s-1
RHfog relative humidity in the fogged greenhouse
RHunfog relative humidity in the unfogged greenhouse
S outside solar radiation, W m-2
ti inside dry bulb air temperature, oC
to outside dry bulb air temperature, oC
unfog
t air temperature in the unfogged greenhouse, oC
fog
t air temperature in fogged greenhouse, oC
, wb fog
t web bulb temperature inside the fogged greenhouse, oC
U overall heat transfer coefficient of greenhouse cover, W m-2 oC-1
∆RH relative humidity difference between the fogged and unfogged greenhouses,
∆RH= RHfog- RHunfog
∆t air temperature difference between the unfogged and fogged greenhouses,
oC, ∆t=tunfog-t fog
vo specific volume of the outside air, m3 kg-1
α percentage of inside solar radiation converted to enthalpy of greenhouses
ηevap fog evaporation efficiency
ηcool cooling efficiency of fog
τ solar radiation transmissivity of greenhouse cover
i
ψ inside humidity ratio, kg m-3
o
ψ outside humidity ratio, kg m-3
* o
References
Albright, L.D.1990. Environment control for animals and plants. American Society of Agricultural Engineers, St. Joseph, MI
Arbel, A.; Yekutieli, O.; Barak, M. 1999. Performance of a fog system for cooling greenhouses.
Journal of Agricultural Engineering Research, 72: 129-136
Arbel, A.; Barak, M.; Shklyar, A. 2003. Combination of forced ventilation and fogging systems for cooling greenhouses. Journal of Agricultural Engineering Research, 84(1): 45-55
ASAE. 2003. Heating, ventilating and cooling greenhouses. ANSI/ASAE EP406.2. The American Society of Agricultural Engineers, St. Joseph, MI
Bottcher, R.W.; Baughman, G.R.; Gates, R.S. et al. 1991. Characterizing efficiency of misting systems for poultry. Transactions of the ASAE, 34(2): 586-590
Giacomelli, G.; Giniger, M.S.; Krass, A.E. et al. 1985. Improved methods of greenhouse evaporative cooling. Acta Horticulturae, 1974: 49-55
Giacomelli, G.; Roberts, W. 1989. Try alternative methods of evaporative cooling. Acta Horticulturae, 257: 29-30
Li, S.; Willits, D.H.; Yunker, C. 2005. Experimental study of low pressure fogging system in naturally ventilated greenhouses. Paper No. 05-4139, American Society of Agricultural and Biological Engineers, St. Joseph, MI
Li, S.; Willits, D.H.; Yunker, C. 2006. Experimental study of a high-pressure fogging system in naturally ventilated greenhouses. Acta Horticulturae, 719: 393-400
Montero, J.I.; Short, T.H.; Curry, R.B. et al. 1981. The influence of various water evaporation systems in the greenhouse environment. Paper No. 81-4027, American Society of Agricultural Engineers St. Joseph, MI
Montero, J.I.; Anton, A.; Biel, C. et al. 1990. Cooling of greenhouses with compressed air fogging nozzles. Acta Horticulturae, 281: 199-209
Ozturk, H.H. 2003. Evaporative cooling efficiency of a fogging system for greenhouses. Turk. J. Agric. For., 27: 49-57
Walker, J.N.; Cotter, D.J. 1968. Cooling of greenhouses with various water evaporative systems.
Transactions of the ASAE, 11(1): 116-119
Willits, D.H.; Teitel, M.; Tanny, J.; Peet, M.M.; Cohen, S.; Matan, E. 2006.Comparing the
performance of naturally ventilated and fan ventilated greenhouses. BARD Final Scientific Report US-3189-01, Bet Dagan, Israel
Chapter 3 Control Strategies for High-Pressure Fog in
Naturally Ventilated Greenhouses
Abstract A control strategy (NCSU control) was proposed to control both the pump and the vents in
a high-pressure fog system for naturally ventilated greenhouses. The control strategy uses enthalpy
(inside, outside and target) to determine vent configurations, and humidity ratio to control the
high-pressure pump. NCSU control and four other control strategies were tested in a naturally ventilated
greenhouse under summer conditions. Evaporation efficiency, cooling efficiency, cycle frequency of
the high-pressure pump, leaf wetness duration, and water use were compared for the five control
strategies. The results suggested that: 1) NCSU control and the one based on temperature and relative
humidity resulted in higher cooling efficiencies than the others; 2) manipulating vents properly to
regulate airflow resulted in less cycling of the high-pressure pump than keeping vents at fixed
configurations; 4) control by vapor pressure deficit is a simple and effective way to reduce leaf
wetting; 5) NCSU control was highly accurate in simultaneously controling the air temperature and
relative humidity.
3.1 Introduction
Previous research has shown that high-pressure fogging can have a significant
cooling effect in greenhouses (Arbel et al., 1999; Li et al., 2006). However, its application in commercial greenhouses is limited, possibly due to technical difficulties and side effects.
One difficulty is spray rate control, which is complicated, because it is difficult to determine
how much fog should be applied, especially for naturally ventilated greenhouses. Fogging
also causes wetting problems and improper control makes the wetting problem worse.
Excessive fog will wet the plants, ground and indoor equipment, increasing the chance of
and disease development are attributable to the amount of free water on foliage (Lindquist et al., 1987; Peece, 1971; Hall and Burges, 1979). To overcome these difficulties in determing spray rate and mitigate the side effects, technically sound fog control is required. Ideally,
control should be able to maintain inside temperature and/or humidity at desired levels. In
addition, minimal water and electricity should be consumed to reduce operational costs. Also,
the high-pressure pump and vents should not cycle too frequently or excessively to minimize
equipment wear.
Several control strategies are used in practice and/or have been studied. One control
strategy uses thermostats and humidistats to control pump activity. The logic of the control is
simple: when inside temperature is higher than setpoint and humidity is lower than setpoint,
the pump will be turned on and fogging will be started, otherwise the pump will stay off.
Handarto et al. (2006) proposed a second control strategy. They developed an algorithm that determined the required spray rate based on the inside humidity ratio, target
humidity ratio and ventilation rate. The target humidity ratio was determined based on inside
wet bulb temperature and target relative humidity. The ventilation rate was determined by
dividing the solar radiation absorbed by greenhouse with the difference between inside and
outside enthalpies.
A third method uses vapor pressure deficit (VPD) as the control variable and
maintains VPD at a preset level. The idea behind this is to maintain sufficient potential for
fog evaporation and plant transpiration. With a VPD large enough, fog droplets will
evaporate efficiently and the physiological processes associated with transpiration will not be
One of the limitations of the first three controls is that only one variable (temperature,
relative humidity or VPD) can be controlled. It was impossible to control more than one
variable simultaneously because the pump was the only control action involved, i.e., vent
configuration was fixed.
A fourth control, described by Sase et al. (2006) controlled the pump with temperature and the vents with relative humidity. The algorithm was tested in a greenhouse
and demonstrated the possibility of keeping both temperature and relative humidity within
the desired range.
A fifth control strategy, NCSU control, is proposed as an alternative to the previous
controls. In this control, the vent configuration will be changed to regulate the inside
enthalpy. The spray rate will be controlled to get the desired humidity ratio. By manipulating
the vent configuration and spray rate, the inside temperature and relative humidity can be
controlled simultaneously.
The objective of this study is to test the five control strategies described above. Their
performance will be evaluated and compared, and their limitations and strengths will be
identified.
3.2 Materials and Methods
3.2.1 Facilities
The two greenhouses used in this study were located on the campus of North Carolina
State University in Raleigh, NC. They were naturally ventilated, double-polyethylene
covered and east-west oriented. The size of the greenhouses was 6.4 by 11m; the gutter