3D analysis of upper limbs motion during
rehabilitation exercises using the Kinect
TM
sensor:
development, laboratory validation and clinical
application
Bruno Bonnechère1,2,3*, Victor Sholukha1,4, Lubos Omelina2,3,5, Serge Van Sint Jan1and Bart Jansen2,3
1 Laboratory of Anatomy, Biomechanics and Organogenesis (LABO), Université Libre de Bruxelles, Brussels,
Belgium
2 Department of Electronics and Informatics – ETRO, Vrije Universiteit Brussel, Brussels, Belgium
3 imec, Leuven, Belgium
4 Department of Applied Mathematics, Peter the Great St.Petersburg Polytechnic University (SPbPU), Russia
5 Institute of Computer Science and Mathematics, Slovak University of Technology, Bratislava, Slovakia
* Correspondence: [email protected]; Tel.: +32-2-555-6262
Abstract: Optoelectronic devices are gold standard for 3D evaluation in clinics but due to the complexity of such kind of hardware and the lack of access for patients affordable, transportable and easy to use systems must be developed to be largely used in daily clinics. The KinectTMsensor presents various advantages compared to optoelectronic devices: price, transportability but also some limitations: (in)accuracy of the skeleton detection and tracking as well as the limited amount of available points that make 3D evaluation impossible. To overcome these limitations a novel method has been developed to perform 3D evaluation of the upper limbs. This system is coupled to rehabilitation exercises allowing functional evaluation while performing physical rehabilitation. To validate this new approach a double step method was used. The first step is a laboratory validation where the results obtained with the KinectTMhave been compared with results obtained with an optoelectronic device, 40 healthy young adults participated in this first part. The second step was to determine the clinical relevance of such kind of measurement. Results of the healthy subjects were compared with a group of 22 elderly adults and a group of 10 chronic stroke patients to determine if different patterns can be observed. The new methodology and the different steps of the validations are presented in this paper.
Keywords:Kinect; validation; assessment; functional evaluation; shoulder; markerless system
1. Introduction
Since the release of the first version of the KinectTM(Kinect) sensor at the end of 2010, researchers and clinicians have directly felt the possible potential of this device. Lots of studies have been done in order to validate this device as a Markerless System (MLS) for various uses (e.g. motion analysis, posture analysis, feedback during rehabilitation exercises,etc.) [1–7].
Interesting results have been found in term of accuracy (compared to gold standard Marker-Based System [MBS]) and especially in term in precision (reproducibility has been found higher for Kinect compared to MBS used PiG like ViconTMprotocol) [3].
3D motion analysis using MBS is considered as Gold Standard for clinical motion analysis even if several issues have been previously raised and discussed in the literature. Accessibility of MBS is an issue due to the costs of such systems, and therefore only specialized centers can afford them. Furthermore, marker placement (i.e., time consuming and potential source of error [8]) and skin displacement during motion are two recognized problems within the MBS field [9].
Several studies have previously studied the use of the Kinect V1 as MLS for upper limb evaluation to assess reachable workspace on healthy subjects [10], on patients suffering from fascioscapulohumeral muscular dystrophy [11] and patients with Duchenne muscular dystrophy [12]. Another study compared simple planar motions (shoulder abduction and elbow flexion) and found good correlations with MBS results [4]. Since movement speed control is important in various neurological conditions, others have investigated the ability of the Kinect to detect arm movement speed on healthy subjects and obtained good results after applying some filtering algorithms[13].
Due to the interaction between the camera and the infrared signals from MBS it is not possible to perform comparison between Kinect V2 and MBS (using passive markers). However research has been done to compare the two generations of Kinect for object detection the results were better for the second generation of Kinect especially when the distance between the object and the camera increases [14]. The use of Kinect V2 to assess upper limb mobility or function has also been extensively studied. Authors found that 3D evaluation of shoulder ranges of motion were significantly more precise and with narrow limits of agreement than the measurements of trained observers (clinicians), 1670 measurements were analyzed [15]. Another study compare the results of the Kinect, a MBS and goniometry for range of motion and motion smoothness. Kinect resulted in very good agreement of ROM measurement (r > 0.9) with the 3D motion analysis compared with goniometry. Kinect also showed a good correlation and agreement of measurement of motion quality parameters compared with the 3D motion analysis [16]. As explained above the measurements were not taken at the same time which makes comparisons difficult.
Despite these promising results some issues still need to be solved in order to fully use this MLS in daily clinical practice and for unsupervised remote data collection by patient at home.
Due to the information provided by the Kinect SDK: a simple skeleton model composed by 20 points for the old Kinect (Kinect 360) and 25 points for the new generation of Kinect (Kinect One) it is not possible to directly obtained three-dimensional joint orientation pose. Another issue related to motion analysis is the different conventions used (e.g. Euler’s sequences, Orientation Vector Position) making comparison and interpretation of the results difficult [17].
Some solutions have been proposed to increase the quality of the results such a fusing the data from the Kinect and accelerometers [18], modifying the placement of the sensor according to the type of measurements [19,20], fuse the data form multiple Kinect [21] or develop new algorithms of skeleton detection based on raw data [22].
The aim of this study is to present an advanced (PiG like ViconTM) MLS model [23] and a new method for motion analysis based on joint trajectories complementary to joint angles during rehabilitation exercises using a single Kinect camera. Previous studies has shown that the Kinect sensor could be used to follow patients’ evolution during rehabilitation exercises [24,25]. Such kind of evaluation, done during the rehabilitation, has many advantages; (i) done in the natural environment of the patient (it is known that patients are not exhibiting the same performance when there are wearing underwear in a gait laboratory), (ii) when patients are immerged in the games they are less focused on the motion and on pain and can reach larger amplitudes than when there are asked to perform one particular motion, (iii) time saving and (iiii) financially beneficial (the devices are affordable and since the evaluation is done within the therapy session there is no dual pricing) [26].
The different steps of the development of this method, the laboratory validation (i.e. comparison with gold-standard optoelectronic device) and clinical validation are presented in this paper. Results of this new method are easier to interpret and could be therefore used in clinics and at home to assess patients status and monitor follow up.
2. Methods
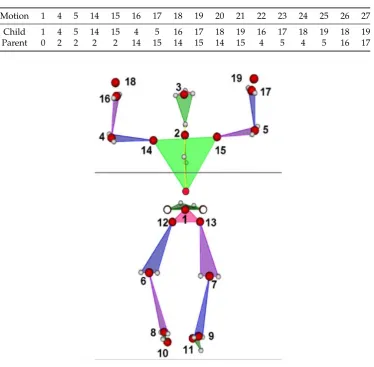
Table 1. Relative coordinate systems topology for child LCSs origin motion relative to parent LCSs evaluation for upper limbs assessment. 0 corresponds to GCS. Point numbers are presented inFigure 1
Motion 1 4 5 14 15 16 17 18 19 20 21 22 23 24 25 26 27
Child 1 4 5 14 15 4 5 16 17 18 19 16 17 18 19 18 19
Parent 0 2 2 2 2 14 15 14 15 14 15 4 5 4 5 16 17
Figure 1.Joint center estimation from the Kinect (red circle), reconstructed PiG like data (transparent 34 circles) and nineteen local coordinate system origins (indicated by numbers)
linked together by a line representing human segments) for visualization and motion analysis. The major lack of this approach is the inability of allowing anatomically correct descriptions of the joint angular motion according to todays clinical conventions [17]. An algorithm developed to extend the crude model provided by the Kinect containing several steps was previously developed and validated [23]
Each link size could be corrected based on the assumption that the raw stick-based model supplies proper line orientation. Starting from the native thorax stick model one can substitute the spatial location of extremity joints, and therefore segment size, by processing each link sequentially from the root (e.g., thoracic segment) to the end joint (shoulder, then elbow and finally wrist joint).
In total 19 local coordinate systems (LCS), following ISB recommendations [27] for axis orientation, were located in the origins indicated by numbers (1-19) inFigure 1. Then 33 LCSs origin motions relative to parent LCSs (Table 1)
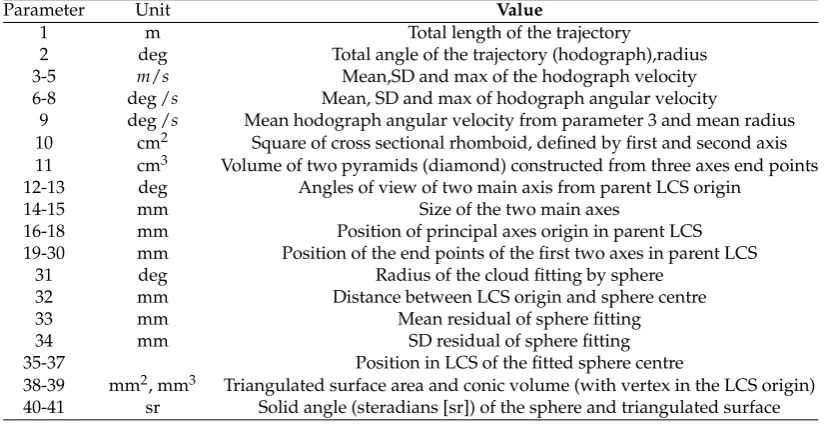
Table 2.List of parameters evaluated for trajectory analysis
Parameter Unit Value
1 m Total length of the trajectory
2 deg Total angle of the trajectory (hodograph),radius 3-5 m/s Mean,SD and max of the hodograph velocity 6-8 deg /s Mean, SD and max of hodograph angular velocity
9 deg /s Mean hodograph angular velocity from parameter 3 and mean radius 10 cm2 Square of cross sectional rhomboid, defined by first and second axis 11 cm3 Volume of two pyramids (diamond) constructed from three axes end points 12-13 deg Angles of view of two main axis from parent LCS origin
14-15 mm Size of the two main axes
16-18 mm Position of principal axes origin in parent LCS 19-30 mm Position of the end points of the first two axes in parent LCS
31 deg Radius of the cloud fitting by sphere 32 mm Distance between LCS origin and sphere centre
33 mm Mean residual of sphere fitting
34 mm SD residual of sphere fitting
35-37 Position in LCS of the fitted sphere centre
38-39 mm2, mm3 Triangulated surface area and conic volume (with vertex in the LCS origin) 40-41 sr Solid angle (steradians [sr]) of the sphere and triangulated surface
the first axis and radius vector of the principal axes origin. The last axis direction is the right hand perpendicular to the first two. The size of each axis finally was defined by min/max points distance estimated from projection on axis the trajectory cloud. Then thirty two (numbered from 10 to 41) additional trajectory shape definition parameters were evaluated (Table 2). Those 41 parameters are computed using the following equations.
Trajectories data are defined in LCS by sequence ofNpoints with frequency f (e.g; f =30s−1) by pi= [pix,piy,piz],i=1, ...,N (1)
The point instantaneous absolute velocity value (||...||is Euclidean norm) and the total velocity (1xN) matrix are given by
vi=||[vix,viy,viz]|| (2)
V= [v1, ...,vN] (3)
The current length of the trajectory (travel) corresponds toLN
Li = i−1
∑
k=1
||pk+1−pk||,i=2, ...,N (4)
The scalar motion parameters for the hodograph velocity are obtained with
VMean= 1
N
N
∑
k=1
vk (5)
Vstd = (
1 N−1
N
∑
k=1
(vk−VMN)2) 1
2 (6)
The total area of the trajectory reached by each joint is given by Eq.8 whereSi,i=1, ...,N−1 is
the area of the triangle defined by three points[o,pi,pi+1]
∆N = N−1
∑
i=1
Si (8)
The angle between two rays[pi,pi+1]is obtained by Eq.9 wherehi=2Si/||pi||
αi =arcsin(|| hi
pi+1||
) (9)
From there the total angular travel (in degrees) is obtained with
AN= 180
π
N−1
∑
i=1
αi (10)
The angular velocity instant value and the total angular velocity(1XN−1)matrix are given by Eq. 11 and 12 respectively
ωi =
180 πfαi
(11)
Ω= [ωi, ...,ωN−1] (12)
From Eq.12 the mean, standard deviation and maximum angular velocity are easily obtained (ΩMean,Ωstd,ΩMax)
The mean (central) point of the cloud is given by
pMean= 1
N
N
∑
k=1
pk (13)
and the centered point coordinate is
qi =pi−pMean (14)
The instantaneous inertia matrix is obtained with Eq.15 and the total cloud inertia matrix by Eq.16
Ii =EqiqTi −qTi,E=diag(1) (15)
I= N
∑
i=1
Ii (16)
Then using SVD a main first principal axis is obtained
G1= [G1x,G1y,G1z]T,||G1||=1 (17)
Two additional orthogonal axis can be obtained using Eq.18 and 19 where c is normalized (unit) vector withCx,Cy,Czprojections.
c= c
||c||, ˜c=
0 −cz cy
cz 0 −cx
−cy cx 0
(18)
G2=p˜MeanG1/||p˜MeanG1|| (19)
˜
c, ˜p, ˜Gare skew-symmetric matrix representation for using in matrix shape of vector cross product. A(3x3)orientation matrix is obtained with Eq.20 and a(Nx3)projection matrix ofq1on its axis
with Eq.21
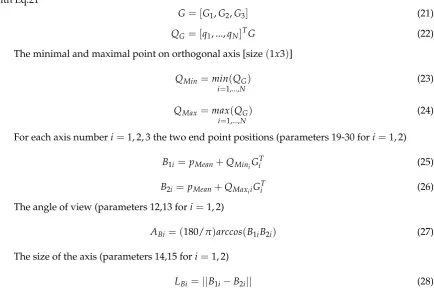
G= [G1,G2,G3] (21)
QG = [q1, ...,qN]TG (22)
The minimal and maximal point on orthogonal axis [size(1x3)]
QMin=min(QG) i=1,...,N
(23)
QMax =max(QG) i=1,...,N
(24)
For each axis numberi=1, 2, 3 the two end point positions (parameters 19-30 fori=1, 2)
B1i= pMean+QMiniGTi (25)
B2i =pMean+QMaxiiGiT (26)
The angle of view (parameters 12,13 fori=1, 2)
ABi = (180/π)arccos(B1iB2i) (27)
The size of the axis (parameters 14,15 fori=1, 2)
LBi =||B1i−B2i|| (28)
The surface area of the rhomboid defined by the end points of the first and second axis (parameter 10) is given by Eq. 28.
Smid =LB1LB2/2 (29)
The volume of the diamond defined by six end points is finally obtained (parameter 11).
Vol=SmidLB3/3 (30)
3. Laboratory validation
3.1. Participants
Forty healthy adults (24±6 years old, 172±8 cm height, 68±10 kg weight, 23±3 kg/m2 BMI, 18 women) were recruited to participate to this study. This study was approved by the Ethical Committee of the Erasme Hospital (EudraCT / CCB : B406201215142) and written informed consent was obtained from all subjects prior to their participation.
3.2. Material
The MLS sensor (Kinect v1) was placed on a tripod at 1.5 m above the floor. Subjects stood at 2.5 m from the camera; this distance was found to provide optimal results in a previous study [3]. Subjects were in underwear to allow reliable placement of the markers for the MBS analysis taking place simultaneously. The Kinect v2 could not be used due to the interference between the projected speckle pattern and the infrared signals from the MBS [14].
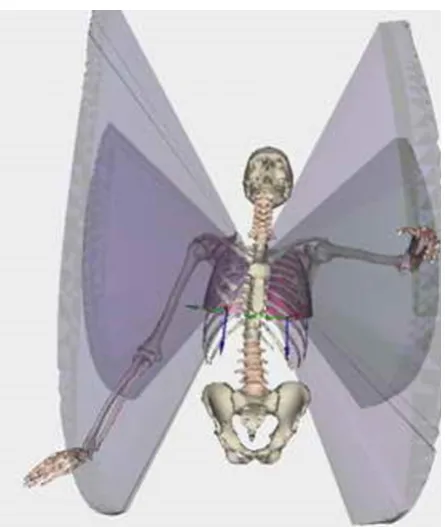
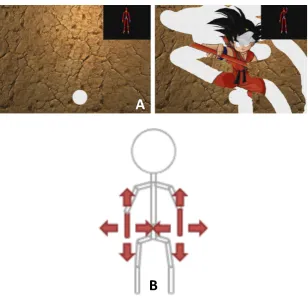
Figure 2.Example of visualization of results obtained from the rehabilitation game. Visualization is performed here using LHPFusionBox for a limited sets of parameters (i.e., volumetric parameters for wrist and elbow by point trajectory triangulation). The reachable volume is clearly visible, but no direct quantification (i.e., score) is available.
MBS data were simultaneously collected from a state-of-the-art stereophotogrammetric system (Vicon, 8 MXT40s cameras, Vicon Nexus software, frequency: 90Hz) that tracks the spatial trajectories of the reflective markers set on the subjects. A modified Plug-in Gait (PiG) model has been adopted. Next to the usual PiG markers, markers have been set on the medial epicondyle of the humeral and femoral bones. Thirty four markers were positioned by the same observer during the entire study. The image frame rate used was equal to 30 fps for the MLS. MLS data were collected with a laptop (Sony Vaio SVF15323CXB, 1.6 GHz Intel Core i5-4200U, 6 GB DDR3L SDRAM, 750 GB (5400 rpm) SATA Hard Drive).
3.3. The Serious Games
Participants played 1 mini-game specially developped for the physical rehabilitation: the Wipe Out [29]. The player has to clean the screen covered of mud using a tissue controlled by medio-lateral and inferior-superior displacements of the wrist relative to the trunk. Participants were asked to play three repetitions of the games. Motions were simultaneously recorded with the MBS and the MLS.
3.4. Data processing and statistics
Figure 3.The three calibration poses: A "T-pose", B "Wide pose", C "Upright pose".
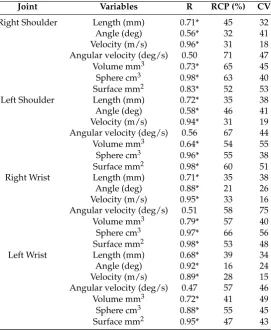
Table 3. Comparison between the optoelectronic (MBS) and the Kinect (MLS) system; R is Pearson Coefficient Correlation, RCP is the Reproducibility Coefficient expressed in percent of the values, CV is the Coefficient of Variation.
Joint Variables R RCP (%) CV
Right Shoulder Length (mm) 0.71* 45 32
Angle (deg) 0.56* 32 41
Velocity (m/s) 0.96* 31 18 Angular velocity (deg/s) 0.50 71 47
Volume mm3 0.73* 65 45
Sphere cm3 0.98* 63 40
Surface mm2 0.83* 52 53
Left Shoulder Length (mm) 0.72* 35 38
Angle (deg) 0.58* 46 41
Velocity (m/s) 0.94* 31 19 Angular velocity (deg/s) 0.56 67 44
Volume mm3 0.64* 54 55
Sphere cm3 0.96* 55 38
Surface mm2 0.98* 60 51
Right Wrist Length (mm) 0.71* 35 38
Angle (deg) 0.88* 21 26
Velocity (m/s) 0.95* 33 16 Angular velocity (deg/s) 0.51 58 75
Volume mm3 0.79* 57 40
Sphere cm3 0.97* 66 56
Surface mm2 0.98* 53 48
Left Wrist Length (mm) 0.68* 39 34
Angle (deg) 0.92* 16 24
Velocity (m/s) 0.89* 28 15 Angular velocity (deg/s) 0.47 57 46
Volume mm3 0.72* 41 49
Sphere cm3 0.88* 55 45
Surface mm2 0.95* 47 43
* Statistically significant correlation (p<0.05)
3.5. Results of the laboratory validation
Due to space restriction only some results are presented and will be discussed.
For upper limbs analysis up to 328 parameters can be obtained (4 joints x 2 sides x 41 parameters) Results of the 7 selected parameters for the relative displacements of elbow relative to shoulder (“shoulder”, points 4 and 5 inFigure 1) and wrist relative to shoulder (“wrist”, points 16 and 17 in Figure 1) for right and left sides are presented inTable 3.
All the parameters, except the angular velocity (mean R = 0.51 for the 4 joints), presented good correlation between results of the MLS and the MBS. On the other side the best results in term of correlation, RCP and CV are obtained for the velocity (expressed in m/s not in degrees).
For both shoulders and wrists better results are obtained for the total length of the trajectory, the total angle and the mean velocity.
Although good correlations are found for parameters related to the reaching area (i.e. volume, sphere and surface) lower RCP and CV are found for those one.
4. Clinical validation
4.1. Participants
Three groups of subjects and patients were tested in order to evaluate the clinical relevance of the newly developed evaluation method:
• Adults: Sixteen healthy young adults (results of the laboratory validation were used)
• Elderly: Seventeen patients (79±5 years old) hospitalized in a geriatric department were included in the study. This study was approved by the local ethical committee of Erasme Hospital (Eudract: B406201628246) and informed consent was obtained from the patients prior to their participation.
• Stroke: 10 patients with chronic stroke (73±8years old) participated in this study. This study was approved by the Ethical Committee of the Erasme Hospital (EudraCT: B406201526116) and informed consent was obtained from the patients prior to their participation.
4.2. Data processing and statistics
Each participant played three repetitions of the games. The different scores and parameters described here above have been computed for the three groups. The mean of the results ok three repetitions of the games were computed for statistical analysis. Normality of the data was checked using the Shapiro-Wilk test. Mean values and standard deviations were calculated. One Way Analysis of Variance (ANOVA) were used to compared the groups, post-hoc analysis were done using the Bonferroni procedure.
4.3. Results of the clinical validation
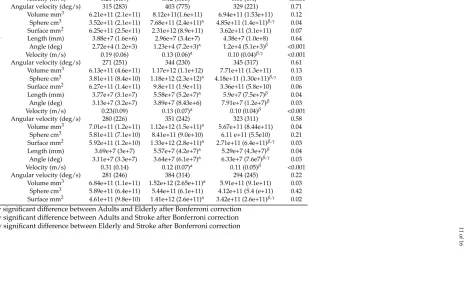
Mean results of the three groups ans statistics are presented in Table4. The same parameters as during the clinical validation are presented.
Concerning the shoulders, no statistically significant difference was found for the length but highly significant differences for both the total angle, the velocity for young adults and elderly and stroke patients. The only parameters that can differentiate the three groups, based on relative motion of the elbow relative to the shoulder, is the volume of the sphere.
11
of
16
Table 4.Mean (std) results of the studied variables for the three groups, P-Value are the results of the ANOVA
Joint Variables Adults Elderly Stroke P-Value
Right shoulder Length (mm) 3.81e+7 (3.7e+7) 3.64e+7 (9.1e+6) 5.71e+7 (1.89e+7) 0.21 Angle (deg) 2.95e+4 (1.3e+3) 1.12e+4 (7.2e+3)α 1.11 (5.2e+3)β <0.001
Velocity (m/s) 0.21 (0.09) 0.12 (0.06)α 0.10 (0.4)β <0.001
Angular velocity (deg/s) 315 (283) 403 (775) 329 (221) 0.71 Volume mm3 6.21e+11 (2.1e+11) 8.12e+11(1.6e+11) 6.94e+11 (1.53e+11) 0.12 Sphere cm3 3.52e+11 (2.1e+11) 7.68e+11 (2.4e+11)α 4.85e+11 (1.4e+11)β,γ 0.04
Surface mm2 6.25e+11 (2.5e+11) 2.31e+12 (8.9e+11) 3.62e+11 (3.1e+11) 0.07 Left Shoulder Length (mm) 3.88e+7 (1.6e+6) 2.96e+7 (3.4e+7) 4.38e+7 (1.0e+8) 0.64 Angle (deg) 2.72e+4 (1.2e+3) 1.23e+4 (7.2e+3)α 1.2e+4 (5.1e+3)β <0.001
Velocity (m/s) 0.19 (0.06) 0.13 (0.06)α 0.10 (0.04)β,γ <0.001
Angular velocity (deg/s) 271 (251) 344 (230) 345 (317) 0.61 Volume mm3 6.13e+11 (4.6e+11) 1.17e+12 (1.1e+12) 7.71e+11 (1.3e+11) 0.13 Sphere cm3 3.81e+11 (8.4e+10) 1.18e+12 (2.3e+12)α 4.18e+11 (1.30e+11)β,γ 0.03
Surface mm2 6.27e+11 (1.4e+11) 9.8e+11 (1.9e+11) 3.36e+11 (5.8e+10) 0.06 Right Wrist Length (mm) 3.77e+7 (3.1e+7) 5.58e+7 (5.2e+7)α 5.9e+7 (7.5e+7)β 0.04
Angle (deg) 3.13e+7 (3.2e+7) 3.89e+7 (8.43e+6) 7.91e+7 (1.2e+7)β 0.03
Velocity (m/s) 0.23(0.09) 0.13 (0.07)α 0.10 (0.04)β <0.001
Angular velocity (deg/s) 280 (226) 351 (242) 323 (311) 0.58 Volume mm3 7.01e+11 (1.2e+11) 1.12e+12 (1.5e+11)α 5.67e+11 (8.44e+11) 0.04
Sphere cm3 5.81e+11 (7.1e+10) 8.41e+11 (9.0e+10) 6.11 e+11 (5.5e10) 0.21 Surface mm2 5.92e+11 (1.2e+10) 1.33e+12 (2.8e+11)α 2.71e+11 (6.4e+11)β,γ 0.03
Left Wrist Length (mm) 3.69e+7 (3e+7) 5.57e+7 (4.2e+7)α 5.29e+7 (4.3e+7)β 0.04
Angle (deg) 3.11e+7 (3.3e+7) 3.64e+7 (6.1e+7)α 6.33e+7 (7.6e7)β,γ 0.03
Velocity (m/s) 0.31 (0.14) 0.12 (0.07)α 0.11 (0.05)β <0.001
Angular velocity (deg/s) 281 (246) 384 (314) 294 (245) 0.22 Volume mm3 6.84e+11 (1.1e+11) 1.52e+12 (2.65e+11)α 5.91e+11 (9.1e+11) 0.03
Sphere cm3 5.89e+11 (6.4e+11) 5.44e+11 (6.1e+11) 4.12e+11 (5.4 (e+11) 0.42 Surface mm2 4.61e+11 (9.8e+10) 1.41e+12 (2.6e+11)α 3.42e+11 (2.6e+11)β,γ 0.02
αStatistically significant difference between Adults and Elderly after Bonferroni correction βStatistically significant difference between Adults and Stroke after Bonferroni correction γStatistically significant difference between Elderly and Stroke after Bonferroni correction
doi:10.20944/preprints201805.0435.v1
Peer-reviewed version available at
Sensors
2018
,
18
, 2216;
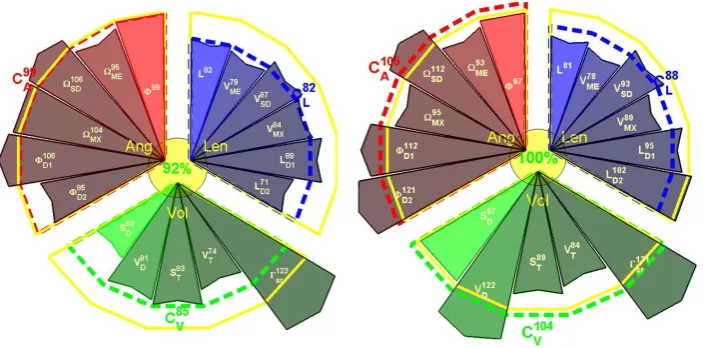
Figure 5. Example of scoring visualization for Right and Left upper limbs from selected motion scoring. The scoring was obtained from the 17 parameters defined above. Parameters are grouped per angular (Ang, in red), length (Len, in blue) and volumetric (Vol, in green) properties. Yellow contour corresponds to 100% (healthy group comparison). Parameter sign values are explained in the
Table 2. Score for each group and total score are depicted near the sector of the group and in the center respectively.
5. Discussion
3D evaluation of the upper limbs is still a complex task in clinics: non-cyclic motions, various degrees of freedom, different conventions for presenting the results or processing methods [17,27], etc. The availability of the KinectTM sensor, or other 3D camera (e.g. Orbbec Astra ProTM, Asus
Xtion sensorsTM), and other affordable devices (e.g. multiple RGBD cameras [30]), coupled to the development and the use of serious games in physical rehabilitation [31] offers new perspective for long term evaluation and follow up during rehabilitation.
It is indeed possible to track and analyze motions performed by the patients during serious games exercises [32]. However, there are still some problems to solve in order to get relevant information to provide feedback for both patients and clinicians. Compared to most used motion analysis in clinic: the gait analysis, the data collected during serious games rehabilitation exercises are usually: longer (mini-games is approximately 1 minute, gait analysis is only focusing on a few steps), non-cyclic (gait cycle are normalized by step), free motions (patients need to perform a task but they can use different strategies [e.g. shoulder or elbow]). Therefore it is not possible to average and normalize the motions performed by the patients and analyzing only the ranges of motion is too restrictive to summarize one to two minutes exercises.
Two solutions are possible to get relevant information from the rehabilitation exercises:
The first one is to analyze the performance of the patients within the games [33]: time required to finish, number or successes, failures, precision etc. Although those parameters are relevant in clinics, they are only an indirect indicator of the status of the patients. Direct indicator (i.e. biomechanic and functional analysis) should be obtained by analyzing the motions performed by the patients and extracting clinically relevant information.
The second solution, presented in this paper, is to analyze the trajectories performed by the patients and extract relevant information about speed, total displacement and reaching area.
assessement [33]. Reaching area and other related parameters are popular in rehabilitation and occupational therapy, since this is a good indicator of the autonomy of the patients [36].
One of the possible issue related to this method is that for upper limbs analysis up to 328 parameters can be obtained. It is thus not possible for clinicians, or patients, to analyze all those parameters. Two problems must be solved: data reduction/selection and data visualization.
To determine the more relevant parameters two methods can be used.
The first one is based on expert’s (i.e. clinicians) opinion and expertise. According to the pathology they selected what they think is the most appropriate and relevant information.
The second one is to use statistical methods. Principle Component Analysis can be used to select the most discriminant parameters for each population (if the sample size is big enough). Clustering or other machine learning methods can be used to determine the most relevant parameters to detect differences between healthy subjects and patients.
Both methods have pros and cons. The advantage of expert based selection (supervised) is that the clinicians, final users of this solution, are choosing parameters that they understand and are meaningful, weak point of this method is that they are probably missing plenty of relevant information because of the amount of new parameters that they are unaware of. Concerning the unsupervised method, this is the opposite situation: all the data will be analyzed without prior clinical assumptions and therefore parameters will be selected that are relevant from a statistical point of view but that may be difficult to interpret and/of understand for the clinicians. This gap between the clinic and the development of new methods and technology is becoming more and more important and special attention must be paid to it in order to continue developing useful technologies [37]. A mixed approach between clinically oriented selection of the data (experts’ opinion) and machine learning methods must be encouraged in order to have solutions that can be used in daily clinics.
Due to financial constraints and the lack of access to clinicians, the time in front of the patient during consultation is continuously decreasing [38]. In this particular context fast and easy to interpret visualization tools must be developed. An alternative visualization of the scoring (compared toTable 3 andTable 4) is presented in andFigure 5. Selected parameters (n =17) for visualization are grouped per angular (Ang,n =6), volumetric (Vol,n =5) and length (Len,n =6) characteristics. The reference value of the score is 100% and is indicated by the yellow circle. Score values of the parameters in the range [±100%] are presented inside each sector and the radius of the sector is proportional to the score value. Mean scores are presented for each group and the total score from the 17 parameters is depicted in the yellow circle in the center. The main representative results for parameters from angle, length and volume are plotted in a star diagram (Figure 5).
In this example, results for both limbs are compared with reference values of healthy subjects and expressed in percentage.
In case of asymmetric pathologies (e.g. hemiplegia) results of the affected limb can be compared with the healthy one [39].
Future work will focus on the selection of the best parameters and including other relevant parameters such as the smoothness of the motion using normalized jerk in order to assess the quality of the exercises [40].
6. Conclusion
In addition to the optimization algorithm several parameters were processed based on the trajectories performed by the patients. Further studies are needed to select which parameters are the most relevant to perform functional evaluation and long term follow-up during the rehabilitation. Results of the analysis are presented for intuitive and easy to understand interpretation for both patients and clinicians.
The proposed new scoring system to perform functional assessment coupled to rehabilitation exercises has been validated, therefore results of such kind of evaluation could be used to monitor patients and to perform long term follow-up during the rehabilitation.
Acknowledgments:This study is a part of the ICT4Rehab and RehabGoesHome projects (www.ict4rehab.org). Those projects were funded by Innoviris (Brussels Capital Region).
Author Contributions:Conceptualization, Bruno Bonnechère; Data curation, Bruno Bonnechère; Formal analysis, Bruno Bonnechère and Victor Sholukha; Investigation, Bruno Bonnechère; Project administration, Serge Van Sint Jan and Bart Jansen; Resources, Serge Van Sint Jan; Software, Victor Sholukha and Lubos Omelina; Supervision, Serge Van Sint Jan and Bart Jansen; Visualization, Victor Sholukha; Writing – original draft, Bruno Bonnechère; Writing – review & editing, Serge Van Sint Jan and Bart Jansen.
Conflicts of Interest:The authors declare no conflict of interest.
Abbreviations
The following abbreviations are used in this manuscript:
MLS: Markerless system MBS: Marker-based system LCS: Local coordinate system RCP: Reproducibility coefficient CV: Coefficient of variation
1. Clark, R.; Pua, Y.; Fortin, K.; Ritchie, C.; Webster, K.; Denehy, L.; Bryant, A. Validity of the Microsoft Kinect for assessment of postural control.Gait Posture2012,36, 372–7.
2. Clark, R.; Pua, Y.; Bryant, A.; Hunt, M. Validity of the Microsoft Kinect for providing lateral trunk lean feedback during gait retraining. Gait Posture2013,38, 1064–6.
3. Bonnechère, B.; Jansen, B.; Salvia, P.; Bouzahouene, H.; Omelina, L.; Sholukha, V.; Cornelis, J.; Rooze, M.; Van Sint Jan, S. Determination of the precision and accuracy of morphological measurements using the KinectTMsensor: comparison with standard stereophotogrammetry. Ergonomics2014,57, 622–31. 4. Bonnechère, B.; Jansen, B.; Salvia, P.; Bouzahouene, H.; Omelina, L.; Moiseev, F.; Sholukha, V.; Cornelis, J.;
Rooze, M.; Van Sint Jan, S. Validity and reliability of the Kinect within functional assessment activities: comparison with standard stereophotogrammetry.Gait and Posture2014,39, 593–598.
5. Pfister, A.; West, A.; Bronner, S.; Noah, J. Comparative abilities of Microsoft Kinect and Vicon 3D motion capture for gait analysis. J Med Eng Technol2014,38, 274–80.
6. Gray, A.; Willis, B.; Skubic, M.; Huo, Z.; Razu, S.; Sherman, S.; TM, G.; Jahandar, A.; Gulbrandsen, T.; Miller, S.; Siesener, N. Development and Validation of a Portable and Inexpensive Tool to Measure the Drop Vertical Jump Using the Microsoft Kinect V2. Sport Health2017,1941738117726323.
7. Kim, D.; Kim, D.; Kwak, K. Classification of K-Pop Dance Movements Based on Skeleton Information Obtained by a Kinect Sensor. Sensors (Basel)2017,17, pii: E1261.
8. Della Croce, U.; Leardini, A.; Chiari, L.; Cappozzo, A. Human movement analysis using stereophotogrammetry. Part 4: assessment of anatomical landmark misplacement and its effects on joint kinematics.Gait Posture2005,21, 226–37.
9. Leardini, A.; Chiari, L.; Della Croce, U.; Cappozzo, A. Human movement analysis using stereophotogrammetry. Part 3. Soft tissue artifact assessment and compensation. Gait Posture2005,
10. Kurillo, G.; Chen, A.; Bajcsy, R.; Han, J. Evaluation of upper extremity reachable workspace using Kinect camera. Technol Health Care2013,21, 641–56.
11. Han, J.; Kurillo, G.; Abreash, R.; de Bie, E.; Nicorici, A.; Bajcsy, R. Reachable Workspace in Facioscapulohumeral muscular dystrophy (FSHD) by Kinect. Technol Health Care2015,51, 168–75. 12. Han, J.; de Bie, E.; Nicorici, A.; Abreash, R.; Anthonisen, C.; Bajcsy, R.; Kurillo, G.; Mcdonald, C. Reachable
workspace and performance of upper limb (PUL) in duchenne muscular dystrophy. Muscle Nerve2016,
53, 545–54.
13. Elgendi, M.; Picon, F.; Magnenat-Thalmann, N.; Abbott, D. Arm movement speed assessment via a Kinect camera: a preliminary study in healthy subjects. Biomed Eng Online2014,13, 88.
14. Pagliari, D.; Pinto, L. Calibration of Kinect for Xbox One and Comparison between the Two Generations of Microsoft Sensors. Sensors (Basel)2015,15, 27569–89.
15. Wilson, J.; Khan-Perez, J.; Marley, D.; Buttress, S.; Walton, M.; Li, B.; Roy, B. Can shoulder range of movement be measured accurately using the Micorsoft Kinect sensor plus Medical Interactive Recovery Assistant (MIRA) software?J Shoulder Elbow Surgery2017,26, e382–e389.
16. Zulkarnain, R.; Kim, G.; Adikrishna, A.; Hong, H.; Kim, Y.; Jean, I. Digital data acquisition of shoulder range of motion and arm motion smoothness using Kinect v2. J Shoulder Elbow Surgery2017,26, 895–901. 17. MacWilliams, B.; Davis, R. Addressing some misperceptions of the joint coordinate system.J Biomech Eng
2013,135, 54506.
18. Atrsaei, A.; Salarieh, H.; Alasty, A. Human Arm Motion Tracking by Orientation-Based Fusion of Inertial Sensors and Kinect Using Unscented Kalman Filter. J Biomech Eng2016,138, 091005.
19. Seo, N.; Fathi, M.; Hur, P.; Crocher, V. Modifying Kinect placement to improve upper limb joint angle measurement accuracy. J Hand Ther2016,29, 465–473.
20. Xu, X.; Robertson, M.; Cehn, K.; Lin, J.; McGorry, R. Using the Microsoft KinectTMto assess 3-D shoulder kinematics during computer use. Appl Ergon2017,65, 418–423.
21. Liao, Y.; Sun, Y.; Li, G.; Kong, J.; Jiang, G.; Cai, H.; Ju, Z.; Yu, H.; Liu, H. Simultaneous Calibration: A Joint Optimization Approach for Multiple Kinect and External Cameras. Sensors (Basel)2017,17, E1491. 22. Shen, W.; Deng, K.; Bai, X.; Leyvand, T.; Guo, B.; Tu, Z. Exemplar-based human action pose correction.
IEEE Trans Cybern2014,44, 1053–66.
23. Sholukha, V.; Bonnechère, B.; Salvia, P.; Moiseev, F.; Rooze, M.; Van Sint Jan, S. Model-based approach for human kinematics reconstruction from markerless and marker-based motion analysis systems.J Biomech
2013,46, 2363–71.
24. Brandao, A.; Dias, D.; Castellano, G.; Parizotto, N.; Trevelin, L. RehabGesture: An Alternative Tool for Measuring Human Movement.Telemed J E Health2016,22, 584–9.
25. Ding, W.; Zheng, Y.; Su, Y.; Li, X. Kinect-based virtual rehabilitation and evaluation system for upper limb disorders: A case study. J Back Musculoskelet Rehabil2018,Epub.
26. Bonnechère, B.; Jansen, B.; Omelina, L.; Sholukha, V.; Van Sint Jan, S. Patients’ follow-up using biomechanical analysis of rehabilitation exercises. IJSG2017,4, 3–13.
27. Wu, G.; van der Helm, F.; Veeger, H.; Makhsous, M.; Roy, P.V.; Anglin, C.; Nagels, J.; Karduna, A.; McQuade, K.; Wang, X.; Werner, F.; Buchholz, B.; International Society of Biomechanics. ISB recommendation on definitions of joint coordinate systems of various joints for the reporting of human joint motion–Part II: shoulder, elbow, wrist and hand. J Biomech2005,38, 981–992.
28. Duarte, M.; Freitas, S. Revision of posturography based on force plate for balance evaluation. Rev Bras Fisioter2010,14, 183–92.
29. Omelina, L.; Jansen, B.; Bonnechère, B.; Van Sint Jan, S.; Cornelis, J. Serious games for physical rehabilitation: designing highly configurable and adaptable games.In: ICDVRAT. Laval. France2012.
30. Liu, Z.; Huang, J.; Han, J.; Bu, S.; LV, J. Human Motion Tracking by Multiple RGBD Cameras. IEEE Transactions on Circuits and Systems for Video Technology2017,27, 2014–2027.
31. Bonnechère, B.; Jansen, B.; Omelina, L.; Van Sint Jan, S. The use of commercial video games in rehabilitation: a systematic review. Int J Rehabil Res2016,39, 277–90.
33. Bonnechère, B.; Sholukha, V.; Omelina, L.; Vooren, M.V.; Jansen, B.; Van Sint Jan, S. Suitability of functional evaluation embedded in serious game rehabilitation exercises to assess motor development across lifespan.
Gait Posture2017,57, 35–39.
34. Bherer, L.; Kramer, A.; Peterson, M.; Colcombe, S.; Erickson, K.; Becic, E. Transfer effects in task-set cost and dual-task cost after dual-task training in older and younger adults: further evidence for cognitive plasticity in attentional control in late adulthood.Exp Aging Research2008,34, 188–219.
35. Morone, G.; Paolucci, S.; Iosa, M. In What Daily Activities Do Patients Achieve Independence after Stroke?
J Stroke Cerebrovasc Dis2015,24, 1931–7.
36. Maitra, K.; Philips, K.; Rice, M. Grasping naturally versus grasping with a reacher in people without disability: motor control and muscle activation differences.Am J Occup Ther2010,64, 95–104.
37. Goldman, M. Education in Medicine: Moving the Boundaries to Foster Interdisciplinarity. Front Med (Lausanne)2016,3, 15–16.
38. Lemon, T.; Smith, R. Consultation content not consultation lenght improves patient satisfaction. J Family Med Prim Care2014,3, 333–339.
39. Schlenstedt, C.; Arnold, M.; Mancini, M.; Deuschl, G.; Weisser, B. The effect of unilateral balance training on postural control of the contralateral limb.J Sports Sci2016,9, 1–7.
40. Buma, F.; van Kordelaar, J.; Raemaekers, M.; van Wegen, E.; Ramsey, N.; Kwakkel, G. Brain activation is related to smoothness of upper limb movements after stroke.Exp Brain Res2016,234, 2077–89.
41. Cappozzo, A.; Della Croce, U.; Leardini, A.; Chiari, L. Human movement analysis using stereophotogrammetry. Part 1: theoretical background. Gait Posture2005,21, 186–96.