1
Construction of an exposure-pathway-phenotype in children with depression due to
transfusion-dependent thalassemia: results of (un)supervised machine learning.
Hussein Kadhem Al-Hakeim a, Asawer Hassan Najm b, Shatha Rouf Moustafa c, Michael Maesd,e,f
*.
a Department of Chemistry, College of Science, University of Kufa, Iraq. E-mail:
b Department of Chemistry, College of Science, University of Kufa, Iraq. E-mail:
c Clinical Analysis Department, College of Pharmacy, Hawler Medical University, Havalan City,
Erbil, Iraq. E-mail: [email protected].
d Department of Psychiatry, Faculty of Medicine, Chulalongkorn University, Bangkok, Thailand.
e Department of Psychiatry, Medical University of Plovdiv, Plovdiv, Bulgaria.
f IMPACT Strategic Research Centre, Deakin University, PO Box 281, Geelong, VIC, 3220,
Australia.
* Corresponding Author:
Prof. Dr. Michael Maes, M.D., Ph.D., Department of Psychiatry, Faculty of Medicine,
Chulalongkorn University, Bangkok, Thailand.
E-mail: [email protected]
https://scholar.google.co.th/citations?user=1wzMZ7UAAAAJ&hl=th&oi=ao
2 Abstract
Background: Transfusion dependent thalassemia (TDT) patients are treated with continued blood
transfusions and show a higher prevalence of depression. TDT with consequent iron overload and
inflammation is associated with increased severity of depressive symptoms in TDT children.
Aim of the study: To construct a pathway-phenotype which combines iron overload and
neuro-immune biomarkers with depressive symptom subdomains in TDT children.
Methods: We measured iron status parameters (iron, ferritin, transferrin saturation percentage) and
inflammatory (interleukin-1β and tumour necrosis factor-α) biomarkers in TDT (n=111) and
healthy (n=53) children and analyzed the results using machine learning.
Results: Cluster analysis separated TDT children with depression from those without depression
and revealed two depressive subgroups one with low self-esteem and another with increased
social-irritability scores. Exploratory factor analysis validated four depressive symptom
dimensions as reliable constructs, namely key depressive, physiosomatic, lowered self-esteem and
social-irritability dimensions. Partial Least Squares showed that 73.0% of the variance in a latent
vector extracted from those four clinical subdomains, immune-inflammatory and iron overload
biomarkers was explained by exposure variables including the number of blood transfusions and
hospitalizations and use of deferoxamine. The exposure data, iron and immune biomarkers, and
symptom subdomains are reflective manifestations of a single latent trait, which shows internal
consistency reliability and predictive relevance.
Conclusions: The nomological network combining exposure, pathways and behavioral phenome
manifestations provides an index of overall severity and disease risk and, therefore, constitutes a
new drug target, indicating that iron overload and immune activation should be targeted to treat
3
Keywords: transfusion-dependent thalassemia, depression, neuro-immune, inflammation,
4 Introduction
Depression is now conceptualized as a neuro-immune disorder with activation of both the
immune-inflammatory response system (IRS) and the compensatory immune-regulatory system
(CIRS) (Maes and Carvalho, 2018). IRS activation is associated with an increase in interleukin
(IL)-1β, tumour necrosis factor (TNF)-α, IL-6, and complement factors and a decrease in negative
acute phase reactants such as zinc (Al-Fadhel et al., 2019; Al-Hakeim et al., 2018; Al-Hakeim et
al., 2015b; Maes et al., 2012; Maes et al., 1995). CIRS-related abnormalities in depression include
elevated IL-4, soluble IL-2 receptor (sIL-2R), sIL-1R antagonist (sIL-1RA), as well as increased
production of IL-10 and positive acute-phase proteins (Maes and Carvalho, 2018). CIRS is
involved in depression by regulating the primary immune-inflammatory response, thereby
preventing an overzealous IRS (Al-Fadhel et al., 2019; Maes and Carvalho, 2018; Martin-Subero
et al., 2016). Depression is also accompanied by increased nitro-oxidative stress and lowered
antioxidant defenses (Maes et al., 1994; Maes et al., 2011; Maes et al., 1996), which are closely
intertwined with activated immune-inflammatory pathways (Moylan et al., 2014).
The onset of depression is associated with different trigger factors that induce immune and
nitro-oxidative stress pathways. For example, exposure to psychological stress, including early
lifetime trauma, may cause immune activation and oxidative stress, thereby increasing the risk of
depression (Kim and Maes, 2003; Moraes et al., 2018). Other exposures which are associated with
activated immune-inflammatory and nitro-oxidative pathways and with the onset of depression are
treatment with interferon-α (Wichers and Maes, 2004), leaky gut (Köhler et al., 2016; Slyepchenko
et al., 2017), leaky gum (Gomes et al., 2018), and lowered levels of omega-3 polyunsaturated fatty
acids (Maes et al., 1999). The theory is that different immune (including cytokines and
5
products, hypochlorous stress, and nitroso-cysteinyl) products induce neuro-toxicity including
effects on synaptic plasticity, synaptic sampling, receptor expression, neurogenesis, apoptosis
pathways, and neurotransmission and consequently depression (Maes et al., 2019; Maes and
Carvalho, 2018).
Recently, we discovered that exposure to iron overload due to repeated transfusions in
children with thalassemia major (β-TM) is associated with increased depression ratings, which, in
turn, are associated with activated immune-inflammatory pathways (Al-Hakeim et al., 2020b).
Thalassemia major is a genetic disease resulting in a lack or a significant reduction of the β-globin
chain causing an imbalance in globin chains that causes red blood cells (RBCs) fragility and
subsequent severe anemia (Thein, 2013). Patients with β-TM need lifetime blood transfusions to
maintain hemoglobin rates as high as possible and eradicate excessive erythropoiesis
(Compernolle et al., 2018). Chronic blood transfusions may cause hemosiderosis, a type of iron
overload, which may cause toxicity to most vital organs (Abdulzahra et al., 2011; Al-Hakeim et
al., 2015a; Daher et al., 2017). Iron chelation therapy, which is used to reduce iron overload, has
harmful consequences on liver, heart, bones, and the immune system (Hammond et al., 2019) with
an increased risk to infections (Shah et al., 2019).
Moreover, exposure to elevated body iron may trigger depressive symptoms in young
adults (Richardson et al., 2015). Metafratzi et al. (2001) reported that, in patients with
transfusion-dependent thalassemia (TDT), increased deposition of iron might be found in the putamen, caudate
nucleus, motor and temporal cortex, which are essential hubs coordinating cognitive functions
including implicit and explicit memory (Metafratzi et al., 2001). A magnetic resonance imaging
6
et al., 2014). Furthermore, elevated iron concentrations in the brain may cause increased oxidative
stress toxicity (Jomova and Valko, 2011a; Nnah and Wessling-Resnick, 2018).
A previous study showed that the TDT-associated exposome including the number of blood
transfusions, iron overload and immune activation, was significantly associated with the clinical
diagnosis of depression and severity of depressive symptoms (Al-Hakeim et al., 2020b). In the
latter study, the severity of depressive symptoms was estimated using the Children’s Depression
Inventory (CDI), which records the severity of depressive symptoms in children based on 27-items
(Kovacs, 1992). Depressive phenomenology comprises different dimensions including key
depressive symptoms (loss of interest, anhedonia, feelings of guilt), a physio-somatic dimension
(fatigue, pain, psychosomatic symptoms), impaired social skills (less socialization, social support,
and rewarding relationships), and increased irritability (Anderson et al., 2014; Kupferberg et al.,
2016; Lewinsohn, 1974; Stringaris et al., 2013). Nevertheless, there are no data whether the
TDT-associated exposome is related to these different symptom dimensions in children.
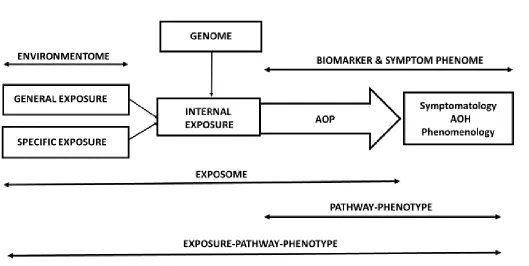
The interconnections between TDT exposure, the iron overload and immune-inflammatory
biomarkers (internal exposure and early phenome) and clinical symptoms (late phenome) offer an
adequate theoretical background to model pathway phenotypes. Figure 1 shows the interactions
between the genome and exposome (consisting of general as well as specific exposures) ultimately
leading to adverse outcome pathways that cause the clinical phenome of depression (symptoms
and phenomenology). When applicated to the TDT study of Al-Hakeim et al. (2020), it shows that
specific exposure to TDT and blood transfusions induces iron overload and consequent immune
activation and that these exposome factors are associated with the clinical phenome of depression
(Al-Hakeim et al., 2020b). Recently, we have reviewed how various machine learning techniques,
7
are higher-order constructs combining information combining the adverse outcome pathways and
symptomatology into new pathway-phenotype scores reflecting the phenome of the illness
(Al-Hakeim et al., 2020a). Nevertheless, there are no data, whether a pathway-phenotype or an
exposure-pathway-phenotype may be constructed reflecting TDT-related depression.
Hence, the present study aims to use machine learning techniques to construct an
iron-overload-neuro-immune-depressed pathway-phenotype in TDT children.
Subjects and Methods
Participants
The present study recruited 111 Iraqi β-TM patients and 53 healthy control children (aged
6-12 years from both sexes). The participants were recruited at the Thalassemia Unit, Al-Zahra'a
Teaching Hospital, Najaf, Iraq. Specialized pediatricians diagnosed β-TM using the criteria of the
2019 ICD-10-CM Diagnosis (Code D56.1). The diagnosis was made based upon hematological
parameters (mainly; hemoglobin <7g/dl and presence of microcytic hypochromic RBCs with
anisopoikilocytosis and increase reticulocyte percentage in the blood smear), clinical symptoms
(mainly severe anemia, splenectomy, and abnormal bone growth), and by Hb HPLC as measured
by using HPLC (VARIANTTM β-Thalassemia Short Program). The sex distribution and age range
of the control group was comparable to that of TDT children. All subjects were free of systemic
or immune-inflammatory diseases. We excluded patients or controls with splenectomy, systemic
diseases such as hypertension, diabetes mellitus, renal failure, or patients with overt inflammation
(serum C-reactive protein (CRP) levels > 6mg/l). The exclusion of subjects with serum CRP > 6
mg/L indicates that increased levels of ferritin are probably associated with iron overload rather
8
involving regular packed RBCs units at 2-4-week intervals depending on the patient’s need to
maintain Hb level beyond 9 g/dL. The patients were administered Iron-chelating therapy with
25-50 mg/kg/day of deferoxamine mesylate USP (Desferal®) infusion over 8 hours/day at 3-5 times
per week depending on the concentration of serum ferritin. Folic acid was given to patients with a
deficit of this vitamin to lessen ineffective erythropoiesis. TDT patients were given vitamin C to
assist the chelation of Fe to deferoxamine by releasing Fe from the reticuloendothelial system.
One-alpha capsules were given to the patients with calcium metabolism disorders caused by
a decreased 1-α hydroxylation.
The symptoms of depression in thalassemia patients were measured using the 27 item
Children Depression Inventory (CDI) (Kovacs, 1992). The CDI score is validated in children and
is one of the most commonly used screening tests for depression in children (Stockings et al.,
2015). The diagnosis depressive disorder due to another medical condition (namely TDT) was
made according to DSM-5 criteria or when the total CDI score ≥19. Written informed consent was
obtained from the patient’s first-degree relatives (mother or father). The research protocol was
approved by the IRB of the University of Kufa number 712/2019.
Assays
Fasting venous blood was collected in the early morning hours (between 8.00 and 10.00
a.m.). After complete clotting, the samples were centrifuged at 3000 rpm for 10 minutes, and the
separated sera were transported into Eppendorf tubes to be stored at -80 °C until analyzed. Serum
iron concentration was estimated by the ferrozine method (Linear, Spain) based on the colorimetric
principle. Total iron-binding capacity (TIBC) was measured by adding an iron solution to saturate
9
The total iron in the supernatant is then determined by the ferrozine method. Serum ferritin was
measured by using an enzyme-linked fluorescent immunoassay (ELFA) performed in an
automated VIDAS instrument (BioMérieux Co., France). The inter-assay coefficient of variance
(CV%) of iron was less than 2.19%, and ferritin was less than 5.70%. Unsaturated Iron binding
Capacity (UIBC) was calculated as UIBC = TIBC - serum iron concentration. The transferrin
saturation percentage (TS%) was computed as TS% = Iron × 100/TIBC (McLaren et al., 2001).
Transferrin concentrations were calculated from the transferrin saturation percentage and serum
iron using the formula: Tf (g/L)= serum iron (µM) /(3.98 * TS%). The formula is based on the
molecular weight of 79.570 fortransferrin and the maximal binding of 2 moles of Fe3+ to each
mole of transferrin (Kennedy et al., 2004). Serum IL-1β, IL-10, CCL11, and TNF-α levels were
measured by commercial ELISA kits supplied by Elabscience, Inc. CA, USA. For samples with
highly concentrated biomarkers, we diluted samples as required. The intra-assay CV (precision
within-assay) values were less than 7.0%. A latex agglutination kit supplied by Spinreact®, Spain
was used to measure serum CRP of all subjects. Serum Cu and Zn were measured by flame atomic
absorption spectrophotometer (AA990, PG Instruments Ltd, Leicestershire, UK) after dilution
1:10 with 6% n-butanol diluent before measurement. This method achieved a 30% increase in
sensitivity compared to the use of deionized water only due to decrease viscosity and the difference
in droplet formation that produces more accurate results (Meret and Henkin, 1971; Twayej et al.,
2019).
Statistical analysis
The difference in variables among groups was assessed by analysis of variance (ANOVA),
10
Pearson’s product-moment and Spearman’s rank-order correlation coefficients were used to
compute the associations among variables. Multiple regression analysis was used to delineate the
significant iron and neuro-immune biomarkers that are associated with the CDI total score. The
results were tested for multicollinearity (tolerance and VIF values) and homoscedasticity.
Univariate GLM analysis was used to examine the associations between diagnostic classes and
biomarkers while adjusting for possible intervening variables. Model-generated estimated
marginal mean (SE) values were calculated after correcting for those background variables.
Protected LSD tests were used to examine pairwise comparisons among treatment means. Multiple
comparisons and correlations were adjusted for false discovery rate (FDR) (Benjamini and
Hochberg, 1995). The diagnostic performance was assessed using the area under (AUC) the ROC
curve with sensitivity and specificity. The immune and iron biomarkers distributions (tested with
the Kolmogorov-Smirnov test) were normalized by processing IL-1β in Ln transformation and
CCL11, ferritin, TNF-α, and UIBC in the square root (sqr) transformation. We computed two
relevant z-unit weighted composite scores, namely z sqr TNF-α + z Ln IL-1β (zTNFα+IL1β;
indicating M1 macrophage activation) and z Iron + z TS% + z Ln ferritin (zFeTSFerr; indicating
iron overload). All tests were 2-tailed, and a p-value of 0.05 was used for statistical significance.
The above statistical analyses were performed using IBM SPSS windows version 25, 2017.
We performed K-mean, K-median and hierarchical cluster analysis using SPSS 25 and the
Unscrambler (CAMO, 2019) in order to find new clusters of participants based on the exposome
markers (blood transfusions, iron overload and immune biomarkers). We employed exploratory
factor analysis (EFA) using FACTOR, windows version 10.5.03 (Lorenzo-Seva and Ferrando,
2013, 2019) as described previously (Almulla et al., 2020). In order to study the causal associations
11
transfusions and hospitalizations) and the symptomatic depression phenome (the CDI
subdimensions), we used partial least squares (PLS) path modelling employing the Smart PLS
software (Ringle et al., 2015). Smart PLS uses structural equation modelling to examine the causal
paths connecting input indicator variables, or latent vectors (LV) extracted from indicators of
external exposure data (TDT) and an output LV extracted from indicator variables reflecting a
pathway-phenotype (Ringle et al., 2015). Complete PLS path analysis on 5000 bootstrap samples
was conducted only when the inner and outer model constructs complied with specific quality
criteria, namely, the model standardized root mean residual (SRMR) < 0.08, and all LVs show
suitable reliability validity as indicated by Cronbach’s alpha > 0.7, composite reliability > 0.7,
rho_A > 0.8, average variance extracted (AVE) > 0.5; and all outer model factors show loadings
> 0.6 at p<0.001 (Ringle et al., 2015). Consequently, path coefficients with exact p-values are
computed using complete PLS with 5000 bootstrap samples.
Results
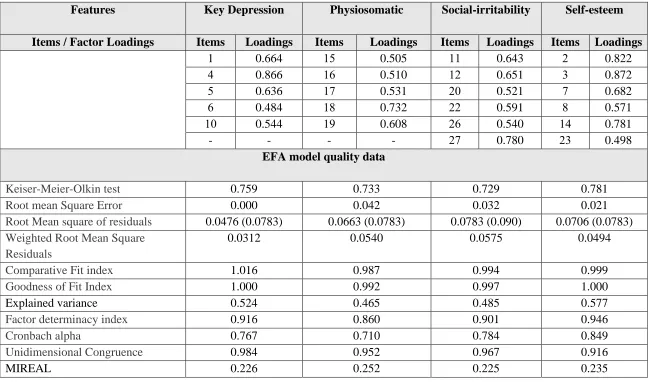
1. Results of EFA
In order to find meaningful symptom patterns in the CDI items (i.e. the 4 symptom domains
described in the “Introduction”) and to cluster subjects based on their biomarkers, we performed
EFA and cluster analysis, respectively. Firstly, we grouped CDI symptoms in four different
symptom subdomains (based on common knowledge, see Introduction) and explored whether
these domains may be valid constructs. As such we constructed a first symptom domain using
items (1) “I feel sad”; (4) “I do not enjoy anything”; (5) “sometimes I am bad”; (6) “I think
something bad will happen to me”; and (10) “every day, I feel like crying” and labelled this
12
namely item (15) “I have to force myself to do my homework”; (16) “I have difficulty falling
asleep”; (17) “I always feel tired”; (18) “Most of the days, I don’t have much desire to eat”; (19)
“I am always worried about pain and trouble”, labelled as physio-somatic symptoms
(PHYSIOSOM). The third domain comprised 6 items namely items (11) “Most often, everything
irritates me”; (12) “I don’t like to be around people at all”; (20) “I feel alone all the time”; (22) “I
have no friends”; (26) “I never do what I am asked to do”; and (27) “I always fight with people”,
and this domain was labelled as “social-irritability symptoms (SIRR)”. The fourth symptom
domain comprised 6 items namely items (2) “Everything always happens the way I don’t want
them to”; (3) “I always do everything the wrong way”; (7) “I hate myself”; (8) “I am responsible
for anything bad that happens to me”; (14) “I am ugly”; and (23) “I am bad at those lessons in
which I used to get good grades”, labelled as “lowered self-esteem (LSE)”.
Table 1 shows the results of four different EFAs performed on the 4 symptom domains
herein constructed. The Keiser-Meier-Olkin (KMO) statistics as well as the significances of
Bartlett's test (all p<0.00001) showed that the factorability of the correlation matrices was
sufficient to allow EFA being performed. Schwartz’s Bayesian Information Criterion (BIC) and
Hull tests indicated that the advised number of factors was one in all four EFAs performed. Table
1 also shows that all CDI items loaded highly on their respective factors. The mean of item residual
absolute loadings (MIREAL) (all <0.300) and unidimensional congruence (UNICO) (all >0.95)
values suggested that the data may be treated as unidimensional (except UNICO values in
self-esteem). The distribution of residuals as assessed with root mean square of residuals (RMSR)
performed well, and the weighted root mean square residual (WRMR) and root mean square error
(RMSE) values indicated adequate fits of all 4 factors. The factor determinacy index (FDI) values
13
comparative fit index (CFI) and goodness of fit index (GFI) indicate an adequate fit of the 4
models. Also, the explained variances of the factors and Cronbach alpha are sufficient.
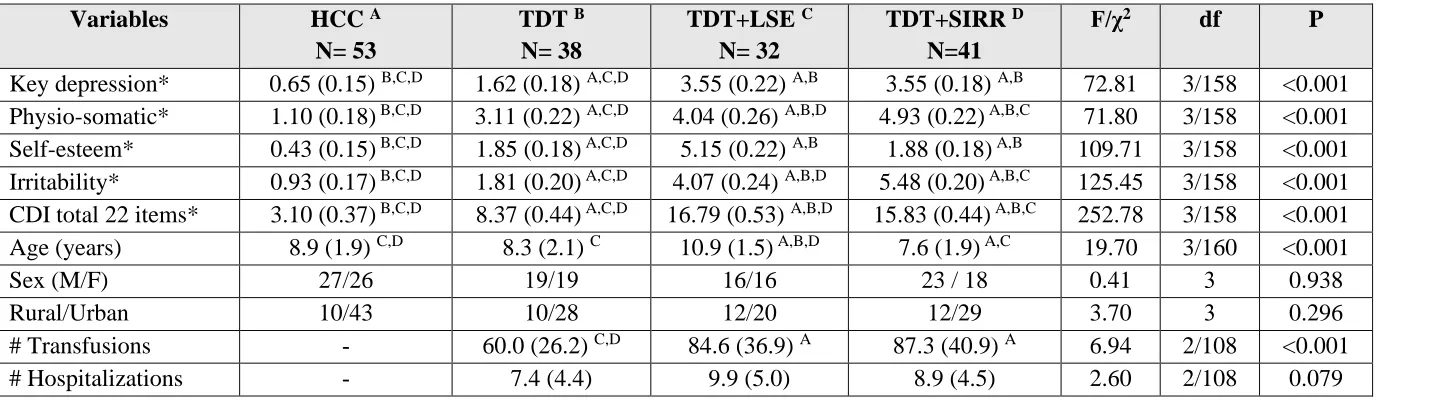
Results of cluster analysis
K-mean cluster analysis performed on the 4 symptom subdomains showed the existence of
three different clusters, whereby one cluster (n=91) comprised all healthy control children (n=53)
and 38 TDT children, and two other groups with increased depressive symptoms. Therefore, the
data set was divided into 4 different groups, as shown in Table 2. This Table shows the four
symptom subdomain scores in these four subgroups. There were 2 groups (comprising 32 and 41
children) with meaningful depressive symptoms (thus n=71 with depression due to TDT) both with
high scores on the KEYDEP, PHYSIOSOM, LSE, and SIRR domains and their sum. These two
depressive classes showed domain scores that were significantly higher than in the 53 healthy
children and 38 TDT children without depressive symptoms. Moreover, there are significant
differences between the two “depressive” classes in that one class showed significantly increased
SIRR scores (labelled as TDT+SIRR), while the other group showed significantly increased LSE
scores (labelled TDT+LSE). As such, the cluster analysis detected two different depressive TDT
groups, namely depressed TDT children with high LSE scores (TDT+LSE) and depressed children
with increased SIRR scores (TDT+SIRR).
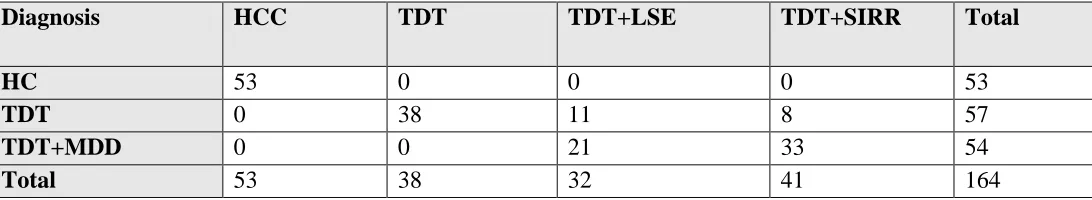
Table 3 shows the association between the clinical DSM-5 classification and the cluster
analysis-generated solution. There was a highly significant association between both diagnostic
classifications (χ2=247.23, df=6, p<0.001) whereby the cluster depression class (n=73) is enriched
with 19 subjects that were classified as non-MDD patients (n=57) using the clinical diagnosis.
14
TDT+SIRR) is less restrictive than the clinical diagnosis of depression. Table 2 shows that the age
of TDT+LSE patients was significantly higher than in all other groups while there were no
significant differences in sex ratio or urban/rural ratio between the 4 diagnostic groups. TDT+LSE
and TDT+SIRR children underwent significantly more blood transfusions and hospitalizations
than TDT children. Using the sum of the items in the 4 subdomains showed an AUC ROC curve
of 0.998 (SE=0.002; p<0.001) with sensitivity of 95.9% and specificity of 100% when using a >
10 cut-off value.
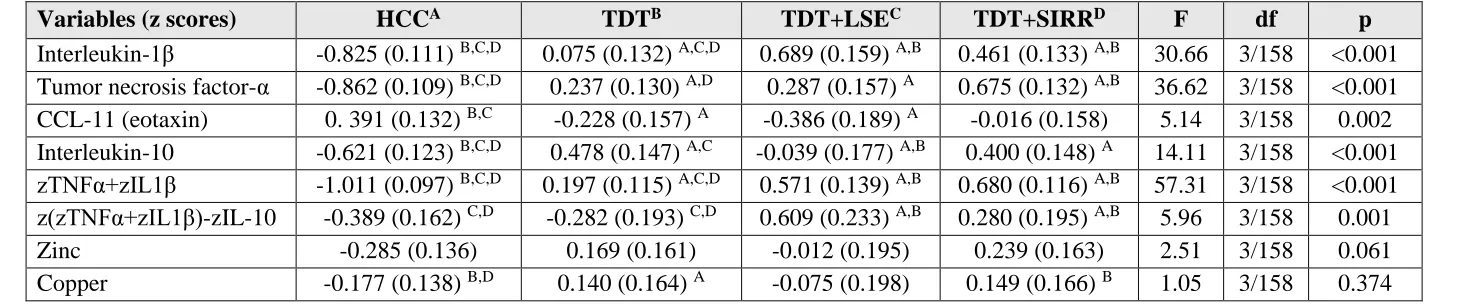
Table 4 shows the difference in iron variables between the 4 study groups. Iron and the
integrated index zFeTSFerr score were significantly higher in TDT+LSE than in the three other
groups. Overall, TDT patients show signs of iron overload (increased Fe, lowered UIBC, and
increased ferritin and the integrated index) as compared with healthy control children. Table 5
shows the measurements of the immune and mineral variables between the 4 diagnostic groups.
IL-1β was significantly higher in TDT+LSE and TDT+SIRR as compared with healthy and TDT
children, while TNF-α was significantly higher in TDT+SIRR than in controls and TDT. CCL11
was lower in TDT than in controls while the integrated indices zTNF+zIL1β and
(zTNFα+zIL1β)-zIL-10 are significantly higher in TDT+LSE and TDT+SIRR than in healthy control children and
TDT. The omnibus tests computed on zinc and copper yielded nonsignificant results. FDR
p=correction did not change any of these results.
Associations between symptom domains and biomarkers.
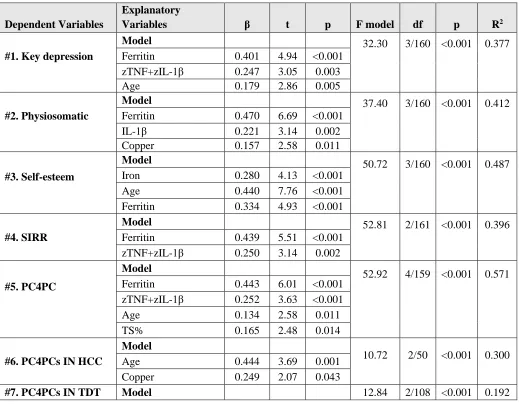
Table 6 shows the results of automatic stepwise regression analyses with the symptom
domains as dependent variables and the biomarkers as explanatory variables while allowing for
15
shows that 37.7% of the variance in the KEYDEP score could be explained by ferritin,
zTNF+zIL1, and age (all positively associated). Regression #2 shows that 41.2% of the variance
in PHYSIOSOM score could be explained by ferritin, IL-1β, and copper (all positively associated).
Regression #3 shows that 48.7% of the variance in LSE scores was explained by iron, age, and
ferritin. Regression #4 shows that 39.6% of the variance in the SIRR score was explained by the
combined effects of ferritin and zTNF+zIL1. Regression #5 shows a regression with the first PC
subtracted from the 4 subdomain PC scores as an explanatory variable. This PC explained 63.39%
of the variance in the 4 domain factor scores and showed adequate KMO (0.750) and Bartlett’s
test (χ2=224.84, df=6, p<0.001) values. Regression #5 shows that 57.1% of the variance in this PC
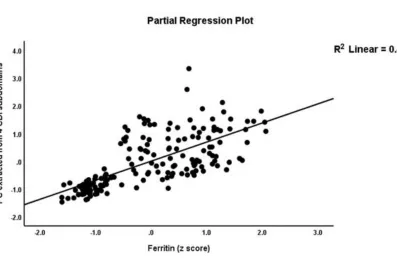
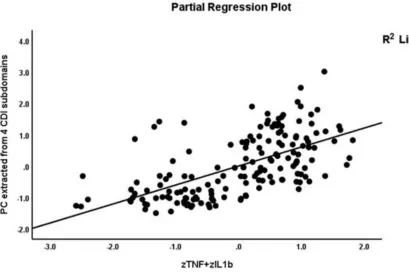
was explained by ferritin, zTNF+zIL1, age, and TS% (all positively associated). Figure 2 shows
the partial regression of the PC extracted from the 4 subdomains on ferritin after controlling for
the effects of sex and age. Figure 3 shows the partial regression of the same PC on the zTNF+zIL1
index again after controlling for the effects of sex and age. The introduction of the number of blood
transfusions in this analysis showed that 64.4% of the variance (F=72.01, df=4/159, p<0.001) was
explained by the number of blood transfusions, zTNF+zIL1, and age, while TS% was no longer
significant. Finally, we also performed the same regression analyses with the PC extracted from
the 4 subdomains as a dependent variable in both healthy and TDT children. In doing so, we
observed that in healthy children, 30% of the variance in this PC could be explained by age and
copper (both positive), while 19.2% of the variance in TDT was explained by zTNF+zIL1 and
transfusions number.
16
Figure 4 displays the construction of a pathway-phenotype based on the four subdomain
scores combined with iron overload status and immune biomarkers. A latent vector (LV) was
extracted from these indicator variables in a reflective model and entered in the PLS model as the
target variable. This LV loaded highly (all > 0.62 at p<0.0001) on all biomarker indicators, except
CCL11 and IL-10, and, therefore, we deleted these two immune biomarkers from this LV. We
entered an LV extracted from the number of transfusions and hospitalization and use of
deferoxamine as an index of iron overload and consequences, labelled TDT LV. The model fit was
very good with SRMR of the saturated model = 0.047 and SRMR of the estimated model = 0.050.
The construct validities of the pathway-phenotype were very good with Cronbach α= 0.919,
composite reliability = 0.931, rho_A = 0.926, and average extracted variance = 0.533, while the
loadings of all indicators on this LVs were > 0.620 at p<0.0001. Also, the TDT LV showed
adequate construct validity with Cronbach α= 0.904, composite reliability = 0.939, rho_A = 0.922,
and average extracted variance = 0.837, while the loadings of this LV were > 0.902 at p<0.0001.
Complete PLS path analysis on 5000 bootstrap samples showed that 73.0% of the variance in the
pathway-phenotype LV was explained by the regression on the TDT LV, which also predicted
lowered CCL11 and higher IL-10 values. Blindfolding showed that the replicability of the
pathway-phenotype LV is adequate with a cross-validated redundancy of 0.377. CTA showed that
this model was not mis-specified as a reflective model. Multi-group analysis (MGA) showed that
there were no significant differences between boys and girls in the path from TDT LV to the
pathway-phenotype LV.
17
Figure 5 shows a second PLS analysis with the construction of multiple higher-order
constructs. In brief, we constructed an exposure-pathway-phenotype as a second higher-order
construct based on LVs extracted from the symptom phenome (the four symptom dimensions) and
the exposome. The latter is a higher-order construct based on an LV extracted from all
inflammatory, iron overload, and external exposure indicators. The inflammation LV was
extracted from three indicators namely IL-1β, TNF-α, and their integrated index, the iron overload
LV was extracted from four indicators namely iron TS%, ferritin, and their integrated index, while
the external exposure LV comprised three indicators namely number of transfusion and
hospitalizations due to TDT and use of deferoxamine. Most importantly, Figure 5 shows that the
composite reliability of all constructs was adequate (shown as figures in the circles delineating the
LVs). Likewise, Cronbach alpha (all > 0.877), rho-A (all > 0.809) and AVE (all > 0.625) values
were more than adequate. The construct validated redundancies of iron overload (0.407),
inflammation (0.373), exposome (0.619), late phenome (0.381), and the
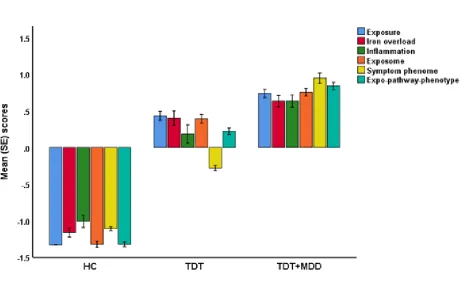
exposure-pathway-phenotype (0.567) were more than adequate. Consequently, we have computed the latent variable
scores and show these scores in normal controls, TDT, and TDT with depression (LSE and SIRR
combined). Figure 6 shows the bar graph with the latent variable scores in these 3 groups. ANOVA
showed significant differences in all 6 scores (all p<0.001, at df=2/161). Post-hoc tests showed
that all scores were significantly different between the three study groups except iron overload,
which was not significantly different between TDT with and without depression (p=0.052).
Discussion
The first major finding of this study is that four different dimensions in depressive
18
symptoms, lowered self-esteem and social-irritability. In fact, all TDT children showed increased
scores on these four depressive subdomains when compared to healthy children. Furthermore, PLS
analysis showed that these four subdomains are reflective manifestations of an underlying
construct, which represents the four symptom subdomains and shows adequate construct validity
and replicability and is, therefore, a reliable index of overall severity of depression in TDT
children.
Some previous studies showed that the majority of patients with thalassemia major have at
least one psychiatric disorder (Naderi et al., 2012; Nasiri et al., 2014; Yengil et al., 2014) including
anxiety (Maheri et al., 2018; Mednick et al., 2010; Yahia et al., 2013), depression (Maheri et al.,
2018; Töret et al., 2018; Yahia et al., 2013), and lack of control of anger (Ghanizadeh et al., 2006).
In another study, about half of patients with thalassemia have depression, while 62.7% suffered
from irritability and anger (Ghanizadeh et al., 2006). Interestingly, depression and anxiety scores
declined in older thalassemia patients (14-58 years old) (Mednick et al., 2010) indicating a
difference in the phenome of childhood and later-life depression. Typical depressive symptoms in
children with thalassemia are sadness and disinterest in life (Behdani et al., 2015) while
compliance with thalassemia treatment may impact self-esteem (Pradhan et al., 2003). It should
be added that lowered self-esteem frequently occurs in patients with thalassemia (Goulas et al.,
2012). Children with thalassemia are perceived to be more aggressive, not obeying rules, irritable
and more challenging while somatization in the form of vague and ill-defined joint pain, body
ache, nausea and headaches is frequently observed (Gupta et al., 2012).
Furthermore, our cluster analysis separated depressed TDT patients from healthy children
and TDT children without depressive symptoms. It is important to note that our cluster
19
this end, a total sum score > 10 on 22 selected CDI items may be used to diagnose children with
depression due to TDT with a sensitivity of 95.9% and a specificity of 100%. Previous research
proposed that a CDI total score of 20 may be used as an external validating criterion with a
sensitivity of 83% and a specificity of 89% (Bang et al., 2015). Interestingly, depression is highly
prevalent in Iraqi thalassemia patients with a prevalence as high as 75% (Sami Kh and
Al-Hamzawi, 2009). Therefore, it is important to authenticate children with depression due to TDT
using less-restrictive algorithms with better accuracy. Moreover, this subgroup of depressed TDT
children may be further divided into those with lowered self-esteem and those with increased
irritability scores. This classification was externally validated by a higher age and iron levels and
a higher iron-overload index in children with depression with lowered self-esteem while there were
no differences in the number of transfusions between both depressed TDT classes.
The second major finding of this study is that the four depressive symptom domains were
predicted by different combinations of biomarkers, whereby key depressive symptoms,
physiosomatic symptoms and irritability were predicted by combinations of iron overload and
immune-inflammatory biomarkers. In contrast, lowered self-esteem was predicted by
iron-overload markers only while increased copper was a significant predictor of increased
physiosomatic symptoms. Iron overload is associated with an immune-inflammatory response,
including activation of M1 macrophage polarization and increased TNF-α expression (Maras et
al., 2018; Wessling-Resnick, 2010a; Zhou et al., 2018). Iron overload may also impact
physiosomatic symptoms as indicated by findings that increased liver iron concentrations are
accompanied by increased tiredness and fatigue (Abetz et al., 2006; Adams et al.,
1997). Moreover, fibromyalgia and depression symptoms may be observed in iron overloaded
20
biomarkers are associated with the fatigue, physiosomatic and fibromyalgia-like symptoms that
accompany depression (Anderson et al., 2014; Maes et al., 2013). Some authors also reported
associations between lowered self-esteem and activated immune-inflammatory pathways (Lee and
Way, 2019; Opheim et al., 2020).
The mechanisms underpinning the impact of exposure to blood transfusions and chelation
treatment on immune-inflammatory pathways and depressive behaviors were reviewed previously
and involve iron homeostasis, inflammation, infections, and oxidative stress (Al-Hakeim et al.,
2020b; Deb et al., 2009; Enculescu et al., 2017; Ganz, 2018; Wessling-Resnick, 2010b). There is
now abundant evidence that activated immune-inflammatory pathways, which are caused by iron
overload, may induce these depressive symptom domains (Al-Hakeim et al., 2020b; Leonard and
Maes, 2012). Multiple blood transfusions in TDT patients may explain that the immune system is
continuously stimulated by alloantigens despite the suppressed immune response due to iron
overload (Sari et al., 2016). Moreover, chelation therapy can further increase inflammatory burden
by lowering the labile iron pool thereby increasing IL-1β transcription (O'Brien-Ladner et al.,
2000). Iron overload in the liver and peripheral blood mononuclear cells induces genes linked to
antioxidant activity, and reactive oxygen species, including hydrogen peroxides (Bresgen and
Eckl, 2015). The combination of iron overload, and neuro-immune and oxidative stress toxicity
following exposure to blood transfusions and deferoxamine treatment may cause neurotoxic
effects leading to the development of various symptoms, including depression (Jomova and Valko,
2011b; Nnah and Wessling-Resnick, 2018; Siesjö et al., 1989). Both inflammation and oxidative
stress may explain depression symptoms (Hirose et al., 2016), including physiosomatic symptoms
(Chaves-Filho et al., 2019), low self-esteem (Bhatt et al., 2020) and irritability (Maria Michel et
21
The third significant finding of this study is that a latent vector could be extracted from the
four clinical subdomains, and the iron overload and immune-inflammatory biomarkers. As such,
we have constructed a pathway-phenotype that combines changes in biomarkers (early phenome
features) with specific symptom domains (late phenome features) into an index reflecting the
phenome of depression due to TDT. The latter provides an index of overall severity of chemical
stress and phenomenology and follows a reflective model with excellent construct validity
indicating that all those indicators are reflective manifestations of a common underlying construct,
namely the core phenome of depression. Importantly, our pathway analysis showed that a large
part of the variance in this phenotype-pathway was explained by the exposure to TDT and its
consequences. More specifically, the number of transfusions, hospitalizations and use of
deferoxamine is part of the external exposome, which may cause adverse outcome pathways
including iron overload as well as activated immune-inflammatory pathways and, consequently,
adverse health outcomes, namely the four depressive subdomains which together shape the
nosological entity “depression due to TDT”. Complementing the exposome with the adverse
outcome pathways and adverse health outcome concepts may promote the mechanistic
understanding of exposure-induced effects on pathways and behavior (Escher et al., 2017).
Our second PLS analysis showed that a reliable and replicable latent vector could be
extracted from the exposure data, iron overload and immune biomarkers, and symptom domain as
well. Therefore, this nomological network combining exposure, pathways and the behavioral
phenome into a higher-order, overarching construct indicates that the exposome comprising TDT
and the induced chemical stress may induce AHO leading to AHO. This nomothetic approach
provides an index of the overall impact of exposure + pathways + phenomenology and
22
drug target, indicating that treatments of depression due to TDT should target iron overload and
immune activation (and related nitro-oxidative stress toxicity).
This study would have been more interesting if we had assayed nitro-oxidative stress
biomarkers, which probably play an essential role in the onset of TDT-related depression. In
addition, we did not measure the psycho-social exposure factors, namely difficulties in all facets
of life including maladaptive coping strategies, low school or play performance, social isolation,
dependency, compromised physical ability and limited life opportunities (Koutelekos and
Haliasos, 2013).
Conclusions
TDT children with depression may be discriminated from those without depression using
a total sum score > 10 on 22 selected items with a sensitivity of 95.9% and a specificity of 100%.
Four depressive symptom dimensions (key depressive, physiosomatic, lowered self-esteem and
social-irritability) were validated as reliable constructs and manifestations of an underlying single
trait, namely overall severity of depression due to TDT. We found that 73.0% of the variance in a
latent vector extracted from those four dimensions, iron overload and immune-inflammatory
biomarkers was explained by the number of blood transfusions and hospitalizations and use of
deferoxamine.
Acknowledgement
We thank the staff of the Thalassemia Unit at Al-Zahra'a Teaching Hospital-Najaf
city-Iraq for their help in the collection of samples. We also acknowledge the work of the highly skilled
23
Funding
There was no specific funding for this specific study.
Conflict of interest
The authors have no conflict of interest with any commercial or other association in
connection with the submitted article.
Author’s contributions
All the contributing authors have participated in the preparation of the manuscript.
References
Abdulzahra, M.S., Al-Hakeim, H.K., Ridha, M.M., 2011. Study of the effect of iron overload on the function of endocrine glands in male thalassemia patients. Asian J Transfus Sci 5, 127-131.
Abetz, L., Baladi, J.F., Jones, P., Rofail, D., 2006. The impact of iron overload and its treatment on quality of life: results from a literature review. Health Qual Life Outcomes 4, 73.
Adams, P.C., Deugnier, Y., Moirand, R., Brissot, P., 1997. The relationship between iron overload, clinical symptoms, and age in 410 patients with genetic hemochromatosis. Hepatology 25, 162-166.
Al-Fadhel, S.Z., Al-Hakeim, H.K., Al-Dujaili, A.H., Maes, M., 2019. IL-10 is associated with increased mu-opioid receptor levels in major depressive disorder. Eur Psychiatry 57, 46-51.
Al-Hakeim, H.K., Al-Khakani, M.M., Al-Kindi, M.A., 2015a. Correlation of hepcidin level with insulin resistance and endocrine glands function in major thalassemia. Adv Clin Exp Med 24, 69-78. Al-Hakeim, H.K., Al-Kufi, S.N., Al-Dujaili, A.H., Maes, M., 2018. Serum Interleukin Levels and Insulin Resistance in Major Depressive Disorder. CNS Neurol Disord Drug Targets 17, 618-625.
Al-Hakeim, H.K., Al-Rammahi, D.A., Al-Dujaili, A.H., 2015b. IL-6, IL-18, sIL-2R, and TNFα proinflammatory markers in depression and schizophrenia patients who are free of overt inflammation. J Affect Disord 182, 106-114.
Al-Hakeim, H.K., Almulla, A.F., Maes, M., 2020a. The Neuroimmune and Neurotoxic Fingerprint of Major Neurocognitive Psychosis or Deficit Schizophrenia: a Supervised Machine Learning Study. Neurotoxicity Research 37, 753-771.
Al-Hakeim, H.K., Najm, A.H., Al-Dujaili, A.H., Maes, M., 2020b. Major Depression in Children with Transfusion-Dependent Thalassemia Is Strongly Associated with the Combined Effects of Blood
24
Almulla, A.F., Al-Hakeim, H.K., Maes, M., 2020. Schizophrenia phenomenology revisited: positive and negative symptoms are strongly related reflective manifestations of an underlying single trait indicating overall severity of schizophrenia. CNS Spectrums, 1-10.
Anderson, G., Berk, M., Maes, M., 2014. Biological phenotypes underpin the physio-somatic symptoms of somatization, depression, and chronic fatigue syndrome. Acta psychiatrica Scandinavica 129, 83-97. Bang, Y.R., Park, J.H., Kim, S.H., 2015. Cut-Off Scores of the Children's Depression Inventory for
Screening and Rating Severity in Korean Adolescents. Psychiatry investigation 12, 23-28. Behdani, F., Badiee, Z., Hebrani, P., Moharreri, F., Badiee, A.H., Hajivosugh, N., Rostami, Z.,
Akhavanrezayat, A., 2015. Psychological Aspects in Children and Adolescents With Major Thalassemia: A Case-Control Study. Iran J Pediatr 25, e322.
Benjamini, Y., Hochberg, Y., 1995. Controlling the false discovery rate: a practical and powerful approach to multiple testing. Journal of the Royal statistical society: series B (Methodological) 57, 289-300.
Bhatt, S., Nagappa, A.N., Patil, C.R., 2020. Role of oxidative stress in depression. Drug Discovery Today. Bresgen, N., Eckl, P.M., 2015. Oxidative stress and the homeodynamics of iron metabolism.
Biomolecules 5, 808-847.
CAMO, 2019. The Unscrambler Appendices: Method References, 2019. . As assessed 19-3-2019. www.camo.com/helpdocs/The_Unscrambler_Method_References.pdf. .
Chaves-Filho, A.J.M., Macedo, D.S., de Lucena, D.F., Maes, M., 2019. Shared microglial mechanisms underpinning depression and chronic fatigue syndrome and their comorbidities. Behav Brain Res 372, 111975.
Compernolle, V., Chou, S.T., Tanael, S., Savage, W., Howard, J., Josephson, C.D., Odame, I., Hogan, C., Denomme, G., Shehata, N., 2018. Red blood cell specifications for patients with hemoglobinopathies: a systematic review and guideline. Transfusion 58, 1555-1566.
Daher, R., Manceau, H., Karim, Z., 2017. Iron metabolism and the role of the iron-regulating hormone hepcidin in health and disease. La Presse Médicale 46, e272-e278.
Deb, S., Johnson, E.E., Robalinho-Teixeira, R.L., Wessling-Resnick, M., 2009. Modulation of intracellular iron levels by oxidative stress implicates a novel role for iron in signal transduction. Biometals 22, 855-862.
Enculescu, M., Metzendorf, C., Sparla, R., Hahnel, M., Bode, J., Muckenthaler, M.U., Legewie, S., 2017. Modelling Systemic Iron Regulation during Dietary Iron Overload and Acute Inflammation: Role of Hepcidin-Independent Mechanisms. PLoS Comput Biol 13, e1005322.
Escher, B.I., Hackermüller, J., Polte, T., Scholz, S., Aigner, A., Altenburger, R., Böhme, A., Bopp, S.K., Brack, W., Busch, W., Chadeau-Hyam, M., Covaci, A., Eisenträger, A., Galligan, J.J., Garcia-Reyero, N., Hartung, T., Hein, M., Herberth, G., Jahnke, A., Kleinjans, J., Klüver, N., Krauss, M., Lamoree, M., Lehmann, I., Luckenbach, T., Miller, G.W., Müller, A., Phillips, D.H., Reemtsma, T., Rolle-Kampczyk, U., Schüürmann, G., Schwikowski, B., Tan, Y.-M., Trump, S., Walter-Rohde, S., Wambaugh, J.F., 2017. From the exposome to mechanistic understanding of chemical-induced adverse effects. Environment international 99, 97-106.
Ganz, T., 2018. Iron and infection. Int J Hematol 107, 7-15.
25
Goulas, V., Kourakli-Symeonidis, A., Camoutsis, C., 2012. Comparative effects of three iron chelation therapies on the quality of life of greek patients with homozygous transfusion-dependent Beta-thalassemia. ISRN hematology 2012.
Gupta, V., Singh, A., Upadhyay, S.K., Bhatia, B., 2012. Psychopathology in children with thalassemia major. Psychological studies 57, 55-57.
Hammond, J., Thompson, A.A., Fogel, M.A., Hammond, K., Kokroko, J., Kwiatkowski, J.L., 2019. Combination Oral Chelation in Adult Patients With Transfusion-dependent Thalassemia and High Iron Burden. Journal of pediatric hematology/oncology 41, e47-e50.
Hirose, A., Terauchi, M., Akiyoshi, M., Owa, Y., Kato, K., Kubota, T., 2016. Depressive symptoms are associated with oxidative stress in middle-aged women: a cross-sectional study. BioPsychoSocial Medicine 10, 12.
Jomova, K., Valko, M., 2011a. Advances in metal-induced oxidative stress and human disease. Toxicology 283, 65-87.
Jomova, K., Valko, M., 2011b. Importance of iron chelation in free radical-induced oxidative stress and human disease. Current pharmaceutical design 17, 3460-3473.
Kennedy, A., Kohn, M., Lammi, A., Clarke, S., 2004. Iron status and haematological changes in adolescent female inpatients with anorexia nervosa. Journal of paediatrics and child health 40, 430-432.
Kim, Y.K., Maes, M., 2003. The role of the cytokine network in psychological stress. Acta neuropsychiatrica 15, 148-155.
Köhler, C.A., Maes, M., Slyepchenko, A., Berk, M., Solmi, M., Lanctôt, K.L., Carvalho, A.F., 2016. The Gut-Brain Axis, Including the Microbiome, Leaky Gut and Bacterial Translocation: Mechanisms and
Pathophysiological Role in Alzheimer's Disease. Current pharmaceutical design 22, 6152-6166. Koutelekos, J., Haliasos, N., 2013. Depression and Thalassemia in children, adolescents and adults. Health Science Journal 7, 239.
Kovacs, M., 1992. Children's Depression Inventory Manual. Multi-Health Systems. Inc. North Tonawanda, NY.
Kupferberg, A., Bicks, L., Hasler, G., 2016. Social functioning in major depressive disorder. Neuroscience & Biobehavioral Reviews 69, 313-332.
Lee, D.S., Way, B.M., 2019. Perceived social support and chronic inflammation: The moderating role of self-esteem. Health Psychol 38, 563-566.
Leonard, B., Maes, M., 2012. Mechanistic explanations how cell-mediated immune activation,
inflammation and oxidative and nitrosative stress pathways and their sequels and concomitants play a role in the pathophysiology of unipolar depression. Neuroscience & Biobehavioral Reviews 36, 764-785. Lewinsohn, P.M., 1974. A behavioral approach to depression. Essential papers on depression, 150-172. Lorenzo-Seva, U., Ferrando, P.J., 2013. Factor 9.2: A comprehensive program for fitting exploratory and semiconfirmatory factor analysis and IRT models. Applied Psychological Measurement.
Lorenzo-Seva, U., Ferrando, P.J., 2019. A general approach for fitting pure exploratory bifactor models. Multivariate behavioral research 54, 15-30.
Maes, M., Berk, M., Goehler, L., Song, C., Anderson, G., Gałecki, P., Leonard, B., 2012. Depression and sickness behavior are Janus-faced responses to shared inflammatory pathways. BMC medicine 10, 66. Maes, M., Bonifacio, K.L., Morelli, N.R., Vargas, H.O., Barbosa, D.S., Carvalho, A.F., Nunes, S.O.V., 2019. Major differences in neurooxidative and neuronitrosative stress pathways between major depressive disorder and types I and II bipolar disorder. Molecular neurobiology 56, 141-156.
Maes, M., Carvalho, A.F., 2018. The Compensatory Immune-Regulatory Reflex System (CIRS) in Depression and Bipolar Disorder. Molecular neurobiology 55, 8885-8903.
26
Maes, M., Delanghe, J., Meltzer, H.Y., Scharpé, S., D'Hondt, P., Cosyns, P., 1994. Lower degree of esterification of serum cholesterol in depression: relevance for depression and suicide research. Acta psychiatrica Scandinavica 90, 252-258.
Maes, M., Galecki, P., Chang, Y.S., Berk, M., 2011. A review on the oxidative and nitrosative stress (O&NS) pathways in major depression and their possible contribution to the (neuro)degenerative processes in that illness. Prog Neuropsychopharmacol Biol Psychiatry 35, 676-692.
Maes, M., Meltzer, H.Y., Bosmans, E., Bergmans, R., Vandoolaeghe, E., Ranjan, R., Desnyder, R., 1995. Increased plasma concentrations of interleukin-6, soluble interleukin-6, soluble interleukin-2 and transferrin receptor in major depression. Journal of affective disorders 34, 301-309.
Maes, M., Ringel, K., Kubera, M., Anderson, G., Morris, G., Galecki, P., Geffard, M., 2013. In myalgic encephalomyelitis/chronic fatigue syndrome, increased autoimmune activity against 5-HT is associated with immuno-inflammatory pathways and bacterial translocation. J Affect Disord 150, 223-230.
Maes, M., Smith, R., Christophe, A., Cosyns, P., Desnyder, R., Meltzer, H., 1996. Fatty acid composition in major depression: decreased omega 3 fractions in cholesteryl esters and increased C20: 4 omega
6/C20:5 omega 3 ratio in cholesteryl esters and phospholipids. J Affect Disord 38, 35-46.
Maheri, A., Sadeghi, R., Shojaeizadeh, D., Tol, A., Yaseri, M., Rohban, A., 2018. Depression, Anxiety, and Perceived Social Support among Adults with Beta-Thalassemia Major: Cross-Sectional Study. Korean J Fam Med 39, 101-107.
Maras, J.S., Das, S., Sharma, S., Sukriti, S., Vyas, A.K., Kumar, D., Bhat, A., Yadav, G., Choudhary, M.C., Sharma, S., 2018. Iron-overload triggers ADAM-17 mediated inflammation in severe alcoholic hepatitis. Scientific reports 8, 1-14.
Maria Michel, T., Pulschen, D., Thome, J., 2012. The role of oxidative stress in depressive disorders. Current pharmaceutical design 18, 5890-5899.
Martin-Subero, M., Anderson, G., Kanchanatawan, B., Berk, M., Maes, M., 2016. Comorbidity between depression and inflammatory bowel disease explained by immune-inflammatory, oxidative, and nitrosative stress; tryptophan catabolite; and gut–brain pathways. CNS spectrums 21, 184-198. Mednick, L., Yu, S., Trachtenberg, F., Xu, Y., Kleinert, D.A., Giardina, P.J., Kwiatkowski, J.L., Foote, D., Thayalasuthan, V., Porter, J.B., Thompson, A.A., Schilling, L., Quinn, C.T., Neufeld, E.J., Yamashita, R., 2010. Symptoms of depression and anxiety in patients with thalassemia: prevalence and correlates in the thalassemia longitudinal cohort. Am J Hematol 85, 802-805.
Meret, S., Henkin, R., 1971. Simultaneous direct estimation by atomic absorption spectrophotometry of copper and zinc in serum, urine, and cerebrospinal fluid. Clinical Chemistry 17, 369-373.
Metafratzi, Z., Argyropoulou, M., Kiortsis, D., Tsampoulas, C., Chaliassos, N., Efremidis, S., 2001. T 2 relaxation rate of basal ganglia and cortex in patients with β-thalassaemia major. The British journal of radiology 74, 407-410.
Mohammad, A., Carey, J.J., Storan, E., Scarry, M., Coughlan, R.J., Lee, J.M., 2013. High prevalence of fibromyalgia in patients with HFE-related hereditary hemochromatosis. J Clin Gastroenterol 47, 559-564. Moraes, J.B., Maes, M., Roomruangwong, C., Bonifacio, K.L., Barbosa, D.S., Vargas, H.O., Anderson, G., Kubera, M., Carvalho, A.F., Nunes, S.O.V., 2018. In major affective disorders, early life trauma predict increased nitro-oxidative stress, lipid peroxidation and protein oxidation and recurrence of major affective disorders, suicidal behaviors and a lowered quality of life. Metabolic brain disease 33, 1081-1096.
Moylan, S., Berk, M., Dean, O.M., Samuni, Y., Williams, L.J., O'Neil, A., Hayley, A.C., Pasco, J.A., Anderson, G., Jacka, F.N., Maes, M., 2014. Oxidative & nitrosative stress in depression: why so much stress?
Neurosci Biobehav Rev 45, 46-62.
27
Nasiri, M., Hosseini, H., Shahmohammadi, S., 2014. Mental health status in patients with Thalassemia major in Iran. Journal of Pediatrics Review 2, 55-61.
Nnah, I.C., Wessling-Resnick, M., 2018. Brain iron homeostasis: a focus on microglial iron. Pharmaceuticals 11, 129.
O'Brien-Ladner, A.R., Nelson, S.R., Murphy, W.J., Blumer, B.M., Wesselius, L.J., 2000. Iron Is a Regulatory Component of Human IL-1 β Production: Support for Regional Variability in the Lung. American journal of respiratory cell and molecular biology 23, 112-119.
Opheim, R., Moum, B., Grimstad, B.T., Jahnsen, J., Prytz Berset, I., Hovde, Ø., Huppertz-Hauss, G., Bernklev, T., Jelsness-Jørgensen, L.P., 2020. Self-esteem in patients with inflammatory bowel disease. Qual Life Res.
Pradhan, P.V., Shah, H., Rao, P., Ashturkar, D., Ghaisas, P., 2003. Psychopathology and self-esteem in chronic illness. Indian J Pediatr 70, 135-138.
Qiu, D., Chan, G.-F., Chu, J., Chan, Q., Ha, S.-Y., Moseley, M., Khong, P.-L., 2014. MR quantitative susceptibility imaging for the evaluation of iron loading in the brains of patients with β-thalassemia major. American Journal of Neuroradiology 35, 1085-1090.
Richardson, A.C., Heath, A.-L.M., Haszard, J.J., Polak, M.A., Houghton, L.A., Conner, T.S., 2015. Higher body iron is associated with greater depression symptoms among young adult men but not women: observational data from the daily life study. Nutrients 7, 6055-6072.
Ringle, C., Wende, S., Becker, J.J.R.f.h.w.s.c., 2015. SmartPLS 3 [computer software].
Sami Kh, S., Al-Hamzawi, A., 2009. Psychoneurotic Profiles Of Thalassemia. Al-Qadisiyah Medical Journal 5, 23-38.
Sari, T.T., Gatot, D., Akib, A.A., Bardosono, S., Hadinegoro, S.R., Harahap, A.R., Idjradinata, P.S., 2016. Immune response of thalassemia major patients in Indonesia with and without splenectomy. Acta Medica Indonesiana 46.
Shah, F.T., Sayani, F., Trompeter, S., Drasar, E., Piga, A., 2019. Challenges of blood transfusions in β-thalassemia. Blood reviews, 100588.
Siesjö, B., Agardh, C.-D., Bengtsson, F., 1989. Free radicals and brain damage. Cerebrovascular and brain metabolism reviews 1, 165-211.
Slyepchenko, A., Maes, M., Jacka, F.N., Köhler, C.A., Barichello, T., McIntyre, R.S., Berk, M., Grande, I., Foster, J.A., Vieta, E., Carvalho, A.F., 2017. Gut Microbiota, Bacterial Translocation, and Interactions with Diet: Pathophysiological Links between Major Depressive Disorder and Non-Communicable Medical Comorbidities. Psychotherapy and psychosomatics 86, 31-46.
Stockings, E., Degenhardt, L., Lee, Y.Y., Mihalopoulos, C., Liu, A., Hobbs, M., Patton, G., 2015. Symptom screening scales for detecting major depressive disorder in children and adolescents: a systematic review and meta-analysis of reliability, validity and diagnostic utility. Journal of affective disorders 174, 447-463.
Stringaris, A., Maughan, B., Copeland, W.S., Costello, E.J., Angold, A., 2013. Irritable mood as a symptom of depression in youth: prevalence, developmental, and clinical correlates in the Great Smoky
Mountains Study. Journal of the American Academy of Child & Adolescent Psychiatry 52, 831-840. Thein, S.L.J.C.S.H.p.i.m., 2013. The molecular basis of β-thalassemia. 3, a011700.
Töret, E., Karadaş, N., Gökçe, N., Kaygusuz, A., Karapınar, T.H., Oymak, Y., Gözmen, S., 2018. Quality of Life and Depression in Turkish Patients with β-Thalassemia Major: A Cross-Sectional Study. Hemoglobin 42, 326-329.
Twayej, A.J., Al-Hakeim, H.K., Al-Dujaili, A.H., Maes, M., 2019. Lowered zinc and copper levels in drug-naïve patients with major depression: Effects of antidepressants, ketoprofen and immune activation. The World Journal of Biological Psychiatry, 1-12.
28
Wessling-Resnick, M., 2010b. Iron homeostasis and the inflammatory response. Annu Rev Nutr 30, 105-122.
Wichers, M.C., Maes, M., 2004. The role of indoleamine 2,3-dioxygenase (IDO) in the pathophysiology of interferon-alpha-induced depression. J Psychiatry Neurosci 29, 11-17.
Yahia, S., El-Hadidy, M.A., El-Gilany, A.H., Anwar, R., Darwish, A., Mansour, A.K., 2013. Predictors of anxiety and depression in Egyptian thalassemic patients: a single center study. Int J Hematol 97, 604-609.
Yengil, E., Acipayam, C., Kokacya, M.H., Kurhan, F., Oktay, G., Ozer, C., 2014. Anxiety, depression and quality of life in patients with beta thalassemia major and their caregivers. Int J Clin Exp Med 7, 2165-2172.
29
Table 1: Results of Explanatory Factor Analysis (EFA) performed on selected Children's Depression Inventory items in 164 children.
Self-esteem Social-irritability Physiosomatic Key Depression Features Loadings Items Loadings Items Loadings Items Loadings Items
Items / Factor Loadings
0.822 2 0.643 11 0.505 15 0.664 1 0.872 3 0.651 12 0.510 16 0.866 4 0.682 7 0.521 20 0.531 17 0.636 5 0.571 8 0.591 22 0.732 18 0.484 6 0.781 14 0.540 26 0.608 19 0.544 10 0.498 23 0.780 27 - - - -
EFA model quality data
0.781 0.729 0.733 0.759 Keiser-Meier-Olkin test 0.021 0.032 0.042 0.000
Root mean Square Error
0.0706 (0.0783) 0.0783 (0.090)
0.0663 (0.0783) 0.0476 (0.0783)
Root Mean square of residuals
0.0494 0.0575
0.0540 0.0312
Weighted Root Mean Square Residuals
0.999 0.994
0.987 1.016
Comparative Fit index
1.000 0.997
0.992 1.000
Goodness of Fit Index
0.577 0.485 0.465 0.524 Explained variance 0.946 0.901 0.860 0.916
Factor determinacy index
0.849 0.784 0.710 0.767 Cronbach alpha 0.916 0.967 0.952 0.984 Unidimensional Congruence 0.235 0.225 0.252 0.226 MIREAL
30
Table 2: Differences in symptom subdomains, socio-demographic, and clinical data between 4 diagnostic groups.
P df
F/χ2 TDT+SIRR D
N=41 TDT+LSE C
N= 32 TDT B
N= 38 HCC A
N= 53 Variables
<0.001 3/158
72.81 3.55 (0.18) A,B
3.55 (0.22) A,B 1.62 (0.18) A,C,D
0.65 (0.15) B,C,D Key depression*
<0.001 3/158
71.80 4.93 (0.22) A,B,C
4.04 (0.26) A,B,D 3.11 (0.22) A,C,D
1.10 (0.18) B,C,D Physio-somatic*
<0.001 3/158
109.71 1.88 (0.18) A,B
5.15 (0.22) A,B 1.85 (0.18) A,C,D
0.43 (0.15) B,C,D Self-esteem*
<0.001 3/158
125.45 5.48 (0.20) A,B,C
4.07 (0.24) A,B,D 1.81 (0.20) A,C,D
0.93 (0.17) B,C,D Irritability*
<0.001 3/158
252.78 15.83 (0.44) A,B,C
16.79 (0.53) A,B,D
8.37 (0.44) A,C,D
3.10 (0.37) B,C,D
CDI total 22 items*
<0.001 3/160
19.70 7.6 (1.9) A,C
10.9 (1.5) A,B,D 8.3 (2.1) C
8.9 (1.9) C,D Age (years)
0.938 3
0.41 23 / 18
16/16 19 / 19 27/26 Sex (M/F) 0.296 3 3.70 12/29 12/20 10/28 10/43 Rural/Urban <0.001 2/108 6.94 87.3 (40.9) A
84.6 (36.9) A 60.0 (26.2) C,D
- # Transfusions 0.079 2/108 2.60 8.9 (4.5) 9.9 (5.0) 7.4 (4.4) - # Hospitalizations
All results are shown as mean (SE) after covarying for age and sex. Other results are shown as mean (SD).
HCC: healthy control children, TDT: transfusion-dependent thalassemia, TDT+LSE: TDT with depression and low self-esteem, TDT+SIRR: TDT with depression and social-irritability
31
Table 3: Associations between the clinical diagnosis of depression and the cluster analysis-generated solution
Diagnosis HCC TDT TDT+LSE TDT+SIRR Total
HC 53 0 0 0 53
TDT 0 38 11 8 57
TDT+MDD 0 0 21 33 54
Total 53 38 32 41 164
Clinical diagnosis: HCC: healthy control children, TDT: transfusion-dependent thalassemia group, TDT+MDD: depression due to TDT.
32
Table 4: Differences in iron metabolism biomarkers between healthy control children (HCC), transfusion-dependent-thalassemia (TDT), and TDT with and without depressive symptom domains including lowered self-esteem and social-irritability.
Variables (z
scores) HCC
A TDTB TDT+LSEC TDT+SIRRD F df P
Iron -0.907 (0.105) B,C,D 0.297 (0.125) A,C 0.838 (0.151) A,B,D 0.243 (0.126) A,C 40.19 3/158 <0.001 UIBC 0.690 (0121) B,C,D -0.220 (0.144) A -0.470 (0.174) A -0.321 (0.146) A 16.38 3/158 <0.001
TS% -0.952 (0.103) B,C,D 0.309 (0.123) A,C 0.700 (0.148) A,B 0.398 (0.124) A 43.51 3/158 <0.001 Tf -0.212 (0.135) c 0.006 (0.161) 0.339 (0.194) A 0.003 (0.162) 1.88 3/158 0.135 Ferritin -1.244 (0.070) B,C,D 0.454 (0.083) A,D 0.632 (0.100) A 0.695 (0.084) A,B 158.97 3/158 <0.001 zFe+zTS+zFerritin - 2.070 (0.246) B,C,D 0.612 (0.293) A,C 1.887 (0.353) A,B,D 0.644 (0.295) A,C 37.91 3/158 <0.001
Tf: Transferrin concentration, TS%: transferrin saturation percentage, UIBC: unsaturated iron-binding capacity, zFe+zTS+zFerritin: index of iron overload computed as z Fe + z TS% + z ferritin
Cluster analysis-generated solution: HCC: healthy control children, TDT: transfusion-dependent thalassemia, TDT+LSE: TDT with depression and low self-esteem, TDT+SIRR: TDT with depression and high social-irritability scores.
33
Table 5: Differences in immune biomarkers between healthy control children (HCC), transfusion-dependent-thalassemia (TDT), and TDT with and without depressive symptom domains including lower self-esteem and social-irritability scores.
Variables (z scores) HCCA TDTB TDT+LSEC TDT+SIRRD F df p
Interleukin-1β -0.825 (0.111) B,C,D 0.075 (0.132) A,C,D 0.689 (0.159) A,B 0.461 (0.133) A,B 30.66 3/158 <0.001
Tumor necrosis factor-α -0.862 (0.109) B,C,D 0.237 (0.130) A,D 0.287 (0.157) A 0.675 (0.132) A,B 36.62 3/158 <0.001 CCL-11 (eotaxin) 0. 391 (0.132) B,C -0.228 (0.157) A -0.386 (0.189) A -0.016 (0.158) 5.14 3/158 0.002 Interleukin-10 -0.621 (0.123) B,C,D 0.478 (0.147) A,C -0.039 (0.177) A,B 0.400 (0.148) A 14.11 3/158 <0.001 zTNFα+zIL1β -1.011 (0.097) B,C,D 0.197 (0.115) A,C,D 0.571 (0.139) A,B 0.680 (0.116) A,B 57.31 3/158 <0.001 z(zTNFα+zIL1β)-zIL-10 -0.389 (0.162) C,D -0.282 (0.193) C,D 0.609 (0.233) A,B 0.280 (0.195) A,B 5.96 3/158 0.001
Zinc -0.285 (0.136) 0.169 (0.161) -0.012 (0.195) 0.239 (0.163) 2.51 3/158 0.061
Copper -0.177 (0.138) B,D 0.140 (0.164) A -0.075 (0.198) 0.149 (0.166) B 1.05 3/158 0.374
Cluster analysis-generated solution: HCC: healthy control children, TDT: transfusion-dependent thalassemia, TDT+LSE: TDT with depression and low self-esteem, TDT+SIRR: TDT with depression and high social-irritability scores.
zTNFα+zIL1β: computed as z interleukin-1β + z tumor necrosis factor-α.
34
Table 6: Results of multiple regression analysis with symptom domains as dependent variables and iron status and immune biomarkers as explanatory variables.
Dependent Variables
Explanatory
Variables β t p F model df p R2
#1. Key depression
Model 32.30
3/160 <0.001 0.377
Ferritin 0.401 4.94 <0.001
zTNF+zIL-1β 0.247 3.05 0.003
Age 0.179 2.86 0.005
#2. Physiosomatic
Model 37.40
3/160 <0.001 0.412
Ferritin 0.470 6.69 <0.001
IL-1β 0.221 3.14 0.002
Copper 0.157 2.58 0.011
#3. Self-esteem
Model 50.72
3/160 <0.001 0.487
Iron 0.280 4.13 <0.001
Age 0.440 7.76 <0.001
Ferritin 0.334 4.93 <0.001
#4. SIRR
Model 52.81
2/161 <0.001 0.396
Ferritin 0.439 5.51 <0.001
zTNF+zIL-1β 0.250 3.14 0.002
#5. PC4PC Model 52.92 4/159 <0.001 0.571
Ferritin 0.443 6.01 <0.001
zTNF+zIL-1β 0.252 3.63 <0.001
Age 0.134 2.58 0.011
TS% 0.165 2.48 0.014
#6. PC4PCs IN HCC
Model 10.72 2/50 <0.001 0.300
Age 0.444 3.69 0.001
Copper 0.249 2.07 0.043
35
Number transfusions 0.370 4.28 <0.001
zTNF+zIL-1 β 0.225 2.60 0.011
IL-1β: interleukin-1β, TNF-α: tumor necrosis factor-α.
zTNFα+zIL1β: computed as z interleukin-1β + z tumor necrosis factor-α.
36
37
38
Figure 3: The partial regression of the first principal component (PC) extracted from four Child Depression Inventory (CDI)
40
Figure 4: Results of Partial least Squares (PLS) with construction of a pathway-phenotype based on the four subdomain scores extracted from the Child Depression Inventory, combined with iron overload status and immune biomarkers. Shown are loadings (p values) for the outer model and pathway coefficients (p values) obtained by complete PLS analysis performed on 5000 bootstrap samples.
42
Figure 5: Construction of higher-order factors, namely an exposure-pathway-phenotype based on latent vectors (LVs) extracted from the symptom phenome (four symptom dimensions) and the exposome. The latter, in turn, is a higher-order construct based on LVs extracted from all inflammatory, iron overload, and external exposure indicators. The latter were extracted from different indicators as shown in this figure. The data in the circles show the composite reliabilities of all constructs
43