94
What does the Development Strategy of the Mutual Fund Industry?
Joe-Ming Lee
Department of Banking and Finance, Tamkang University 151, Yin-Chuan Road, Tamsui, New Taipei City,
Taiwan, ROC
Abstract
This article applies the ARMAX- GARCH model to investigate mutual fund industry the scale development strategy in Taiwan. Mutual fund industry development strategy of follow the stock market or the bond market index, when the stock market is good, all the investment trust industry on the issue of equity funds, on the contrary, when the bond market, issuance of bond funds, for a short times strategies to meet the needs of investors and highlights the mutual fund industry in Taiwan lack of long-term development strategy, we believe that the development strategy of the mutual fund market require long-term development strategy.
Keywords:Mutual Fund Industry, Development Strategy, ARMAX- GARCH model
Motivation and Introduction
1Mutual fund may be a source of value for the majority of their investors, but they may also cause distortions in the motivation and decisions of fund managers. The first reason is that fund portfolio managers do not work directly for their funds’ beneficiaries, but rather for a mutual fund organization In other words, fund companies may induce fund managers to sacrifice the interest of fund investors in order to maximize the overall companies’ benefit. Another reason
1Corresponding author’s email:
is that mutual fund profits are a direct function of fees charged and assets managed.
The Taiwan’s industry of mutual fund has boomed since the year 2000. Due to the special features and incentives of bond fund, its scope reaches the peak in May 2004 with the amount of 2.4 trillion NTD. There’s reason behind the fast growth of bond fund. In the past, bond fund is an unique product that combines the advantage of monetary fund’s high liquidity and higher return rate than saving deposit. In addition, there isn’t dividend distribution and taxation. All these factors made it an irresistible product. Nevertheless, as the market’s interest rate increase, the over-investment of structure
Journal of Asian Business Strategy
95
notes and the problems of splitting the notes and manipulating the net value of funds, leads to the Union Security Investment Trust incident in July 12, 2004. This incident made the market emphasize more on the issue regarding structure notes. However, bond funds focus on pursuing short-term high returns and increasing their scale by investing in structured products with poor liquidity. The problem arises when bond funds allow clients to redeem and take their proceeds the next day, engendering a liquidity divergence between the bond funds’ own assets and those offered to clients and increasing the funds’ liquidity risks. In order to avoid risk, Taiwan’s Financial Supervisory Commission (FSC) decided to carry out a bond segregation policy before the end of 2006. The system split up bond funds into fixed income bond funds and quasi money market bond funds. This event would affect the development of mutual fund industry. In principle, mutual fund industry is a highly regulated industry.
We believe that these major events, tell us whether the mutual fund industry is the lack of development strategy, likely because no development strategy, resulting in the mutual fund industry into vicious border indisputable environment, we also worry about the mutual fund industry, because there is no development strategy, with the economic environment myth operating direction.
Most studies in the bond fund literature focus on funds’ performances, credit quality, and value at risk (VaR). Some previous
research studies such as Blake, et al. (1993) used linear and non-linear models to examine bond funds’ performances. Elton et al. (1995) first developed and tested the relative pricing models (based on the Arbitrage Pricing Theory, or APT) to explain the expected returns and performance of bond funds. These two research studies concluded that active funds do not outperform passive benchmarks. Only Morey and O’Neal (2006) examined the portfolio credit quality holding and daily return patterns for bond mutual funds. They found that bond funds on average hold significantly more government bonds during disclosure than during non-disclosure.
As mentioned above, we do not find any study in the literature on development strategy in mutual fund industry. The necessity of the mutual fund industry development strategy will affect the overall industry operating niche, more importantly, the mutual fund industry, fund managers need to cultivate the expertise of the respective asset management company, to make professional business environment.
The remainder of the paper is organized as follows. Section 2 takes a brief review of the ARMAX-GARCH model. Section 3 provides our empirical results. Section 4 is conclusion and remarks.
Brief Review of Models
96
of the fund. A fund with a year or two of lucky performance will experience an increase in fund size. First, constructed multiple regression analysis model, test the correlation Company Asset Management fund manager fee income with the main types of mutual funds, as the analysis of the industrial structure model and we take into account the overall economy and the stock and bond markets change control variables. The Multiple Regression is:
7 1
i
a
pb
i iX
i pt
(1)Where
i= the management fee,a
p=intercept of the model,
b
i= be estimated regression coefficient, the stock fund,X
2=the balance fund,
X
3= the bond fund ,X
4=the others type fund,
X
5=bond marketindex,
X
6= GDP,X
7= =stock market index,pt
= the residuals of the model.3 1
_
i p i i pti
StockFund
Size
a
b
X
(2) Where
X
1=bond market index,X
2=GDP,
X
3= =stock market index,
pt= the residuals of the model.3 1
_
i p i i pti
BondFund
Size
a
b
X
(3) Where
X
1=bond market index,X
2=GDP,
X
3= =stock market index,
pt= the residuals of the model.The models for the univariate variables must take into account the characteristics of the variables. Return series have been successfully modeled by ARMAX-GARCH
model assuming Gaussian residuals are as follows.
3
, 1 ,
1
,
1, 2,....
i
a
pb
i iX
t p tt
T
(4a)
)
1
,
0
(
~
,
,t
h
tZ
tZ
tN
p
(4b)
1 2
1 2
t t tt
h
h
(4c)
Empirical Result Analysis
As described above, this article investigates of Structural Changes in Mutual Fund Industry in Taiwan, and thus the dataset consists of mutual fund issued in Taiwan. For the purpose of comparison, the sample period for the study covers ten years, from January 2001 to June 2010. Table 1 presents a total of mutual fund scale and date of establishment. The data were obtained from the Taiwan Economic Journal (hence TEJ) database.
Table 1 reports the descriptive statistics of the manager fee, stock fund, balance fund, bond fund, and other fund. Here, manager fee between NT$637 to NT$ 2,009, and the mean is NT$ 1,193, we can see a great gap of the management Fee, which shows that management fee influenced by variables produce large fluctuations.
97
time earlier than bond funds, the Balance fund scale, the value is between NT$ 27,168 to NT$ 218,258, and the mean is NT$ 86,085, and the Bond fund scale, the value is between NT$ 198,782 to NT$ 2,435,934, and the mean is NT$ 1,381,238 ,show that bond funds are the largest types of domestic mutual funds, the other fund scale, the value is between NT$ 3,626 to NT$ 956,231, and the mean is NT$ 141,150. In short, it should be able to view the amount of the overall size of the mutual fund market cannot be the emphasis on fixed kinds of mutual funds, such as bond funds, asset management companies emphasis on the issue of the bond fund, resulting in a risk of the mutual fund industry crisis, and finally led to the mutual fund market investors panic. We think the mutual fund industry is related to the security of all investment assets and market risk, when the fixed types of funds too large, the competent authorities should persuade the asset management companies’ morality
fixed type of issue size of the Fund. Guide the development of the mutual fund industry toward economies of scale, is the best long-term development strategy. From the point of view of professional managers, mutual funds, the market should have a long-term strategy, as well as asset management company’s investment professionals to the professional development of managers to be able to let the average size of the mutual fund.
Overall, the size of the mutual funds are very different, in particular, there is a significant deviation between the different types of mutual funds. Possible reason is that the investment trust companies prefer to issue Stock funds and bond funds, also implies that investors tend to invest in large-scale mutual funds. The GDP is between-2.960 and 3.773%. In addition, all of the Jarque-Berra (J-B) statistics reject the null hypotheses of normality distribution.
Table1: Summary Statistics of Mutual funds’ Scale Management
fee (NT$ million)
Stock fund scale (NT$ million)
Balance fund scale (NT$ million)
Bond fund scale (NT$ million)
Other fund scale (NT$ million)
GDP (%)
Mean 1,193 468,261 86,085 1,381,238 141,150 1.003 Std 300 187,413 48,789 503,640 130,691 1.584 Max 2,009 938,504 218,258 2,435,934 956,231 3.773
Min 637 220,266 27,168 198,782 3,626 -2.960
Skewness 0.398 0.799 0.834 0.407045 2.104 -0.672 Kurtotsis -0.351 -0.721 -0.118 -1.02145 10.750 0.0340 J-B 10.049*** 15.397*** 14.003*** 8.530*** 666.354*** 9.050***
Note: P-value is the probability that the data come from the normal distribution, according to the
Jarque -Berra normality test.
In statistics, a unit root test tests whether a time series variable is non-stationary using an autoregressive model. A well-known test
98
use the existence of a unit root as the null hypothesis.
In order to test the long-run relationships and avoid the spurious regression among Management fee, Stock fund scale, Balance fund scale, Bond fund scale, other fund scale
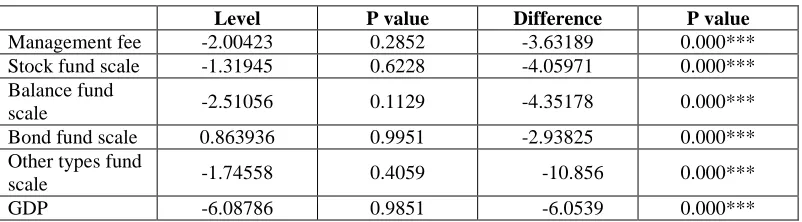
and GDP. Based on the results of the stationary test of variables in Table 2, it is abundantly clear that all the variables have stationary characteristics since the nulls of the unit root are mostly rejected. In other words, all variables were integrated of order one.
Table 2: Unit Root Test Results
Level P value Difference P value
Management fee -2.00423 0.2852 -3.63189 0.000*** Stock fund scale -1.31945 0.6228 -4.05971 0.000*** Balance fund
scale -2.51056 0.1129 -4.35178 0.000***
Bond fund scale 0.863936 0.9951 -2.93825 0.000*** Other types fund
scale -1.74558 0.4059 -10.856 0.000***
GDP -6.08786 0.9851 -6.0539 0.000***
Notes: The numbers in brackets indicate p-values. ***, **, and * indicate significance at the 0.01, 0.05 and
0.1 level, respectively.
Table 3 exhibits the estimated coefficients of the ARMAX-GARCH model results. We apply the ARMAX-GARCH model above to observe the management fee correlation between the Stock fund scale, Balance fund scale, Bond fund scale and other types fund scale and so on.
We found a positive significant relationship between fund management fees and equity funds, balanced funds, bond funds, but with
negative significant relationship between other types of funds, the main sources of management fees to the equity funds, balance funds, bond funds mainly other types of funds does not have to contribute, Furthermore, the fund management fees and stock market indices, bond market indices are not significant negative relationship, but GDP is positively, implies that GDP better asset management company to be able to have better management income.
Table 3: Estimated Coefficients of ARMAX-GARCH Model Results
Coefficient p-value
const -5.1824 0.0000***
Stock fund scale 0.62317 0.0000***
Balance fund scale 0.17566 0.0006**
Bond fund scale 0.17921 0.0000***
other types fund scale -0.0032577 0.0000***
Stock market index -0.0015309 -0.1762
GDP 0.024196 0.0000***
99
Notes: The numbers in brackets indicate p-values. ***, ***, and * indicate significance at the 0.01, 0.05 and
0.1 levels, respectively.
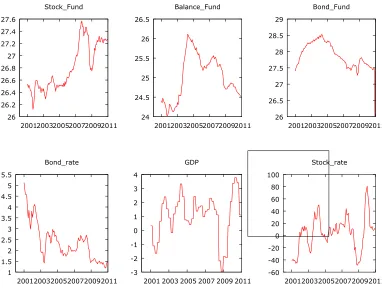
Figure 1 shows the asset management companies do not have the long-term development strategy, said that the operation of mutual funds to short-term, not the long-term operating performance of mutual funds and indirectly caused investors to short-term performance for investment decisions. More important to find the asset management companies operating mutual
funds to short-term development strategy, and no long-term development strategy of its own expertise, resulting in the mutual fund industry are blindly follow the market index.
As for the relationship between the more specific issue of equity funds or bond funds and the stock market or bond market index, we need to further analyze the correlation.
26 26.2 26.4 26.6 26.8 27 27.2 27.4 27.6
2001 2003 2005 2007 2009 2011 Stock_Fund
24 24.5 25 25.5 26 26.5
2001 2003 2005 2007 2009 2011 Balance_Fund
26 26.5 27 27.5 28 28.5 29
2001 2003 2005 2007 2009 2011 Bond_Fund
1 1.5 2 2.5 3 3.5 4 4.5 5 5.5
2001 2003 2005 2007 2009 2011 Bond_rate
-3 -2 -1 0 1 2 3 4
2001 2003 2005 2007 2009 2011 GDP
-60 -40 -20 0 20 40 60 80 100
2001 2003 2005 2007 2009 2011 Stock_rate
Figure 1: Mutual Fund versus Stock Market Index and so on
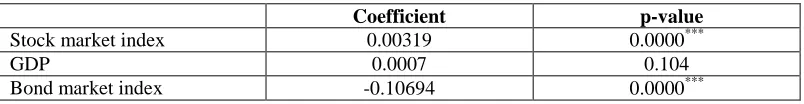
Table 4 shows the significant positive relationship between equity funds and the stock market index, but no significant relationship between GDP and determine that equity funds based on stock market
108
funds, or in the stock market index fell, to stop the issuance of equity funds.
Table 4: Stock fund of ARMAX- GARCH Model Results
Coefficient p-value
Stock market index 0.00319 0.0000***
GDP 0.0007 0.104
Bond market index -0.10694 0.0000***
Notes: The numbers in brackets indicate p-values. ***, ***, and * indicate significance at the 0.01, 0.05 and
0.1 levels, respectively.
Table 5 reports bond funds and the bond market index between the significant positive relationship, but no significant relationship between GDP and determined that the Bond Fund pursuant to the bond market index rose or fell, decided to more or less issued equity fund, when the bond market index rose, a large number of asset management companies to issue bond funds
or bond market index plunged to stop the issuance of the bond funds.
Important evidence tells us why the 2001-2005 bond funds continues to expand, and even then generate market risk, the collapse of investor confidence, proved once again that the asset management company in the short-term development strategy in the business market.
Table 5: Bond Fund of ARMAX- GARCH Model Results
Coefficient p-value
Stock market index 0.00319 0.0000***
GDP 0.0007 0.104
Bond market index -0.10694 0.0000***
Notes: The numbers in brackets indicate p-values. ***, ***, and * indicate significance at the 0.01, 0.05 and
0.1 levels, respectively.
Conclusion and Remarks
The empirical results show that the mutual fund industry in Taiwan fund manager fee income from stock funds, bond funds, balanced funds, and other types of funds is one of the few, implied imbalance in the mutual fund industry in Taiwan issued Fund.
There is a positive and significant relationship between the fund manager fees and GDP, while negative not significant relationship with the stock price index of the
101
Overall, the mutual fund industry in Taiwan, following the short-term market change investment products, does not have the long-term business strategy, and fund companies should have their own expertise types of mutual funds, professional management of individual mutual funds, and create a differentiated market.
The concept of education investors long-term investment is important, and can have asset allocation optimization concept, not when most people choose to invest in stock funds or bond funds, you think we should follow up the majority investment, lost investment the value of mutual funds, the last also stressed the mutual fund industry should have a long-term business strategy, in order to select a suitable mutual fund investment in a healthy market.
References
Dickey, D. A. and W. A. Fuller (1979). Distribution of the Estimators for Autoregressive Time Series with a Unit Root. Journal of the American Statistical Association, 74: 427–431.
Akaike, H. (1974). A new look at the statistical model identification. IEEE Transactions on Automatic Control, 19(6): 716-723.
Blake, C., Elton, E. and Gruber M. (1993). The performance of bond mutual funds. Journal of Business, 66(3): 371-403. Bhargava, A. (1986). On the Theory of
Testing for Unit Roots in Observed Time Series. Review of Economic Studies, 53: 369-384.
Bierens, H. J. (2001). Unit Roots. Ch. 29 in A Companion to Econometric Theory, ed B. Baltagi, Oxford, Blackwell Publishers, 610-33.
Chen, Y., Ferson, W. E. and Peters, H. (2010). Measuring the timing ability and performance of bond mutual funds. Journal of Financial Economics, 98(1): 72-89.
Chiou, S. C. and Tsay, R. S. (2008). A copula-based approach to option pricing and risk assessment. Journal of Data Science, 6: 273-301.
Detzler, M. (1999). The performance of global bond mutual funds. Journal of Banking and Finance, 23: 1195-217. Elton, E. J., Gruber, M. J. and Blake C. R.
(1995). Fundamental economic variables, expected returns, and bond fund performance. Journal of Finance, 50(4): 1229-1256.
Engle, R. F. (1982). Autoregressive Conditional Heteroscedasticity with Estimates of the Variance of U.K. Inflation. Econometrica, 50(4): 987-1008.
Gallagher, D. R. and Jarnecic, E. (2002). The Performance of active Australian bond funds. Australian Journal of Management, 27(2): 163-185.
Hsu, C. C., Tseng, C. P. and Wang, Y. H. (2008). Dynamic hedging with futures: a copula-based GARCH model. Journal of Futures Markets, 28: 1095-1116. Joe, H. (1997). Multivariate models and
dependence concepts, London: Chapman & Hall.
102
dependence: copula functions, empirics, and risk implications. Journal of Banking and Finance, 30: 1171-1199. Lee,Wo-Chiang and Lee, Joe-Ming (2012).
An Empirical Investigation into the Effects of a Bond Fund Segregation Policy–Evidence from Taiwan. The Empirical Economics Letters (forthcoming).
Morey, M. R., and O’Neal, E. S. (2006). Window dressing in bond mutual funds. Journal of Financial Research, 29(3): 325-347.
Manner, H. and Reznikova, O. (2009). Time-varying copulas: a survey, Universite catholique de Louvain, Institut de statistique, working paper.
Mark, W. R., James, D. P., Paul, A. P. and Fran, X. (2001). Selecting a bond mutual fund: just keep it simple. Journal of Financial Planning, 14(4): 44-49.
Nelsen, R. B. (2006). Introduction to copulas, Springer Verlag, New York. 2nd Edition.
Palmon, O. and Jeffrey, P. (1991). Inflation uncertainty, real interest rate uncertainty and the liquidity premium on government bonds. The Financial Review, 26: 459-477.
Palaro, H. P. and Hotta, L. K. (2006). Using conditional copula to estimate value at risk. Journal of Data Science, 4: 93-115. Rodriguez, J. C. (2007). Measuring financial
contagion: a copula approach. Journal of Empirical Finance, 14(3): 401-423. Schwarz, G. (1978). Estimating the
dimension of a model. Annals of Statistics, 6: 461-464.