U
NDERSTANDING THE
UK’
S
P
OOR
T
ECHNOLOGICAL
P
ERFORMANCE
U
NDERSTANDING THE
UK’
S
P
OOR
T
ECHNOLOGICAL
P
ERFORMANCE
Rachel Griffith and Rupert Harrison
Institute for Fiscal Studies and University College London
June 2003
Acknowledgements: The authors would like to thank Nick Bloom, Robert Chote, Paul Geroski, Mike Hawkins, Helen Simpson and John Van Reenen for useful discussions. This Briefing Note has been written with financial support from the ESRC Centre for Microeconomic Analysis of Fiscal Policy at the Institute for Fiscal Studies. All errors and omissions remain the responsibility of the authors.
Summary
In this Briefing Note, we document and disentangle the trends in UK research and development (R&D) over the period 1981–2000, and compare the UK’s performance with that of the USA. We show the following:
• The UK’s R&D performance over the period 1981–2000 was poor relative to the USA and other G5 countries.
• Over the 1980s, reductions in government-funded R&D account for three-quarters of the UK’s poor R&D performance relative to the USA. Roughly two-thirds of these reductions are associated with cuts in defence spending.
• Weak growth in R&D funded and conducted by business accounts for only one-sixth of the UK’s poor performance relative to the USA over the 1980s, but accounts for all of the UK’s poor performance over the 1990s.
• The UK’s poor business R&D performance relative to the USA was due to weak within-sector growth in R&D rather than a shift in output towards low-R&D sectors. The relative decline in within-sector R&D intensity was particularly extreme during the mid-1990s.
• The UK’s within-sector decline in R&D intensity relative to the USA was in both the manufacturing and non-manufacturing sectors. During the mid-1990s, it was largely concentrated in the manufacturing sector. However, towards the end of the 1990s, the USA experienced a large increase in non-manufacturing R&D intensity that was not seen in any of the other G5 countries.
Introduction
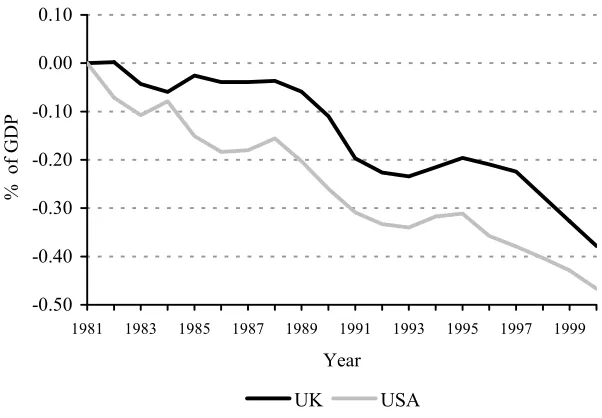
The UK’s poor productivity performance relative to other leading industrial countries has been an important focus for government policy and analysis in recent Budgets and Pre-Budget Reports. Academics and policy-makers have emphasised the importance of investment in research and development (R&D) as a contributor to long-term productivity growth. In response, the government has recently introduced tax credits designed to encourage R&D spending by business, as well as increasing the amount of money going to research in universities. In the 2003 Budget, the Chancellor extended the number of companies that would qualify for the small companies’ R&D tax credit. Nonetheless, there is no clear evidence yet of an end to the steady decline seen in the UK’s R&D performance over the past two decades, relative to the USA and other G5 countries.
Understanding why the UK has performed relatively poorly in terms of R&D is important for predicting whether current policies can halt this decline and ultimately narrow the productivity gap. This Briefing Note documents and disentangles trends in UK R&D over the period 1981–2000. We first disaggregate trends in gross expenditure on R&D (GERD) and show which components of GERD were responsible for the UK’s relative decline. We then disaggregate the largest component, business expenditure on R&D (BERD), by sector.
The UK’s R&D performance: the headline figures
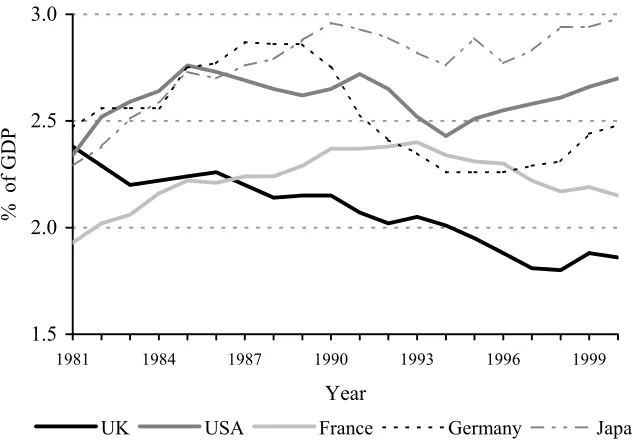
Figure 1 shows that gross expenditure on R&D as a percentage of GDP (GERD intensity) has declined steadily in the UK over the last two decades, while in other G5 countries it has either increased or shown little overall change.1
Figure 1. GERD intensity: G5 countries
1.5 2.0 2.5 3.0
1981 1984 1987 1990 1993 1996 1999
Year
% of GDP
UK USA France Germany Japan
Note: Data for Germany cover West Germany until 1990 and unified Germany from 1991. Source: OECD, Main Science and Technology Indicators, 2002.
The UK began the 1980s just above the USA, near the top of the group, but then diverged markedly from the upwards paths of Germany, Japan and the USA, falling below France after 1986. While all G5 countries experienced stagnant or falling GERD intensity between 1990 and 1994, the USA, Japan and Germany showed strong increases over the second half of the decade. In contrast, the UK continued to decline after 1994, with signs of a small, but seemingly short-lived, pick-up only emerging after 1998. The overall result is that the UK now has the lowest GERD intensity of the G5 countries, almost one percentage point of GDP lower than the USA.
UK than in Germany or France during the period. However, GDP in the USA was growing faster still, and was accompanied by a noticeable rise in GERD intensity. The fact that rapid UK GDP growth in the mid-1990s was not accompanied by rising levels of GERD expenditure, in sharp contrast with the USA, is informative about the relative technological performance of the UK. This does not bode well for future economic performance more generally, as R&D is one of the principal drivers of long-term productivity growth.
Conclusion: The UK’s R&D performance over the period 1981–2000 was poor relative to the USA and other G5 countries.
Which types of R&D are responsible?
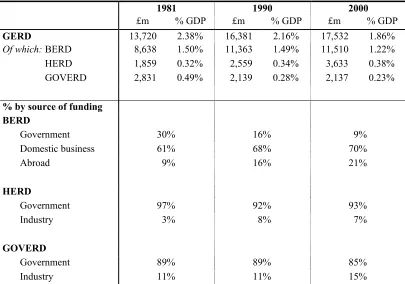
GERD can be broken down in three ways – by who conducts it, by who funds it and by its ultimate purpose. We begin by decomposing aggregate GERD according to who conducts the R&D. By far the largest component of GERD is business enterprise R&D (BERD), followed by higher education R&D (HERD), government R&D (GOVERD) and finally a relatively small amount of R&D conducted by other non-profit organisations. Table 1 shows the size of the three main components in the UK in 1981, 1990 and 2000. We can see that the fall in GOVERD as a percentage of GDP was responsible for the largest share of the decline in GERD intensity between 1981 and 1990, while BERD intensity was fairly constant over the 1980s. However, almost all of the fall in GERD intensity over the 1990s is due to a fall in BERD intensity, its largest component.
from three main sources – domestic businesses, government and abroad.2 Government-funded BERD has fallen as a percentage of total BERD and as a percentage of GDP, with the majority of this fall occurring during the 1980s.
Table 1. UK GERD by who performs it and who funds it
1981 1990 2000
£m % GDP £m % GDP £m % GDP
GERD 13,720 2.38% 16,381 2.16% 17,532 1.86%
Of which: BERD 8,638 1.50% 11,363 1.49% 11,510 1.22%
HERD 1,859 0.32% 2,559 0.34% 3,633 0.38%
GOVERD 2,831 0.49% 2,139 0.28% 2,137 0.23%
% by source of funding BERD
Government 30% 16% 9%
Domestic business 61% 68% 70%
Abroad 9% 16% 21%
HERD
Government 97% 92% 93%
Industry 3% 8% 7%
GOVERD
Government 89% 89% 85%
Industry 11% 11% 15%
Notes: Levels are in 2001 million pounds sterling, deflated by the GDP deflator. BERD, HERD and GOVERD do not sum exactly to GERD because the small private non-profit component is not shown. Source: OECD, Main Science and Technology Indicators, 2002.
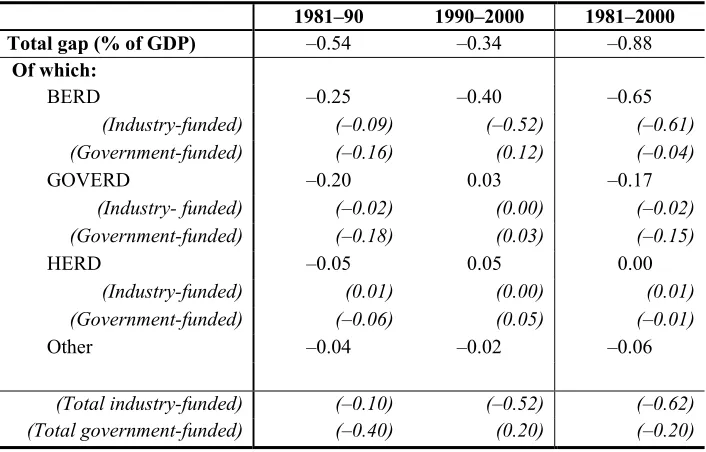
To explain the UK’s poor performance relative to the USA, we decompose the gap between the change in GERD intensity in the UK and in the USA into that part that can be attributed to each of the components of GERD. The analysis is based on comparing the path of each component in the UK with its path in the USA. The
2 In our analysis, we aggregate foreign funding and domestic business funding for BERD into a single
‘industry funding’ category because statistics on the amount of BERD funded from abroad are not available for the USA. Foreign funding is almost all from the private sector, although about 5% is EU
funding (ONS, Sources of Funds for Civil and Defence R&D in UK Businesses, London, 2002,
figures presented in Table 2 for each component are the difference between the actual change in UK intensity over the period and the change in intensity in the USA.
Table 2. Share of the gap between UK and US aggregate GERD performance explained by each component
1981–90 1990–2000 1981–2000
Total gap (% of GDP) –0.54 –0.34 –0.88
Of which:
BERD –0.25 –0.40 –0.65
(Industry-funded) (–0.09) (–0.52) (–0.61)
(Government-funded) (–0.16) (0.12) (–0.04)
GOVERD –0.20 0.03 –0.17
(Industry- funded) (–0.02) (0.00) (–0.02)
(Government-funded) (–0.18) (0.03) (–0.15)
HERD –0.05 0.05 0.00
(Industry-funded) (0.01) (0.00) (0.01)
(Government-funded) (–0.06) (0.05) (–0.01)
Other –0.04 –0.02 –0.06
(Total industry-funded) (–0.10) (–0.52) (–0.62) (Total government-funded) (–0.40) (0.20) (–0.20)
Note: Totals may not sum exactly due to rounding.
Source: OECD, Main Science and Technology Indicators, 2002.
An illustration helps to explain. The change in overall GERD intensity in the UK between 1981 and 1990 was a decline of 0.22 percentage points (from 2.38% to 2.16%). The change in overall GERD intensity between 1981 and 1990 for the USA was an increase of 0.32 percentage points (from 2.34% to 2.66%). This gives a difference of 0.54 percentage points between the UK and the USA. That is, if UK GERD intensity had followed the same path after 1981 as the USA, it would have been 0.54 percentage points higher in 1990 than it actually was (2.70% rather than 2.16%).
90 and the overall change for the USA that is explained by the BERD component is thus 0.25 percentage points of GDP (or about half of the total gap). The number is negative in the table to illustrate the fact that UK intensity fell relativeto the USA.3
The first line of Table 2 shows that the UK’s GERD intensity performance relative to the USA was worse during the 1980s than the 1990s, although both decades showed a relative decline. The decomposition shows that GOVERD plus government-funded BERD together account for two-thirds of the UK’s poor relative GERD performance over the 1980s (–0.36 out of a total –0.54 percentage points of GDP), while industry-funded BERD only accounts for one-sixth (–0.09 percentage points of GDP). Total government-funded R&D, which includes government-funded HERD, accounts for three-quarters of the UK’s poor performance over the 1980s relative to the USA (–0.40 percentage points of GDP).4 In contrast, over the 1990s, industry-funded BERD accounts for more than the whole of the UK’s poor relative performance, while government-funded R&D actually made a positive contribution. This means that government-funded R&D intensity fell less in the UK over the 1990s than in the USA.
Conclusion: Over the 1980s, reductions in government-funded R&D account for three-quarters of the UK’s poor R&D performance relative to the USA. Over the 1990s, weak growth in R&D funded and conducted by business accounts for all of the UK’s poor relative performance.
3 This comparison is intuitive and simple to calculate. However, it is based on a percentage point fall in
intensity. Where the initial level in the UK is different from that in the USA, this fall will represent a
different proportion of its initial value. An alternative comparison would thus be to consider what UK
intensity would have been had it experienced a proportionate change similar to the USA. In fact, using
this comparison yields similar conclusions.
4 These figures are affected by changes in the official status of some R&D-performing government
What was the role of defence spending?
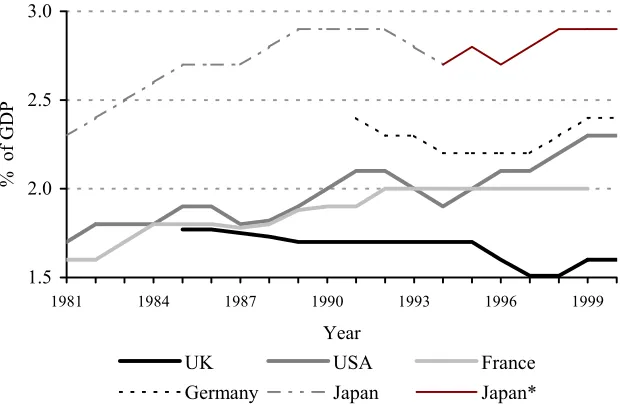
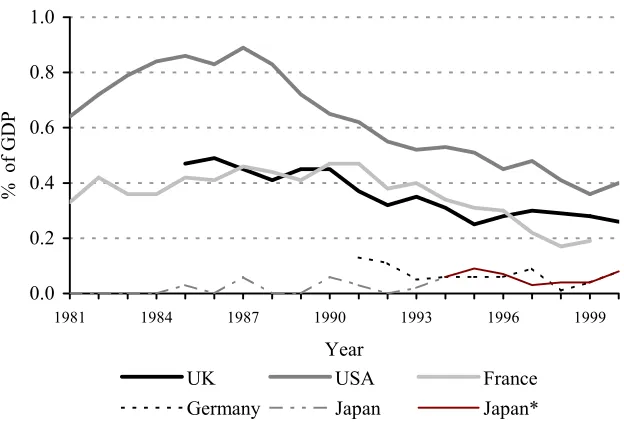
It is interesting to know to what extent the negative relative contributions of GOVERD and government-funded BERD during the 1980s were due to reductions in defence spending. As pointed out earlier, GERD can be broken down by who conducts it, by who funds it and by the ultimate purpose of the R&D. The former two were considered above; now we consider the latter. Estimated civil and defence GERD intensities for the G5 countries are presented in Figures 2 and 3. Due to data availability, the series for the UK only begin in 1985. Civil GERD intensity in the USA, the UK and France is well below total GERD intensity, with the difference accounted for by high levels of defence R&D spending. While the lack of pre-1985 data for the UK makes it difficult to draw clear conclusions about the 1980s, Figure 2 shows that the UK’s relative weakness during the 1990s is apparent in the civil GERD intensity. Figure 3 shows that UK defence GERD intensity followed a similar downward path to those of France and the USA during the late 1980s and 1990s.
Figure 2. Estimated civil GERD intensity: G5 countries
1.5 2.0 2.5 3.0
1981 1984 1987 1990 1993 1996 1999
Year
% of GDP
UK USA France
Germany Japan Japan*
Figure 3. Estimated defence GERD intensity: G5 countries
0.0 0.2 0.4 0.6 0.8 1.0
1981 1984 1987 1990 1993 1996 1999
Year
% of GDP
UK USA France
Germany Japan Japan*
Note: The Japan* numbers have been extrapolated according to total GERD intensity. Source: OECD, Main Science and Technology Indicators, 2002.
The OECD data source does not provide breakdowns of BERD or GOVERD by civil or defence purposes. However, it does provide such a breakdown for a series called ‘government budget appropriations or outlays for R&D’ (GBAORD). These data are assembled from national budgets, generally federal or central, and include payments to international organisations and other performers abroad. They are thus different from the survey-based data used to construct the GERD statistics. Nevertheless, they can be used to provide some indication of the role of defence in government spending on R&D.
government expenditure. Table 3 shows the results of such a decomposition comparing the UK with the USA.
Figure 4. Total GBAORD intensity: G5 countries
0.0 0.5 1.0 1.5
1981 1984 1987 1990 1993 1996 1999
Year
% of GDP
UK USA France Germany Japan
Note: Data for Germany cover West Germany until 1990 and unified Germany from 1991. Source: OECD, Main Science and Technology Indicators, 2002.
Table 3. Share of the gap between UK and US aggregate GBAORD performance explained by each component
1981–90 1990–2000 1981–2000
Total gap (% of GDP) –0.48 0.12 –0.36
Of which:
Defence –0.33 0.12 –0.21
Civil –0.15 0.00 –0.15
Note: Totals may not sum exactly due to rounding.
Source: OECD, Main Science and Technology Indicators, 2002.
1990s.5 Reductions in government defence spending account for around two-thirds of the relative decline over 1981–90, while reductions in other government R&D expenditure account for the remaining third. Reductions in other government R&D expenditure in the UK were fairly evenly spread across categories of government programme, but were largest in the ‘economic development’ category.6 The positive contribution of the defence component during the 1990s shows that cuts in government expenditure on defence R&D were larger in the USA over this period.
Conclusion: Roughly two-thirds of the decline in UK government-funded R&D intensity over the 1980s relative to the USA was associated with cuts in defence spending.
Business R&D: sectoral breakdown
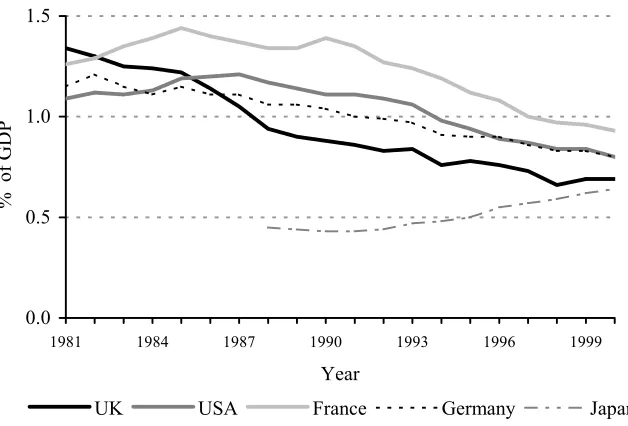
Business enterprise R&D (BERD) accounts for the largest part of UK GERD (66% in 2000). As discussed above, the relative decline in BERD intensity, and specifically industry-funded BERD intensity, has been a major factor behind the UK’s poor relative R&D performance, especially over the 1990s. Figure 5 shows BERD intensity for the G5 countries. Over the 1980s, BERD intensity remained fairly static in the UK while it rose in other G5 countries. In the 1990s, although all countries experienced falling or constant BERD intensity in the first part of the decade, BERD intensity continued to fall in the UK from 1994 to 1998 while it rose in the USA, Japan and Germany. The UK shows a small recovery after 1998, although this appears to be
5 The numbers in the first row of Table 3 roughly equate to those for total government funding in the
last row of Table 2 but are not strictly comparable.
6 For a more detailed discussion of government spending on R&D, see P. Stoneman, ‘Government
short-lived. In fact, as Table 1 shows, the level of UK spending on BERD was only slightly higher in real terms in 2000 than in 1990.7
Figure 5. BERD intensity: G5 countries
1.0 1.5 2.0
1981 1984 1987 1990 1993 1996 1999
Year
% of GDP
UK USA France Germany Japan
Note: Data for Germany cover West Germany until 1990 and unified Germany from 1991. Source: OECD, Main Science and Technology Indicators, 2002.
Was this relative decline in BERD intensity due to falling R&D intensity within particular industries or did it represent a shift in the composition of output from high- to low-R&D-intensity industries? Amongst most OECD countries, the manufacturing sector has been shrinking relative to other sectors of the economy. For example, value added in manufacturing in the UK as a percentage of total value added in the business enterprise sector was 23.4% in 1981 and 17.5% in 2000.8 Non-manufacturing industries on average have a significantly lower reported level of R&D intensity. In the UK in 1999, BERD as a percentage of value added was 6.0% in manufacturing and 0.3% in non-manufacturing. This difference arises mainly because
7 These figures have been deflated by the GDP deflator. A correct R&D deflator would include a
less formal R&D is undertaken in the service sector but also because the reporting of R&D in the service sector is less comprehensive. As a result, the expansion of the service sector relative to manufacturing would, on its own, be reflected in falling aggregate R&D intensity. If this happened to a greater extent in the UK than in other G5 countries, then this would help to explain the UK’s poor relative BERD intensity performance.
We decompose the change in aggregate BERD intensity into:
• within changes, which represent changes in intensity within sectors, by summing the change in BERD intensity during the period within each sector, weighted by its average share in value added;
• between changes, which represent industrial restructuring between sectors, by summing the changes in value added shares during the period weighted by average BERD intensity.
Details on how we do this are given in the Annex. We first decompose aggregate trends in BERD between two broad sectors, manufacturing and non-manufacturing, where the latter includes services, utilities and construction.9 We perform the within/between breakdown for the change in overall BERD intensity in each one-year period and then calculate cumulative within and between components by summing these. The cumulative within and between components can thus each be thought of as the path total intensity would have taken if the other component had been equal to zero throughout the period.
Figure 6 shows the cumulative within/between decomposition of BERD for manufacturing and non-manufacturing in the UK for the period 1981–2000. Some explanation helps in interpreting the graph. The scale on the vertical axis has been rebased to equal zero in 1981, so the value of each component in any year represents its cumulative effect on total BERD intensity since 1981. The within and between components sum in each year to the total. The contribution of each component at any
moment in time is represented by the slope of its line. Where the line slopes downwards, this means that the component is making a negative contribution to total BERD intensity. Where the line slopes upwards, it is making a positive contribution. Thus the fact that the between component slopes sharply downwards between 1988 and 1992 indicates that a shift in the composition of total output away from manufacturing and towards non-manufacturing was contributing to a reduction in total BERD intensity over this period. Equally, the fact that the within component slopes downwards between 1993 and 1997 indicates that a decline in BERD intensity within the two sectors was contributing to a decrease in total BERD intensity over this period.
Figure 6. UK within and between manufacturing and non-manufacturing cumulative decomposition
-0.40 -0.30 -0.20 -0.10 0.00 0.10
1981 1983 1985 1987 1989 1991 1993 1995 1997 1999
Year
% of GDP
Total Within Between
Sources: OECD, ANBERD database, 1999 and 2002; OECD, STAN database, 1999 and 2003; authors’ calculations.
within component is fairly static during the 1980s but is largely responsible for the dramatic overall decline and subsequent recovery during the mid-1990s. The between component shows a significant negative contribution over 1988–92 and 1997–2000, suggesting a fairly rapid shift in the composition of output towards non-manufacturing over these periods.
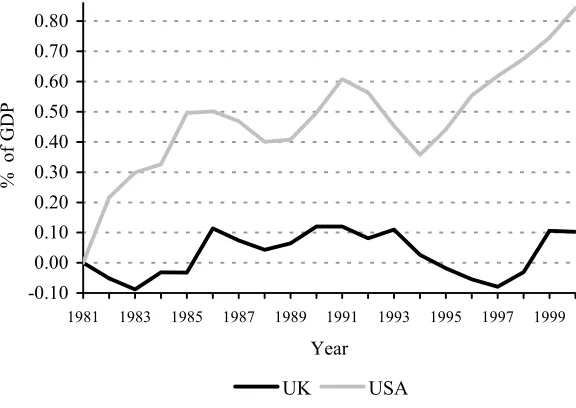
While Figure 6 shows changes in the UK over time, it does not allow us to make comparisons with the USA. In order to do this, Figure 7 compares the UK’s within component with that of the USA.10 It is clear that while in the USA the within component contributes significantly to a rise in BERD intensity over the period, in the UK it lags well behind. The divergence is especially noticeable in the mid-1990s. Figure 8 makes the same comparison for the between component. This component plays a less negative role in the UK than in the USA, indicating that the shift towards non-manufacturing sectors actually played a smaller role in the UK than in the USA.
Figure 7. Comparison of within component, UK and USA
-0.10 0.00 0.10 0.20 0.30 0.40 0.50 0.60 0.70 0.80
1981 1983 1985 1987 1989 1991 1993 1995 1997 1999
Year
% of GDP
UK USA
Sources: OECD, ANBERD database, 1999 and 2002; OECD, STAN database, 1999 and 2003; authors’ calculations.
10 The USA is not exceptional compared with the other G5 countries on this measure. An average of
Figure 8. Comparison of between component, UK and USA
-0.50 -0.40 -0.30 -0.20 -0.10 0.00 0.10
1981 1983 1985 1987 1989 1991 1993 1995 1997 1999
Year
% of GDP
UK USA
Sources: OECD, ANBERD database, 1999 and 2002; OECD, STAN database, 1999 and 2003; authors’ calculations.
Conclusion: The UK’s poor business R&D performance relative to the USA was due to weak within-sector growth in R&D intensity rather than to a shift in output towards low-R&D-intensity sectors. The relative decline in within-sector R&D intensity was particularly extreme during the mid-1990s.
Manufacturing or non-manufacturing?
These data clearly suggest that the UK’s poor relative business R&D performance is due to a relative decline in BERD intensity within the two sectors, and not to a faster shift away from manufacturing and towards non-manufacturing. The question remains as to which of the sectors is primarily responsible for this within-sector decline.
Authority only affects the first period. Numbers in bold signify that they are affected by the transfer of the AEA. The second period ends in 1991 rather than 1990 due to a large rise in US non-manufacturing BERD intensity over 1987–91. The 1990s are divided into the 1991–93 period, when there was little change in BERD intensities, the 1993–97 period, when BERD intensity in the UK declined relative to those in the other G5 countries, and a final 1997–2000 period.
Table 4. Contribution of manufacturing and non-manufacturing to the cumulative within component: the UK compared with the USA
1981–86 1986–91 1991–93 1993–97 1997–2000
Total within –0.38% –0.10% 0.15% –0.35% –0.05%
Of which:
Manufacturing –0.53% 0.26% 0.08% –0.34% 0.29%
Non-manufacturing 0.15% –0.36% 0.06% –0.01% –0.34%
Notes: Numbers in bold are affected by the transfer of the UK Atomic Energy Authority to the business enterprise sector. Totals may not sum exactly due to rounding.
Sources: OECD, ANBERD database, 1999 and 2002; OECD, STAN database, 1999 and 2003; authors’ calculations.
From the table, it is clear that the impact of the within component varies over time and between manufacturing and non-manufacturing. Manufacturing is mainly responsible for the relative decline in the within component during the 1981–86 and 1993–97 periods. In both cases, the within manufacturing component partially recovered relative to the USA in the subsequent period. The non-manufacturing component is generally close to zero apart from during the 1986–91 and 1997–2000 periods, when it is significantly negative.11 The reason for this is clear from Figure 9, which shows BERD intensity in non-manufacturing for the G5 countries. During the 1986–91 and 1997–2000 periods, the USA experienced large rises in non-manufacturing BERD intensity that were not observed in the other G5 countries.12 As a result, the USA had a level of non-manufacturing BERD intensity in 2000 that was three times the average for the other G5 countries.
11 The value for 1981–86 is affected by the transfer of the Atomic Energy Authority.
Figure 9. BERD intensity in non-manufacturing: G5 countries
0.0 0.2 0.4 0.6 0.8
1981 1984 1987 1990 1993 1996 1999
Year
% of value added
UK USA France Germany Japan
Notes: Data for Germany cover West Germany until 1990 and unified Germany from 1991. The UK Atomic Energy Authority was transferred to the business enterprise sector between 1985 and 1986. Sources: OECD, ANBERD database, 2002; OECD, STAN database, 2003.
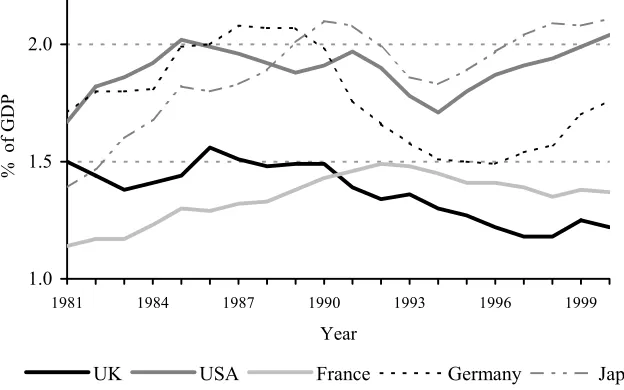
Figure 10. BERD intensity in manufacturing: G5 countries
4.0 6.0 8.0 10.0
1981 1984 1987 1990 1993 1996 1999
Year
% of value added
UK USA France Germany Japan
Figure 10 shows BERD intensity in manufacturing for the G5 countries. The UK and the USA are the only countries that do not show a clear upward trend over the whole period, although France declines after 1993. BERD intensity in UK manufacturing declined throughout most of the period and especially during 1993–97, only recovering from 1997 to 2000. The USA rose little over the whole period but experienced two periods of increase, 1981–85 and 1994–97.
Conclusion: The UK’s within-sector decline in R&D intensity relative to the USA was in both the manufacturing and non-manufacturing sectors. During the mid-1990s, it was largely concentrated in the manufacturing sector. However, towards the end of the 1990s, the USA experienced a large increase in non-manufacturing R&D intensity that was not seen in any of the other G5 countries.
Manufacturing R&D: what happened?
We now investigate how much of the within-manufacturing decline is due to a reduction in R&D intensities within individual manufacturing industries, as opposed to a reorganisation of activity between manufacturing industries towards less-R&D-intensive industries.13
We carry out a within/between decomposition for 16 manufacturing industries over the period 1981–2000.14 Figure 11 shows the cumulative total and within and between changes in R&D intensity for the 16 manufacturing industries. It is clear that movements within individual manufacturing sectors explain most of the total variation, and that shifts between sectors made a fairly steady positive contribution. This suggests a gradual shift in manufacturing output towards those industries with higher R&D intensity. There is some indication that within-sector changes in R&D intensity are counter-cyclical. In particular, the steep declines in R&D intensity from
13 Data limitations have so far limited our ability to do the same for non-manufacturing.
14 We use two-digit ISIC Revision 2 for 1981–91 and Revision 3 for 1991–2000, and splice them
1984 to 1988 and between 1993 and 1997 are almost entirely due to developments within the 16 industries.
Figure 11. UK within and between broad manufacturing sectors
-0.30 -0.20 -0.10 0.00 0.10 0.20
1981 1983 1985 1987 1989 1991 1993 1995 1997 1999
Year
% of GDP
Total Within Between
Sources: OECD, ANBERD database, 1999 and 2002; OECD, STAN database, 1999 and 2003; authors’ calculations.
Figure 12. USA within and between broad manufacturing sectors
-0.20 -0.10 0.00 0.10 0.20 0.30 0.40
1981 1983 1985 1987 1989 1991 1993 1995 1997 1999
Year
% of GDP
Total Within Between
Sources: OECD, ANBERD database, 1999 and 2002; OECD, STAN database, 1999 and 2003; authors’ calculations.
Figure 13. France within and between broad manufacturing sectors
-0.10 0.00 0.10 0.20 0.30 0.40
1981 1983 1985 1987 1989 1991 1993 1995 1997 1999
Year
% of GDP
Total Within Between
Table 5. Contribution of individual industries to the within-manufacturing-industries change in BERD intensity, 1981–91
1981–86 1986–91
UK USA Difference UK USA Difference
Total within-manufacturing change (% of GDP) –0.20 0.07 –0.27 0.03 –0.16 0.19 Of which:
3100: Food, drink and tobacco –0.001 0.011 –0.012 0.005 –0.008 0.013 3200: Textiles, apparel and leather 0.000 0.003 –0.003 0.000 0.000 0.000 3300: Wood products and furniture 0.000 –0.002 0.002 0.000 0.000 0.000 3400: Paper, paper products and printing 0.000 –0.007 0.007 0.000 0.009 –0.009 3500 – 3522: Chemicals excluding drugs and medicines 0.011 0.014 –0.003 0.058 0.000 0.058 3522: Drugs and medicines –0.004 0.005 –0.009 0.049 0.005 0.044 3600: Non-metallic mineral products –0.002 0.006 –0.008 0.000 –0.007 0.007 3700: Basic metal industries –0.004 0.006 –0.010 0.000 –0.004 0.004 3810: Metal products –0.001 0.003 –0.004 –0.003 0.000 –0.003 3820: Non-electrical machinery –0.028 0.000 –0.028 0.042 0.010 0.032 3832: Radio, television and communication equipment –0.191 0.030 –0.221 –0.071 –0.141 0.070 3843: Motor vehicles 0.044 0.038 0.006 0.031 0.079 –0.048 3845: Aircraft –0.099 –0.091 –0.008 –0.065 –0.164 0.099 3850: Professional goods –0.014 0.012 –0.026 0.000 0.025 –0.025 3800 excl. above: Other fabricated metal products 0.094 0.049 0.045 –0.018 0.028 –0.046 3900: Other manufacturing –0.006 –0.004 –0.002 0.000 0.002 –0.002 Note: Totals may not sum exactly due to rounding.
Table 6. Contribution of individual industries to the within-manufacturing-industries change in BERD intensity, 1991–2000
1991–93 1993–97 1997–2000
UK USA Difference UK USA Difference UK USA Difference
Total within-manufacturing change (% of GDP) 0.03 –0.08 0.11 –0.14 0.16 –0.30 0.13 –0.15 0.28 Of which:
Tables 5 and 6 present the contribution of each of the 16 industries to the within component for the UK and the USA, as well as the difference between the UK and the US components. Data for the 1980s and 1990s are reported under different industry definitions, but we have attempted to make the two decades as comparable as possible. Table 5 presents the results for 1981–91, while Table 6 presents 1991–2000. Several general points emerge from the tables. First, large differences between the UK and the USA are highly concentrated in a few key industries, as indicated by the numbers in bold. The largest changes are in pharmaceuticals and several industries related to machinery, equipment and transportation. This is not entirely surprising, given that these industries tend to do the most R&D. Secondly, the contributions of individual industries to the total within component are extremely variable across both industries and time periods.
Some specific observations are also worth commenting on. First, Drugs and medicines / Pharmaceuticals makes a large positive contribution in the UK over the whole period, contributing nearly 0.2 percentage points of GDP to the total within component. In the USA, the same industry makes a negative overall contribution.
Secondly, the UK’s poor performance relative to the USA during the mid-1990s is almost entirely due to five industries in the machinery and equipment sector (industry codes 29 to 33). In particular, Office, accounting and computing machinery on its own accounts for more than a quarter of the UK’s relative decline over 1993–97. Interestingly, this is largely reversed over 1997–2000, when the USA shows a large negative contribution in this industry.
Conclusions
In this Briefing Note, we have documented the trends in UK R&D over the period 1981–2000. We have shown that the UK’s R&D performance over this period was poor relative to the USA and other G5 countries. Over the 1980s, a reduction in government-funded R&D accounts for three-quarters of the UK’s poor R&D performance relative to the USA. Two-thirds of this reduction is associated with cuts in defence spending. Over the 1990s, R&D funded and conducted by business accounts for all of the UK’s poor relative performance. The UK’s poor relative business R&D performance was due to weak growth in R&D intensity within sectors rather than a shift in output towards low-R&D-intensity sectors. The UK’s weakness during the mid-1990s was largely concentrated in the manufacturing sector, in particular in machinery and equipment. However, towards the end of the 1990s, the USA experienced a large increase in R&D intensity in the non-manufacturing sector that was not seen in any of the other G5 countries.
Annex
Denote the change in BERD intensity in the economy between any two periods, t and
t–1, as
1 − − = ∆
∑
∑
∑
∑
t i i t i i t VA RD VA RD r ,where r is BERD intensity, RD is BERD spending, VA is value added and i indexes sectors of the economy (i = 1,…,N). A decomposition of this change is a straightforward accounting exercise which makes use of the following identity:
t t
t within between
r =∆ +∆
∆
=
∑
∆ +∑
∆i it i i i it
s r s
r ,
where si is each sector’s share of total value added:
∑
= i i i i VA VA sfor i = 1,…,N sectors. A bar denotes a time mean, so that
(
1)
2 1
−
+ = it it
i r r
r
and
(
1)
2 1
−
+ = it it
i s s
s .
∑
= ∆ = ∆ k t t k r r cumulative 1 ,which is decomposed into cumulative within and between components
∑
= ∆ = ∆ k t t k within within cumulative 1∑
= ∆ = ∆ k t t k between between cumulative 1such that these sum in every period to the cumulative total change in BERD intensity in that period:
t t
t cumulative within cumulative between
r
cumulative∆ = ∆ + ∆ .