Application of Performance Improvement by using
Performance improvent techniques
Mr.P.V.Dhopte
P1
P
,
P
P
Dr. P.V.Washimkar
P2
P
, Dr. Smita A. Petkar
P3
1.
Mech.Engg.Dept. Nuva college of Engg. and Tech.,Nagpur,India
2.Gurunanak institute of Engg.& mgt.,Nagpur,India
3.Government polytechnic,Nagpur
ABSTRACT:
In the present scenario of the globalization, where every company wants to be a world class manufacturer or to improve its organizational performance, it is quite essential to adopt proper improvement techniques which suits it .Every organization needs to be more productive and efficient in order to survive in the market. In the era of the globalization, the requirements of manufacturing or services firms are needs innovative approaches and ideas, replacing the conventional ones, need to improve quality, reducing cost, proper utilization of the resources, and increase in productivity, reduction in all types of waste etc.Depending on the various factors, how to choose the best for an Organization? What methodology or system fits the particular type of organization? Many process improvement methodologies appear to conflict with each other or at least one down play the contribution of other methodologies. As Title indicates, an attempt is made to implement some methodologies in various sections. The case study has been conducted in one of the reputed manufacturing company of india. Due to variety of products, a huge scope of improvement can be made in present system. Efforts have been taken in this direction, for the selection of project. The main objective of this project is to improve production capacity, to minimize inventory, cost, space utilization, Labour cost and rejection and defects by implementing performance improvement techniques like single piece flow, line balancing, etc.
Keywords: Performance, methodologies, productivity, single piece flow.
1. Introduction
Since the early 1990s,globalization has driven business towards more rapid change as competition became ‘border-less’[1].In an attempt to manage this change, organizations have pursued formalized change programmers. The most popular initiatives employed by manufacturing organizations as organizational performance improvement techniques [2].
Now day’s shorter products life cycle and increased demand for customization make it difficult to produce some products or traditional production lines. Often the best that can be done is to produce them in batch flow system that has been improved through the incorporation of line flow principals. This is one piece flow manufacturing. Traditional cells with irregular material flows are replaced by U-shape production lines within which flow is regular and paced by a cycle time and between which flow is controlled by pull signals[3].This piece of research work addresses the selected number of the quality improvement programs. Amongst the montage of tools and philosophies it is essential to find the nectar of methodologies, their comparison or similarities with other powerful once. The section II of research paper highlights literature review of research on various methodologies. Section III tries to explain the some of the drawbacks of current system. Section IV mainly focuses on the methodologies such as single piece flow with their
analysis. Section V gives the comparative study of analysis, whereas the section VI and VII gives the result discussion and conclusion.
2. Literature
Single piece flow can be described as an ideal state of efficient operations, where batch sizes and lot production are replaced by working on one product at a time [3]. While not practical for operations which very low processing times and correspondingly high change-over times (both values defined by taken time), it is nevertheless a Lean Manufacturing goal to achieve single piece flow in every operation possible. Achieving one-piece flow requires the elimination of waste. We remind the reader of the seven wastes [4, 5]:
Types of waste Causes
Overproduction Producing more product than needed
Inventory Any supply in excess to produce product
Labor Excess man power for single operation
Motion Movement of people or machine which does not add value. Transportation Any material movement that does
not directly support value added operation.
Defects Making defective parts.
Extra processing Any process that does not add value to product.
As a company reduces these wastes and strives for single piece flow, many other benefits follow. Some of these benefits include (i) improved quality and fewer defects (ii) reduced inventory (iii) less space required, (iv)enhancement of overall manufacturing flexibility, (v) makes the identification of future kaizens simpler, (vi) ensures a safer work environment, (vii) improves employee morale. We will review each of these benefits in more detail:
(i)Improved quality and fewer defects: When batches and production is eliminated, there is less opportunity to manufacture defects. Since the batch size will essentially be one, there will not be mountains of inventory to count, move, store and eventually pick.Furthermore, single piece flow ensures that if there is a quality problem with a particular part, we are sure that the defect has affected just one part. We do not need to dedicate
hours isolating and testing the parts in the production run to determine if they meet quality standards. Of course, if a defect is caught in a single piece flow environment, this should not mean that we do not take the appropriate corrective actions to ensure that the problem is not ongoing as it may reoccur. At a high level, these steps include determining if standard work was followed and if so, what changes need to be made to the standard work document to ensure that the problem will never resurface again. Kaizen!
(ii) Reduced Inventory: Implementing single piece flow will require each operation to only produce what is needed by the next operation (the surgeon). When followed properly, the process will eliminate any opportunity to build ahead. Consequently, inventories will not be allowed to build up.
(iii) Requires less space: As inventory levels are reduced (see above), less space and manpower will be required to manage (receive, count, stock, store, pick and deliver) them. In addition, single piece flow usually requires creating manufacturing cells that squeeze machines as close together as possible so that a single operator can oversee many machines with the least amount of walking motion [3].
(iv) Enhances overall manufacturing flexibility: We know from our value steam maps that the less inventory in a value steam, the shorter the lead-time will be from customer order to product delivery. In a single piece flow environment, since we operate with less inventory, lead-times will also drop which will give us more time to react to customer orders (unless we pass off the lead-time gains to the customer). (v) Makes identifying future kaizens simpler: We have already discussed that in a single piece flow environment, defects and WIP inventories fall. As a result of this reduction, it will become easier to see production problems. After all, if a particular process can not keep up, if defective inventories build up next to a particular machine or if overall customer demand can not be met, this becomes obvious almost the minute it happens. These problems will dictate where to focus the next improvement activity.
Excel Control linkage Pvt. Ltd. was established in 1994 as an authorized assembler of cables and control levers under license from Tuthill Controls Group. Mechanical cables are a mechanical means of transmitting effort from one position to another by linear movement. They can be employed as a simple mechanical linkage or
in conjunction with a
control head or a lever control to make a
complete remote control system.Some of the clients of this company is Bharat Earth Movers Ltd. (BEML), Eicher Motors Ltd., Escorts Construction Equipment
Ltd., Hindustan Motors Ltd ,L & T Case Equipment Ltd. , Mahindra & Mahindra Ltd. Etc.
2.
Some drawbacks in current system
In the past 50 years, people have struggled to develop approaches to good management practices that would help companies become more profitable. Unfortunately, over the years a number of factors generally caused every one of these initiatives to fail. The various factor identified as possible reasons for the failure of the approaches to meet the expectations are cultural readiness, knowledge sharing capability and relationship balancing, learning capacity, performance management [6] and ineffective priorization of the system. Here are some of the lacunas where current system launches complaints such as lack of consideration for human factors, lack of strategic perspective, relative inability to cope with variability, improper material handling, lack of planning, excessive labor for repetitive work etc. [8].The various methodologies used to recover these problems are Single piece flow, Just in time, Kanban, SMED, Kaizen etc. Amongs all methodology we are focusing on the single piece flow techniques to sort out the above problems.
4. Analysis of current approaches
The overall effects of the production system clearly improves production performance but the improvements is limited to certain areas.Table no.1-A provides a breaf information about the production capacity of the present system which is improved by implementing single piece flow technique and the improved results are noted in the Table no.A1.The comparision of cost associates before and after implementation is discussed in point B.The Table no.2-C and no.2-C1shows the reduction in inventory lies in shop floor.Table no.3 D and D1 shows the difference between the number of labors required for the operations.
TABLE 1: A) PRODUCTION CAPACITY
Current status revels that company produces 250 no. of cable in one shift. And our goal is to produce 320-330 cables/shift. To achive this we design cell in such a way that it can save time by 20-30 sec for making one cable .by making single line flow of cable to reduce flow of cable from 4 station to 1 station.( This can save approximately 28 sec per cable , which means approximately adding 80 cable in a shift)
Initially = 8hrx 60min x60sec= 28800 sec/250 cable= 115 sec for one cable
Plan = 8 x60x60= 28800sec/330cable = 87 sec for one cable
Saving in one cable is 28 sec.
Because of single line flow it is very easy to decide production target which is very difficult in batch production.As well as installing automatic outer and inner cutting machine, which require one manpower instead of two. This will save cost of one manpower in a day.Cost implication of automatic outer cutting machine is Rs. 600000
Cost of automatic outer cutting machine can be covered in 6 month. ( Rs 60000/( 200( cost of one manpower) x 26 days)= 11.5 which is approximate 12month
Following improved results obtained after implementation of Single piece flow.
TABLE 2 A1) PRODUCTION CAPACITY- (AFTER IMPLEMENTATION OF SPF)
4.1 COST ASSOCIATE (250 CABLE/DAY)
a) Man power cost 10 man/shift=200*10 Rs.2000/shift
b) Machine cost 50,0000/(2year*12month*26days) Rs. 802/shift
c) Overhead cost = Rs.1538/ Shift ( standard company cost)
d) Running cost of automatic outer cutting machine - 100.
Total Cost = (A + B + C)/250 (production per day) =17.36
Present cable cost is Rs U18.U This includes man power
cost, machine cost and overhead cost. We targeted benchmark of Rs 15 for one cable by installing automatic outer and inner cutting machine, which require only one manpower. This will save cost of one
Month Sep. Oct. Nov. Dec. Jan.
Monthly customer order. 8000 8500 8000 8400 8500 Monthly production 6500 6600 6500 6700 6600
Qty. Balance to produce. 1500 1900 1500 1700 1900
Per day production (NO/ DAY)
250 254 250 258 254
Month March April May June July
Monthly customer order. 8400 8300 8600 8400 8500
Monthly production 8300 8400 8300 8300 8300 Qty. Balance to produce. 100 100 300 100 100 Per day production
(NO/ DAY)
320 324 320 320 324
manpower in a day.So,Automatic machine cost per shift is = 60000/(2x12x26)= Rs 100 / shift Now machine cost will increase by Rs. 100 new machine cost is Rs. 902. Running, maintenance and electricity cost of automatic
outer cutting machine is Rs.
150
Tota lCos t=(A +B+ C+D )/330 (pro ducti on per day)
=(1800+902+1538+ 150)/ 320 =13.71 which is
approximately Rs. 14.
New production cost per cable is Rs which is lower than initial cost per cable Rs 18
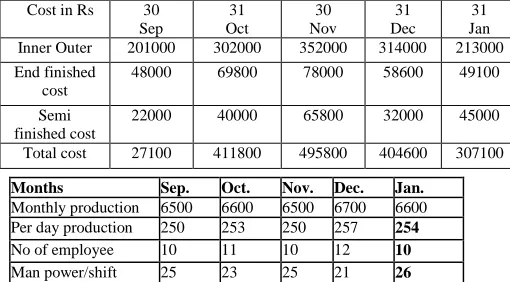
TTABLE 3: C) INVENTORY LIES IN SHOP FLOOR
Cost in Rs 30 Sep
31 Oct
30 Nov
31 Dec
31 Jan Inner Outer 201000 302000 352000 314000 213000 End finished
cost
48000 69800 78000 58600 49100
Semi finished cost
22000 40000 65800 32000 45000
Total cost 27100 411800 495800 404600 307100
Current inventory cost is between Rs. 2.7 lakhs to Rs. 5 lakhs. This is 1.5- 3% of total turnover. (Turnover is
20 crore. (1.7 crore/ month) Out of 1.7 crore the raw material cost for one month is appox. 30% of sale value. The raw material value is Rs 5100000.So,Par day raw material consumption is = 5100000/26=Rs 196000. We targeted that cost on shop floor inventory should not more than one day production capacity, by proper planning and insuring all parts of BOM should be ready before issue of job card for production. This will help to reduce inventory in shop floor. And not
executing next production order until first order finished and packed.
TABLE 4 C1) INVENTORY LIES IN SHOP FLOOR (AFTER IMPLEMENTATION OF SPF)
Because of increase in production rate of cable from 250 to 320 in a day. A sale is also increase from 1.7 crore to 2.2 crore.This increasee in sale which was not able to achieve in old production process.
(One cable cost is approx. Rs2600). Now production is increase from 250 to 320 numbers. Per day production is = 2600 x 320= Rs 832000. This is total cost of cable, but raw material required is near about 30 percent as specified initially, therefore inventory for one day is approximately Rs. 250000. After doing modification in process, we were near to result for inventory is Rs. 250000 and last achieved result is Rs. 257000. Result is more satisfactory.
TABLE 5: D) LABOR UTILIZATION
Current Cable production/manpower/shift average is 24 cables in one shift by one manpower. But monthly cable requirement is about 8500 no per month. For this we require32 Cables productions in one shift by one manpower.
TABLE 6 D1) LABOR UTILIZATION(AFTER IMPLEMENTATION OF SPF)
Production rate is increase from 250- 320 cables in a day by designing a cell in such a way that it saved time by 20-30 sec for making one cable .reduced movement of cable from 4station to 1 station.
Cost in Rs. 30Mar. 31Apr. 30May June July Inner Outer 223000 204000 205000 203000 21800 End finished cost 54800 46800 37800 36600 48600 Semi-finished cost 8000 12800 14200 13600 7000 Total cost 285800 263600 257000 253200 273600
Months March April. May
Monthly production 8300 8400 8300
Per day production 320 324 320
No of employee 9 10 9
Man power/shift 35 32 35
Months Sep. Oct. Nov. Dec. Jan. Monthly production 6500 6600 6500 6700 6600 Per day production 250 253 250 257 254 No of employee 10 11 10 12 10 Man power/shift 25 23 25 21 26
0 2000 4000 6000 8000 10000
Sep. Oct. Nov.Dec. Jan.
Before
5.COMPARITIVE STUDY:
The graphical representation shows that before implementing single piece flow, it was not possible to satisfy the monthly customer order as per requirement, hence single piece flow helps to improve the
production capacity of the present system.
6. CONCLUSION:
Productivity improvement 1.Inventory reduction 2Labor utilization3.Effective space utilization 4.Cost saving
In this paper we have tried to implement single piece flow
REFERENCES:
1.L.J. Chang and Powell, “Towards a framework for buainess process reengineeringin small and medium sized enterprise”, Information system journal,
Graph No.1: Production capacity
-2000 0 2000 4000 6000 8000 10000
march may july
After
Monthly customer order. Monthly production
Qty. Balance to produce. Graph No.2: Inventory
0 100000 200000 300000
30-Mar May31- 31-Jul After
End finished cost Semi finished cost Total cost
0 100000 200000 300000 400000 500000
30-Sep 31-Oct 30-Nov 31DEC. 31-Jan Before
Graph No.3: Labor Utilization
0 50 100 150 200 250 300 350
MarchApril. May june july After
Per day production No of employee Man power/shift
0
100
200
300
Sep. Oct. Nov. Dec. Jan.
Before
Vol.8,1998, pp.199-215
2.A.P.Kedar, M.V. Wakhare, R.R. Lakhe, V.S. Deshpande, P.V. Washimkar, “a comparative review of TQM,TPM and related performance improvement programs”,International conference on emerging trendsin engineering and technology 2008, Nagpur, India.,pp 725-730.
3.J. Miltenburg, “One-piece flow manufacturing on U-shaped production lines: a tutorial”,IIE Transaction journal,Volume33,2001,pp.303-321.
4.Y. Monden, Toyota production system- an integrated approach to just-in-time (Engineering and management press, Georgia), 1993, pp.80-102.
5.J.D.Womack , R. Daniel, The machine that change the world (Macmillan publishing company, Canada), 1990, pp.22-30.
6.Anne Webster ,”Continuous improvement improved”, Work study, Vol.48 Issue4,1999,pp.142-146.
7.Anna Baines, “productivity improvement”, Work study, Vol.48 Issue2,1997,pp.49-52