Clinical Epidemiology 2019:11 127–132
Clinical Epidemiology
Dove
press
submit your manuscript | www.dovepress.com 127
M E t h o d o l o g y
open access to scientific and medical research
Open Access Full Text Article
Random error units, extension of a novel method
to express random error in epidemiological
studies
Imre Janszky1
Johan håkon Bjørngaard1
Pål Romundstad1
lars Vatten1
Nicola orsini2
1deparment of Public health, Faculty
of Medicine and health, Norwegian University of Science and technology, trondheim, Norway; 2department of
Public health Sciences, Karolinska Insitutet, Stockholm, Sweden
Abstract: Currently used methods to express random error are often misinterpreted and con-sequently misused by biomedical researchers. Previously we proposed a simple approach to quantify the amount of random error in epidemiological studies using OR for binary exposures. Expressing random error with the number of random error units (REU) does not require solid background in statistics for a proper interpretation and cannot be misused for making oversim-plistic interpretations relying on statistical significance. We now expand the use of REU to the most common measures of associations in epidemiology and to continuous variables, and we have developed a Stata program, which greatly facilitates the calculation of REU.
Keywords: statistical significance, confidence intervals, P Value, random error, random error units
Several authors have highlighted that the concept of statistical null hypothesis testing is misleading and sometimes directly harmful for research.1,2 Great efforts have been
made to inform researchers about misconceptions related to the use of P-values; for example, that the P-value is the probability that the result can be explained by chance or that the P-value is a direct measure of uncertainty.3–5 Nevertheless, statistical null
hypothesis testing continues to be a primary approach in many scientific disciplines, and serious misconceptions about P-values seem to prevail.
CIs allow us to evaluate the strength of an association and its precision separately. Therefore, CIs were promoted to replace P-values and to force users to turn away from null hypothesis testing. The use of CIs has certainly increased over time6,7 but it should
be recognized that CIs are not immune to misinterpretations and are also widely mis-used.4,7 For example, the typical practice of checking whether the value corresponding
to the null hypothesis is within the CI is just as wrong as using a P-value for statistical null hypothesis testing.6,7 There are numerous examples that illustrate how such misuse
of CIs could lead to potentially damaging effects on clinical practice.8
To quote Greenland et al: “A key problem [with P-value and confidence interval] is that there are no interpretations of these concepts that are simple, intuitive, correct and foolproof ”.4 Unfortunately, alternative solutions, such as Bayesian methodology,
P-value function, likelihood intervals, or the likelihood function, are just as complex as P-values or CIs. Although a deeper insight in statistics is desirable, it may be unre-alistic to expect that most clinicians or other health care professionals will achieve the necessary understanding of these concepts. The continued dominance of statistical null hypothesis testing has recently triggered a drastic solution by one journal. The
Basic and Applied Social Psychology has banned not only the reference to statistical
Correspondence: Imre Janszky department of Public health, Faculty of Medicine and health, Norwegian University of Science and technology, håkon Jarls gate 11, No-7489 trondheim, Norway
tel +47 7359 7575 Fax +47 7359 7577 Email [email protected]
Journal name: Clinical Epidemiology Article Designation: Methodology Year: 2019
Volume: 11
Running head verso: Janszky et al Running head recto: Janszky et al
DOI: http://dx.doi.org/10.2147/CLEP.S184231
Clinical Epidemiology downloaded from https://www.dovepress.com/ by 118.70.13.36 on 20-Aug-2020
For personal use only.
This article was published in the following Dove Medical Press journal:
Dovepress
Janszky et al
significance and P-value, but – given their widespread misuse – also banned the use of CIs.9
However, we think that random error or uncertainty may be expressed in a way that does not require a strong background in statistics. Also, we suggest an approach that cannot be used or misused for statistical null hypothesis test-ing. In a previous paper, exemplified by ORs, we introduced the concept of random error units (REU) as a helping aid on random error. REU have an easy interpretation and can help avoiding hypothesis testing.10 In the present paper, we extend
the concept of REU to other measures of associations than the OR and to continuous variables. In addition, we present a postestimation command in Stata that provides an easy method to calculate REU for various regression models.
The number of REU in a given study shows how many times more individuals are needed in an actual study to achieve the precision of a hypothetical gold standard study. Our proposed gold standard study using the OR as the mea-sure of effect is a case–control study where the aim is to assess the effect of a binary exposure on the risk of a certain disease. This hypothetical gold standard has 500,000 cases and 500,000 controls where half the controls and half the cases are defined as exposed.
To the reader, REU might provide some kind of anchoring reference to how much random error there is in a given study. Just consider the meter – which is a standard measure of distance that was arbitrarily constructed as one ten-millionth of the distance from the equator to the North Pole. We have previously exemplified how the use of REU may achieve a better appreciation of the amount of random error that may be present in a study and how common pitfalls of handling random error can be avoided.
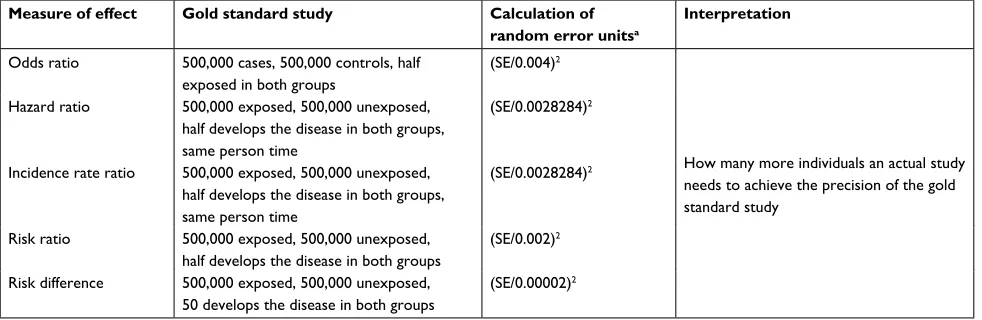
The idea of REU can easily be extended to other measures of associations than the OR. In Table 1, we show our choice of gold standard study and how REU can be calculated for various measures of effect, including the OR, the incidence rate ratio, the HR, and the risk ratio and risk difference, in settings where the exposure is a binary variable
The choice of gold standard was arbitrary. Any hypo-thetical study could serve its purpose as long as the same one is used as standard reference when comparing random error across real-life studies. We have chosen studies with extremely small amount of random error as hypothetical gold standard studies. The purpose was to ensure that the number of REU in real-life studies would be unlikely to go below one, and in practice decimal values will not be needed either. Otherwise, the interpretation of the number of REU might be awkward as it could imply that a noninteger number of individuals would be needed to achieve the same precision as the standard hypothetical study. We can consider the value of 1 for REU as the “atom” – ie, a “nondividable” unit – of random error.
In Table 2, we use these measures of effect and present the number of REU in several hypothetical studies where the number of participants and the proportions and distributions of the exposure and the outcome differ.
In statistical models, categorical variables with more than two categories are typically entered as binary dummy variables. Thus, calculation of the REU for these dummy variables is the same as for any binary variable. However, a continuous variable needs to be transformed to a binary variable for the calculation of REU. To dichotomize con-tinuous variables, we propose to use a cutoff that minimizes the random error, in other words, a cutoff that produces
Table 1 Random error units for the most frequent measures of effect in epidemiology
Measure of effect Gold standard study Calculation of random error unitsa
Interpretation
odds ratio 500,000 cases, 500,000 controls, half exposed in both groups
(SE/0.004)2
how many more individuals an actual study needs to achieve the precision of the gold standard study
hazard ratio 500,000 exposed, 500,000 unexposed, half develops the disease in both groups, same person time
(SE/0.0028284)2
Incidence rate ratio 500,000 exposed, 500,000 unexposed, half develops the disease in both groups, same person time
(SE/0.0028284)2
Risk ratio 500,000 exposed, 500,000 unexposed, half develops the disease in both groups
(SE/0.002)2
Risk difference 500,000 exposed, 500,000 unexposed, 50 develops the disease in both groups
(SE/0.00002)2
Note: aderivation of the denominators is presented in the Supplementary material.
Abbreviation: SE, standard error in the actual study.
Clinical Epidemiology downloaded from https://www.dovepress.com/ by 118.70.13.36 on 20-Aug-2020
Dovepress Janszky et al
the binary variable with the lowest number of REU. In the Supplementary material, we present a postestimation com-mand in Stata, which automatically detects both the measure of association and the type of variables and then calculates the number of REU. In the case of continuous variables, this command also identifies the cutoff value that minimizes the amount of random error.
In the Supplementary material, we also present the derivation of the method to calculate the number of REU for the different measures of association using the gold standard studies and demonstrate that the interpretation of the number of REU (ie, how many times more individuals an actual study would need to achieve the precision of the gold standard study) is correct.
In summary, we believe that the use of REU provides an explicit quantification of the random error with an easy intuitive interpretation and it might help avoiding some com-mon mistakes concerning random error. However, it does not offer more, and it cannot per se replace existing methods. For example, it can be used as a helping tool together with the point estimate and its CIs. Those who prefer to present data without any tool, which can be misused for statistical null hypothesis testing, can consider the presentation of effect size with an accompanying information on the number of REU. We now expand the use of REU to the most common measures of associations in epidemiology and to continuous variables, and we have developed a Stata program (freely available on the Boston College Archive), which greatly facilitates the calculation of REU.
Acknowledgment
The authors wish to thank Dr Kenneth J. Rothman (Research Triangle Institute and Boston University School of Public Health) for the important discussion and advices that initi-ated this work.
Disclosure
The authors report no conflicts of interest in this work.
References
1. Rothman KJ. Curbing type I and type II errors. Eur J Epidemiol. 2010;25(4):223–224.
2. Stang A, Poole C, Kuss O. The ongoing tyranny of statistical significance testing in biomedical research. Eur J Epidemiol. 2010;25(4):225–230. 3. Goodman S. A dirty dozen: twelve p-value misconceptions. Semin
Hematol. 2008;45(3):135–140.
4. Greenland S, Senn SJ, Rothman KJ, et al. Statistical tests, P values, confidence intervals, and power: a guide to misinterpretations. Eur J Epidemiol. 2016;31(4):337–350.
5. Wasserstein RL, Lazar NA. The ASA’s statement on p-values: context, process and purpose. Am Stat. 2016;70(2):129–133.
Table 2
Number of random error units in some hypothetical studies with dichotomous exposures and outcomes using incidence rate ratios, risk ratios, and risk differences
No. of exposed No. of outcome
Total N
Exposure
Outcome
IRR/HR (95% CI)
No. of REU
RR (95% CI)
No. of REU
RD (95% CI)
No. of REU
Yes No 50 50 100 y es 25 25 1 (0.574–1.741) 10,000 1 (0.676–1.480) 10,000 0 ( −
0.196 to 0.196)
25,000,000 No 25 25 1,000 1,000 1 million y es 1 999 1 (0.141–7.106) 125,128 1 (0.141–7.099) 250,000 0 ( −
0.002 to 0.002)
2,500 No 999 998,001 1,000 1,000 10,000 y es 169 831 1.830 (1.551–2.160) 890 1.830 (1.572–2.131) 1,502
0.077 (0.053 to 0.101)
374,378 No 831 8,169 1,000 1,000 10,000 y es 55 945 0.524 (0.399–0.688) 2,405 0.524 (0.402–0.682) 4,532 –0.050 ( −
0.066 to 0.035)
156,042
No
945
8,055
Abbreviations:
IRR, incidence rate ratio; R
d
, risk difference; REU, random error units; RR, risk ratio.
Clinical Epidemiology downloaded from https://www.dovepress.com/ by 118.70.13.36 on 20-Aug-2020
Dovepress
Janszky et al
6. Stang A, Deckert M, Poole C, Rothman KJ. Statistical inference in abstracts of major medical and epidemiology journals 1975-2014: a systematic review. Eur J Epidemiol. 2017;32(1):21–29.
7. Fidler F, Thomason N, Cumming G, Finch S, Leeman J. Editors can lead researchers to confidence intervals, but can’t make them think: statistical reform lessons from medicine. Psychol Sci. 2004;15(2):119–126.
8. Mccormack J, Vandermeer B, Allan GM. How confidence intervals become confusion intervals. BMC Med Res Methodol. 2013;13:134. 9. Trafimow D, Marks M. Editorial. Basic Appl Soc Psych. 2015;37(1):1–2. 10. Janszky I, Bjørngaard JH, Romundstad P, Vatten L. A novel approach
to quantify random error explicitly in epidemiological studies. Eur J Epidemiol. 2011;26(12):899–902.
Clinical Epidemiology downloaded from https://www.dovepress.com/ by 118.70.13.36 on 20-Aug-2020
Dovepress Janszky et al
Supplementary materials
Part I. Calculation of random error units
for different measures of effect using our
postestimation command in Stata
The reu command is available for download from the Boston College Archive. To install it, type at command line: ssc install reu.
1. OR
. // Example for calculating the number of random error units for an OR
. glm outcome exposure covar_1...covar_n, fam(bin) link(logit)
. reu exposure
//exposure is either binary or continuous; for dummies, each dummy needs be mentioned after the reu command // works equally well with logistic or logit procedures 2. Incidence rate ratio
. // Example for calculating the number of random error units for an incidence rate ratio
. glm outcome exposure covar_1...covar_n, fam(possion) link(log)
. reu exposure
//exposure is either binary or continuous, for dummies each dummy needs be mentioned after the reu command // works equally well with Poisson procedure
3. HR
. // Example for calculating the number of random error units for HR
. stset time, failure(outcome) . stcox exposure covar_1...covar_n
//exposure is either binary or continuous; for dummies, each dummy needs be mentioned after the reu command . reu exposure
4. Risk ratio
. // Example for calculating the number of random error units for risk ratio
. binreg outcome exposure covar_1...covar_n, rr
//exposure is either binary or continuous; for dummies, each dummy needs be mentioned after the reu command . reu exposure
5. Risk difference
. // Example for calculating the number of random error units for risk difference
. binreg outcome exposure covar_1...covar_n, rd //exposure is either binary or continuous; for dummies, each dummy needs be mentioned after the reu command
. reu exposure
// works equally well with linear regression
Part II. derivation of the method to
calculate REU as presented in table 1
1. OR:SE of log OR =√(1/a+1/b+1/c+1/d)
where a, b, c, d refer to those having both the outcome and the exposure, those not having the outcome but being exposed, those having the outcome but not being exposed, and those without the outcome nor exposure, respectively.
Since in the gold standard a=b=c=d=250,000, it follows that SE in the gold standard is 0.004.
2. Incidence rate ratio/HR
SE of log incidence rate ratio=√(1/a+1/b)
where a and b refer to exposed and unexposed cases, respectively.
Since a=b=250,000, it follows that SE in the gold standard is 0.0028284.
3. Risk ratio
SE of log risk ratio=√(1/a+1/b–1/c–1/d)
where a, b, c, d refer to exposed and unexposed cases, total number of exposed, and unexposed individuals, respectively.
Since a=b=250,000 and c=d=500,000, it follows that SE in the gold standard is 0.002.
4. Risk difference
SE of risk difference=√(a(c–a)/c3+b(d–a)/d3)
where a, b, c, d refer to exposed and unexposed cases, total number of exposed, and unexposed individuals, respectively.
Since a=b=50 and c=d=500,000, it follows that SE in the gold standard is 0.00002.
Part III. demonstration of the
interpretation of the REU
The number of random error units shows how many times more individuals an actual study would need to achieve the precision of the gold standard study. First we start the demon-stration of this interpretation with an example for the OR. We consider a study on 100 individuals, half of them exposed to a dichotomous exposure that has no effect on the – likewise dichotomous – outcome, which is also present in half of the individuals. The standard error of the log OR in this study is 0.4, and consequently the number of random error units is 10,000. If we multiply this study with 10,000 (keeping the proportion of exposed and those with an outcome constant), we are getting exactly the proposed gold standard study (ie, a study on one million individuals, half of them exposed to
Clinical Epidemiology downloaded from https://www.dovepress.com/ by 118.70.13.36 on 20-Aug-2020
Dovepress
Clinical Epidemiology
Publish your work in this journal
Submit your manuscript here: https://www.dovepress.com/clinical-epidemiology-journal
Clinical Epidemiology is an international, peer-reviewed, open access, online journal focusing on disease and drug epidemiology, identifica-tion of risk factors and screening procedures to develop optimal pre-ventative initiatives and programs. Specific topics include: diagnosis, prognosis, treatment, screening, prevention, risk factor modification,
systematic reviews, risk and safety of medical interventions, epidemiol-ogy and biostatistical methods, and evaluation of guidelines, translational medicine, health policies and economic evaluations. The manuscript management system is completely online and includes a very quick and fair peer-review system, which is all easy to use.
Dove
press
Janszky et al
a dichotomous exposure that has no effect on the outcome, which is also present in half of the individuals). More gener-ally, decreasing the standard error of a study by a factor of n requires n2 times as many observations (providing that the
distribution of the exposure and outcome is constant).
SE/n=1/n√(1/a+1/b+1/c+1/d)= √(1/(n2a)+1/(n2b)+1/
(n2c)+1/(n2d))
The same can be shown for SE for the rest of the measures of associations.
Clinical Epidemiology downloaded from https://www.dovepress.com/ by 118.70.13.36 on 20-Aug-2020