ISSN 2286-4822 www.euacademic.org
Impact Factor: 3.1 (UIF) DRJI Value: 5.9 (B+)
Milestones in the Process of Becoming a Teacher
ÁGNES N. TÓTH
Department of Education University of West Hungary (NYME) Szombathely Hungary
Abstract:
Accepting the statement according to the progress of becoming a teacher is a life-long process (Falus 2004), the survey investigates three milestones, choosing the career, university life and starting the career. Our study is focusing on the research findings on, satisfaction with the training and the career as well as university life.
We have analysed the experiences of graduates with different majors (N= 731) in tertiary education who attended pedagogy courses. For our research we used the GCTS1 (Hungarian Graduate Career
Tracking System) database of the University of West Hungary with the data collected between 2010 and 2011. Our findings are in line with several statements of international studies although we observed other facts as well: the choice of a particular university is mainly influenced by the geographical location and not necessarily by the good reputation of the institution. In addition, graduates are not satisfied with the prestige and the financial rewards of their profession and many of them do not work in the education sector.
Key words: teacher career, candidate teacher, teacher training, teacher as workforce.
1 ‘The central database of GCTS gathers a wide range of information about graduates, including the data collected annually within the institutional surveys, the integrated database of public agencies with regards to graduate students, and databases of the career tracking programme on a countrywide sample.(Educatio,2011)
Background
There are great works of literature in Hungary and abroad on the process of becoming a teacher, in which the notable decline in popularity of the teaching profession is also frequently mentioned. There is a well-known term, the so-called “three ‘I’s,’ to define the stages of becoming a teacher: initial education, induction education, and in-service education (Nagy 2004). In this study, the subject of investigation is restricted to training specialties offered at NYME to elaborate a long-term strategy of our teacher training.
Scheerens et al. define teachers’ professional development path based on the OECD-TALIS (Teaching and Learning International Survey). The report points out that making teaching a more attractive career option is possible if teacher recruitment, placement, retention, and mobility policies are guaranteed, and that the quality of school education is maximized (2010,14).
In Hungary, it was assumed that with introduction of Master’s-level teacher education, “there would be much more prepared and qualified teachers in the future’(Csapó 2007, 16). Unfortunately, this two-tier degree system was changed into one-cycle training (2013) before its long-term impact could have been evaluated.
The Lisbon Strategy and some other EU measures show that the most important milestone of the efficiency of European education is the increase in teachers’ effectiveness. The characteristics of the trainings are heterogeneity and fragmentation, which make the education of highly qualified teachers with proper competences even more difficult (Kárpáti 2008). Regarding these circumstances and the fact that the claim for professional efficiency requires up-to-date professional knowledge (Hanák 2010) of practicing teachers, the importance of in-service trainings must be underlined.
regulated everywhere. The OECD-TALIS study shows that in more than half of the 24 participating countries, it is not obligatory to attend such trainings (Scheerens 2010). In Hungary, teacher trainings are conducted to “refresh, expand and improve the knowledge and skills which are needed for the educational and professional attitude towards educating children directly at school level; those competences which are required for organising the operation of educational institutions; skills to provide professional pedagogical services; skills which are essential for the operation of the examination system, like testing and evaluation processes, as well as the competences to be able to lead and manage public education institutions’ (277/1997.[XII. 22.] Government Edict 4. § [1]).
Participation provides indisputable opportunities for professional development, but we have very little information about the successes and failures of the process from the intention of participation to putting the acquired new information into practice.
“The accreditation of the training can involve quality assurance at the planning level – although we cannot get any information about what is realized from the syllabus. It is certain that those educational training providers take the participants’ comments seriously, and although they are not obliged to do it for external authorities, they train the participants effectively – yet this multi-billion business would need a more central and a much more transparent control’ (Kárpáti 2008, 208).
representative survey (2003) made by OKI (National Educational Institute) in this field (Liskó 2004) showed that the most difficult aspect of teaching is to structure the lessons on the basis of students’ varied needs and help those left behind: a need creating new types of courses concentrating on these subjects. In the Teacher-In-Service Training Accreditation System, 1767 training courses were registered until July 2011. Among these, 935 (52.9%) are organized by an entrepreneurship, 119 (6.7%) are offered by tertiary educational institutions, and 143 (8%) are organized by foundations or private organizations. The other 571 (32.2%) are provided by local or national professional service providers and methodological institutions. At the dawn of the system, ‘about 60% of the training programmes’ were ‘offered by service providers who traditionally deal with teacher training (tertiary educational institutions or pedagogical service providers).’ Today, the market is led by the private sector.
collect data and feedback from the participants and forward it to the Educational Authority by 31st March (Source: Educational Authority Data Base 2011).
Research method and the respondents
Hypotheses
Before starting this research we assumed that despite the difficulties of study our students’ are very satisfied with the academic life and teaching career as well. Knowing that they have to face with a number of complicating factors in the job seeking and their commitment to teaching career is not strong enough we expected a greater rate of unemployment teachers than the national average.
Method
Now, let us see how the graduated students of NYME think about their university years and their chosen career path.
In Hungary, the GCTS system was introduced in 2008 and thousands of university students and graduates have been sharing their experiences and data since then (Horváth at al 2011). We collected information only from those who obtained their first degree at a pedagogy-oriented course from 2007 to 2010 (N=731).
As our claims and conclusions are based on SPSS data filtering of a previous GCTS study, there might be a chance of distortion (e.g. if the respondents marked a pedagogical major as their second major, their answers were not taken into consideration).
important to mention that that survey put lower primary teachers and teachers of special schools into the same category (Chrappán 2010, 267). However, we would like to take the professional specialisms into consideration, which is why we did not follow this method.
Sample
By looking at the gender distribution and professional orientation of the sample, we can observe that only a very small number of the respondents were male (14%) showing that teaching is a profession being chosen mostly by women. The authors have warned us about the challenges resulting from the fact that this profession is dominated by women (Falus 2002; Mihály 2002; Imre & Nagy 2003; Kárpáti 2008).
A further characteristic of the sample is the date of graduation and the type of the finished training. The distribution between the different types of courses shows that one-third of the sample (36%) graduated as full-time students and two-thirds (64%) as part-time students.
The proportion of men and women of the different majors shows significant differences. The vocational school teachers’ course, when compared with the proportion of the whole sample (14%), is more frequently (60%) chosen by men (s=12), whereas the courses for teachers of special schools, kindergarten teachers, teachers of pedagogy, or lower primary school teacher courses are very rarely chosen (1–2%; s=2) by men. The difference (Tszf: 14= 0.52 p<0.05) between the courses (full time or part time) in case of men is not significant, and we can claim that men’s career orientations are more influenced by the contents of the course rather than by other features.
Findings
Who wants to be teacher?
the examined group (N=731) took their final examinations in secondary grammar schools (their education lasting for 6 or 8 years) and 42% in traditional 4-year-long secondary grammar schools or minority grammar schools. Some attended bilingual secondary grammar schools2, left either secondary technical schools, or vocational schools (47%). The proportion of the respondents who took their final examinations at other types of secondary schools is 5%. When the respondents were asked about the latter category, the 2-year-secondary technical courses for workers, evening courses, and grammar schools for workers were mentioned. The numbers show that the school-leavers of the so-called “elite grammar schools’ do not tend to choose the teaching profession and this cannot be by accident, as they might have more opportunities to choose other intellectual professions (e.g. lawyers, doctors, economists). A previous survey carried out by Educatio Ltd. found that 73% of the graduated teachers (N=740) chose this profession because of their commitment. However, one-tenth of the respondents answered that “they wanted to get a degree and were not particularly interested in their field of studies’(Chrappán 2010, 269).
Our analysis highlights that the connection between the graduates at different pedagogy-orientated majors and the types of secondary schools can only be noticed significantly in case of some majors. Using cluster analysis, we could find strong connections between teachers of pedagogy and subject teachers (2
df:3= 8.35; 0.05>p>0.02) and teachers of pedagogy
and social pedagogy (2
df:3= 9.299; 0.02>p>0.01), whereas in
the case of teachers of vocational school, special schools, or kindergarten, we could not see this kind of connection. It could be confirmed that respondents from secondary technical schools are more likely to choose to be teachers of pedagogy, subject teachers, or students of social pedagogy. In contrast, among
respondents who chose the career of vocational school teacher, teacher of special schools, teachers of kindergarten, or lower primary school teachers, the connection between the types of secondary school and the chosen career may appear as a coincidence.
Concerning the choice of institution, the answers from the active university students (N=402) between the period in question from 2010 to 2011 show that their decisions were determined by their fields of interest and their career goals. The actual institution or the reputation of the lecturers were the next important factors, while an opportunity of a career abroad or the advice given by close friends and relatives also influenced their choices.
Satisfaction with the institution
The respondents in the investigated period had to answer 13 questions about university life (infrastructure, learning, culture, public life, human resources). It should be considered that respondents have different experiences due to the fact that some of them graduated as full-time students and others as distance-learning students.
The sample scored 3.5 (sd=11) in the five-scale system regarding the infrastructure, but significant differences could be seen among the opinions of the respondents of each major. Adult educators, teachers of special schools, and teachers of preschool were more satisfied with the conditions of the classrooms than teachers of pedagogy or social pedagogy.
The library was more favored by the subject teachers, teachers of pedagogy, and lower primary school teachers than those of vocational school. The graduates of social pedagogy and the teachers of pedagogy gave more favorable responses (Figure 1) about the accommodation than the lower primary school teachers, teachers of special school, or teachers of vocational school. These opinions are worth considering when planning the
improvements of these premises.
Figure1- Evaluation (N=731) of the different factors of university life (Source: GCTS graduated students 2010; 2011)
Considering the 13 investigated factors, we can state that the institution should improve opportunities concerning scholarships abroad, increase the standard of infrastructure, and develop the qualities of its external relationships because these were the factors that the respondents were most dissatisfied with.
By projecting these indices into the different majors of the respondents, we could observe that students of andragogy, teachers of vocational school, subject teachers, and special school teachers tend to be more critical, whereas teachers of kindergarten, lower primary teachers, and teachers of pedagogy seem to be more satisfied. The lower primary schools teachers’ attitude to each aspect is more positive than that of the students of social pedagogy or the teachers of vocational school. Culture, public life, and opportunities for scholarships abroad were rated 3.1 (sd= 9), while the human factors such as the preparedness of lecturers, the helpfulness of registrars and librarians, and the standard of external practice received a score of 3.7 (sd: 10.2).
To highlight the sub-sample of graduates of social pedagogy compared with the averages of the whole sample
(0.01< P <0.05; Tdf:23=0.751), it can be stated that no significant
respondents was greater than that in other majors.
Satisfaction with the training
A notable aspect of the analysis is the form of delivering the lectures and the ways of evaluating the knowledge of the students. Our graduated students generally preferred printed materials and their own lecture notes during their studies as opposed to electronic materials. Explanation of their attitudes might be traced back to lack of experience and/or their ICT competences. It could only be assumed that influence by the lecturers would result in use of the electronic materials just as often as others. The following data collected per majors could provide further details. We should probably consider the fact that students may not have equally easy access to computers, which is why some do not use or value such resources.
The rejection of electronic materials could be explained by the ratio of the age groups of each of the majors, which could be seen in Figure 2.
Figure 2 The average age of different subgroups (Source: GCTS graduated students 2010; 2011)
For two-thirds (67%) of the trainee teachers, the most favored way of having their knowledge assessed is by individual project work (e.g. assignments), micro-group projects, or tasks performed at training institutions. Half of the respondents preferred the traditional oral and paper-based examinations to modern electronic tests. Before we assume the lack of experience, we must observe whether there is a connection between the preferred examination types and preferred learning materials. Is it true that those respondents who preferred traditional, printed learning materials opt for traditional examination formats? It has been justified statistically that there are more respondents who preferred oral examinations and liked printed materials (r= 0.977). There is also a strong correlation between those respondents who preferred electronic materials and those who liked electronic test papers (r= 0.964). Therefore, we can state that the positive attitude of the respondents could be clearly attributed to the experiences gained during the lectures and seminars, as we could prove the secondary effect of age.
The average of participation in scientific and professional workshops is 7%, which seems to be very low (Figure 3). Most respondents took part in research activities (e.g. development of their final thesis!!) or professional study camps.
It can be observed that the respondents participated less in training abroad (2%), which supports the fact that for students of the investigated majors, the opportunities for scholarships to study abroad should be widened in the future.
We wanted to find out what the graduated students thought about the relationship between the students and the institution and what extra services were provided to them beyond education (e.g. helping talented students, flow of information, organizing cultural programs, dealing with social issues). With regard to helping talented students, the respondents of the sample scored a relatively similar (3.3) level of satisfaction.
To support students with difficult social backgrounds, the university provides various aids (scholarship, financial support for residency, etc.) and/or provides accommodation to their students. However, this kind of support is offered mostly to full-time students; therefore, distance-learning students cannot have any relevant experiences in connection with these. Thus, the data gathered by distance-learning students – although they cannot be left out – should be accepted and treated with restraints. Regarding the attitude of the institution towards social problems, the respondents scored 3.0. Our respondents were not really content about the given information about the work of the faculties. Their average score was 2.3 with respect to the available information, but the teachers of vocational school and teachers of pedagogy shared much more favorable opinions (4.4; 3.3).
Possessing a degree and finding a job
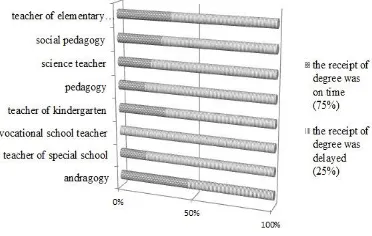
one-third (29%) of the students could not get their degree after graduation. The ratio of men among these people is the same (16%) as in the whole sample. Our analysis showed that, with the exception of one major (vocational school teachers), the number of those respondents of pedagogy-related majors (15– 50%) who did not receive their degree after graduation is significant (Figure 4).
Figure 4 The date of receipt of degree (Source: GCTS graduated students 2011)
The delay in collecting the degree is the highest in the case of adult educators (50%), which is mostly explained by the lack of necessary language certificates as a criterion of graduation (87%)3. It is understandable that among the respondents, the main reason for not being able to find a job could also be the same. However, while those with delayed receipt of degree represent only one-third of the sample, those who could not find
3 Section 51 (1), “Passing the final exam shall constitute a precondition for issuing the diploma attesting the completion of higher education, as well as – if otherwise not stipulated within the scope of the present Act – passing the prescribed language exam. Unless otherwise regulated more rigorously by programme and outcome requirements, the student shall present the certificate attesting the following:
a) Type ’C’ general language exam or general (level B2) general intermediate language exam in Bachelor programmes;
b) Language exam specified in the programme and outcome requirements, acknowledged by the state or an equivalent language exam (hereinafter language exam) in Master programmes.’ (Act CCIV of 2011 On National
Higher Education)
a job for a long time represent only one-tenth of the respondents.
Figure5 The number of workplaces between graduation & data collection
(Source: GCTS graduated students 2010; 2011)
In Figure 5, we can observe that more than half (55%) of the graduates had one workplace, but one-third (34%) had more than two workplaces at the time of data collection, and the number of unemployed people was significant in the sample (9%). Which majors were the least fortunate in the labor market? Is there a connection between the majors of the respondents and the chances of finding a successful position? Can a degree be more marketable?
The rate of majors among the group of unemployed people and the rate of unemployed people within the majors slightly correlate (r= 0,592) with each other; thus, with the help of T-statistics, we wanted to show the significant relationship between them. With the result of this survey (T:0.05, 14 df =
2.145> 0.096), it seems that unemployed people were not
influenced by their inadequacy to find a job by the low regional demand for their professions. If we look at the role of our graduates in the economy, we can observe considerable differences; for example, only half of the sample (43.3%) work in pedagogy-related fields.
professions into the processing industry category, and one-tenth into trade, art, entertainment, or free time. These facts confirm the employability of people with pedagogical degrees and the possible transformation of the acquired knowledge into other spheres of life.
With regard to the job searching techniques of our graduates (Figure 6), we found that three-quarters of them could find their present position with the help of their acquaintances, through job advertisements or directly from the employers. It could be noticed that the respondents said they did not get enough support from the institution.
Figure 6 The techniques for finding a job (Source: GCTS graduated students 2011)
Professional satisfaction
The average satisfaction of the sample is 3.4. The colleagues were mostly satisfied with the professional content (4.1) and human conditions (3.8), yet they were quite dissatisfied with the prestige of their profession (2.9) and income (2.5). The opinions based on the distribution of the majors differed from each other. The teachers of kindergarten and pedagogy were more satisfied with the professional contents of their jobs, while the most dissatisfied were the adult educators. The opportunities of building a professional career among teachers of pedagogy resulted in more satisfaction, whereas students of social pedagogy or adult educators were the most dissatisfied. The opinions of our graduates working in education are more homogeneous ( = 40; sd= 20; V= 51) than of those who work in other professions ( = 217; sd= 98; V= 45). At the same time, the variation of this sample is higher, which contradicts homogeneity.
Figure 7 The rate of the respondents working in education who have a second job
(Source: GCTS graduated students 2010; 2011)
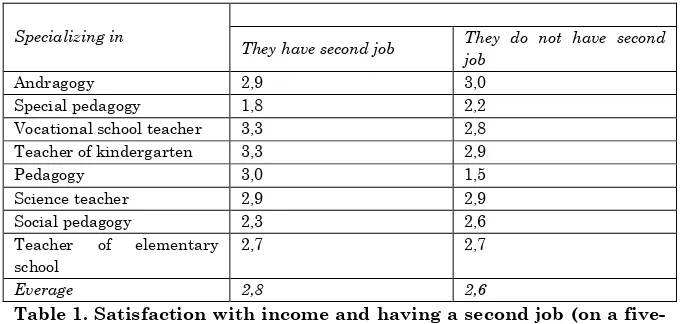
After analyzing the level of satisfaction of the respondents on the basis of their majors, (Table 1), we could observe that those teachers who have a second job are just 0.2% more satisfied than those who do not. Thus, we can state that although there is a tendency to undertake extra activities to supplement their salaries, this might not have a positive effect on their level of satisfaction.
Specializing in
They have second job They do not have second job
Andragogy 2,9 3,0
Special pedagogy 1,8 2,2
Vocational school teacher 3,3 2,8
Teacher of kindergarten 3,3 2,9
Pedagogy 3,0 1,5
Science teacher 2,9 2,9
Social pedagogy 2,3 2,6
Teacher of elementary school
2,7 2,7
Everage 2,8 2,6
Table 1. Satisfaction with income and having a second job (on a five-grade scale)
respondents are more satisfied. Concerning teachers of vocational school and kindergarten teachers, the situation is reversed: Those respondents who have a second job seem to be more satisfied. It is interesting to mention that subject teachers and lower primary school teachers share the same level of satisfaction regardless of their second jobs.
Conclusion and implication
Our findings can be grouped around three important milestones in the process of becoming a teacher such as choice of career, satisfaction with the training and university life, and satisfaction with the career.
With regard to the choice of career among the trainee teachers, the ratio of men is very low (14%), but their career decision is motivated by their affection towards the profession and not by the hope to find a stable position. With respect to the recent European statistics, this quite low rate is not surprising at all. The average proportion of females in teaching in the 27 EU member countries is between 72 and 73%, with 86% at primary level, 69.4% at lower secondary level, and 61.3% at upper secondary level (Eurostat 2011). In Hungary, it can be assumed that by raising the security of livelihood in teacher career, its popularity will raise among men as well. The data from European countries seem to support this assumption. While Hungarian proportion is 80%, the ratio in Western European countries is as follows: Austria, 71%; Belgium, 72%; Germany, 65%; Denmark, 69%; France, 69%; Italy, 75%; Norway, 66%; and the United Kingdom, 69% (Eurostat 2011).
Commission, as the teacher educators’ role is one of the most essential in the process of teacher training, they need to have solid practical teaching experience, good teaching competence, and high academic standards (European Commission 2010).
We found that almost half of the candidate teachers at NYME came from secondary technical schools and some from the evening classes of adult education. This fact led us to conclude, on the one hand, that not the most successful students of secondary education are motivated to be teachers, and, on the other hand, that the decision to study at higher level of education was born in their late secondary students’ life. These circumstances direct our attention partly to willingness of the young population to become teachers and partly to the importance of the quality of teacher educators who have to face several professional challenges during the training period. A nationwide representative study (N= 4954) carried out some years ago justified that to choose university-level teacher training is 10% less likely among those who completed their high-school studies in vocational education. However, no significant difference was noted between learning abilities of students applying for teacher training or other field of science at university level. At the same time, researchers found that it is more likely for those people who are not highly talented to choose a teacher career at college level; furthermore, they noted that even if other variables are fixed, it is less likely for a man to apply for teacher training than a woman (Varga 2007).
In connection with teacher trainers, we agree with ATEE
(Association for Teacher Education in Europe) that declared
that teacher educators carry a heavy responsibility, as the quality of their work affects not only the quality of teacher education and the learning of the student teachers, but also the attractiveness and quality of the teaching profession, and thus, the quality of education that is provided to pupils (ATEE 2006, 8).
During their studies, 75% of the students had to undertake a job and among them, the number of full-time students was significant as nearly half of them (47%) needed a job during university. This indicates that families of our student teachers generally cannot be characterized as well-off ones and probably many among our students are “the first generation in their family achieving university degree.’ Varga (2007) stated that the social status of graduated students in secondary education, such as the parents' education, income status of the family, or the final residence settlement type, has no significant effect on teacher career choice probability either at college or university level (Varga 2007, 615).
We found that our graduated students at NYME preferred printed materials and their own lecture notes for learning than electronic materials. For two-thirds of the students who learn to become teachers, the most favored way of having their knowledge assessed is by individual project work, which usually means an essay on different topics of education or a small research activity. Half of the sample preferred traditional oral and written examinations to more modern electronic test papers. Handal, Wood, and Muchatuta (2011) summarized their similar research findings and noted that “students did not strongly identify knowledge of the subject matter as a requisite for good delivery of a class.’ In addition, eLearning tools ‘were acknowledged by most students as indispensable in tertiary education due to their flexibility as an extended classroom, media versatility and social networking capabilities’ (Handal, Wood & Muchatuta2011, 13).
Letcher and Neves (2010) quoted Hunt’s definition on consumer satisfaction and applied it to educational context. They underlined that student satisfaction refers to the favorability of student’s subjective evaluations of the various outcomes and experiences associated with education. As satisfaction is based on experience, student satisfaction is constantly being influenced by their experiences in the classrooms and on campus. The combination of all experiences affects their overall satisfaction with the institution (2010, 3) Thus, paying more attention to what happens to our students inside or outside the classroom (including social life and accommodation) infrastructural deficiencies might be slightly balanced.
Despite the fact that every third graduate has to wait to obtain their degree because of the lack of a language certificate, they were noted to be usually moderately satisfied with their achievements and most of them identified themselves with their chosen profession. While the formal fact demonstrates a not very strong professional commitment towards teaching, the latter shows the opposite. This contradiction requires further study to find out about the commitment of trainee teachers towards the profession.
that the respondents are generally dissatisfied with the low prestige and the low income of the profession; therefore, nearly one-fifth of them have a second job in the private sector.
BIBLIOGRAPHY:
ATEE (Association for Teacher Education in Europe). 2006. The Quality of Teachers. Recommendations on the development of indicators to identify teacher quality.
http://www.atee1.org/uploads/kennisbank/quality_of_tea chers_atee_def.pdf (05.08.2013)
Chrappán, Magdolna. 2010. “Career Satisfaction & Career Plans.” Pályaelégedettség és karriertervek. In:
Diplomás pályakövetés IV, Educatio TSZN Kft,
Felsőoktatási Osztály, Budapest.
Csapó Benő. 2007. “Role of teachers’ knowledge in the development of Education System.’ A tanári tudás szerepe az oktatási rendszer fejlesztésében. Új
Pedagógiai Szemle, 57(3-4): 11- 23.
Educatio. 2011. Graduate Cereer Tracking in Hungary. http://www.felvi.hu/pub_bin/dload/DPR/DPR_GraduateC arreerTrackingInHungary.pdf (30.05.2013)
Eurostat. 2011. Education statistics (Data from July 2011).
http://epp.eurostat.ec.europa.eu/statistics_explained/ind ex.php/Education_statistics#Women.C2.A0in_the_teachi ng_profession (08.07.2013)
European Commission. 2010. “The Profession of Teacher Educator in Europe.” Report of a Peer Learning Activity in Reykjavik, Iceland 21-24 June 2010.
Falus, Iván. 2002. “The teacher as learner.” A tanuló tanár.
Iskolakultúra 6–7: 76–83.
Falus, Iván. 2004. “The process of becoming a teacher.” A pedagógussá válás folyamata. Educatio 3: 359-374. Hanák, Zsuzsanna. 2010. “The opportunities for the application
the context of a study.” A portfólió tanárképzésben és a közoktatásban történő alkalmazásának lehetőségei egy vizsgálat tükrében. In: Pedagógusképzés, 8(2-3): 101-110.
Handal, Boris- Wood, and Leigh- Muchatuta, Michelle. 2011. “Students’ Expectations of Teaching: the Business, Accounting and Economics Experience.” e-Journal of
Business Education & Scholarship of Teaching 5(1): 1-
17.http://www.ejbest.org/upload/eJBEST_Handal,_Wood _Muchatuta_2011_1.pdf (14.07.2013)
Horváth, Tamás, Kiss László, Nyerges Andrea and Roberts Éva (ed.) 2011. Final volume of GCTS. Zárókötet. Educatio Kht. Budapest.
Imre, Nóra & Nagy, Mária. 2003. ‘Teachers.’ Pedagógusok. In
Jelentés a magyar közoktatásról, edited by Balogh
Miklós et al., 273- 309.OKI, Budapest.
Kárpáti, Andrea. 2008. “Teacher education and in -service training.” Tanárképzés, továbbképzés. In Zöld könyv a
magyar közoktatás megújításáért, edited by Fazekas
Károly, Küllő János, and Varga Júlia, 193- 217.
Letcher, David W. and Neves, Joao S. 2010. “Determinants of undergraduate business student satisfaction.” Research
in Higher Education Journal 6: 1-26. Academic and
Business Research Institute. Florida, USA.
Liskó, Ilona. 2004. “The efficiency of teachers’ in-service training.” A pedagógus-továbbképzés hatékonysága.
Educatio 13.3: 391–405.
Mihály, Ildikó. 2002. “Teacher education and teacher career in the age of life-long learning.” A pedagógusképzés és a pedagógus- életpálya az élethosszig tartó tanulás korában. Új Pedagógiai Szemle April Issue.
Nagy, Mária. 2004. “Career starting as center phase of becoming a teacher.” Pályakezdés, mint a pedagógusképzés középső fázisa. Educatio 3: 375– 390.
OECD. 2005. Teachers matter: Attracting, developing and
Polonyi, István. 2004. “Teacher education in the context of Education Economy.” Pedagoguskepzes — oktatas-gazdasagtani megkozelitesben. Educatio 13(3): 343– 359.
Scheerens, Jaap. 2010. Teachers’ Professional Development
Europe in international comparison. European Union.
Printed in Belgium.
Varga, Júlia. 2007. “Who will become a teacher?” Kibõl lesz ma tanár? A tanári pálya választásának empirikus elemzése. Közgazdasági Szemle 54: 609–627.