1 Kinetics of pyrolysis of litter materials from pine and eucalyptus forests
R. Wadhwani*1, 2, D. Sutherland1, 3, K. A. M. Moinuddin1, 2, P. Joseph1
1 Centre for Environmental Safety and Risk Engineering, Victoria University, Melbourne, VIC 3030, Australia 2Bushfire and Natural Hazards CRC, Melbourne, VIC 3002, Australia
3Department of Mechanical Engineering, University of Melbourne, Melbourne, VIC 3052, Australia
Abstract:
Wildfires are an integral part of the Australian continent, and to estimate the rate of spread of wildfires using computational models, it is important to know the kinetic parameters of the materials that constitute the fuel load in forests. These kinetic parameters are utilised in pyrolysis and combustion sub-models of a computational model. In the present work, the kinetics of pyrolysis of timber and litter materials (consisting of bark, twig and leaf) from
Pinus Radiata and Eucalyptus Obliqua sub. Messmate forests were estimated under nitrogen. The activation energy for the pyrolysis of timber was found to be independent of conversion, whereas it varied for the litter materials in the range of the pyrolysis temperatures employed. Furthermore, the parameters pertaining to a single equivalent reaction model were also identified. For the samples studied, the most suitable reaction model was identified as the Johnson-Mehl-Avarami model. The activation energy measurements reported here are consistent with measurements previously reported for other species within the Pinus and
Eucalyptus genera.
Keywords: wildfire, forest litter, pine, eucalyptus, pyrolysis, thermo-gravimetric analysis (TGA)
List of symbols:
α the degree of conversion (dimensionless)
αp the degree of conversion at the maxima of the differential kinetic curve at each heating rate
A pre-exponential factor (s-1)
β heating rate (K/min)
E activation energy (kJ/mol)
f(α) the general form of the kinetic model
f'(α) derivative form of the kinetic model (d(f(α))/dα) g(α) the integral form of the kinetic model ʃdα/f(α) R the Universal gas constant (8.314 J mole-1 K-1)
t time (s)
T absolute temperature (K)
x reduced activation energy (E/RT)
xp reduced activation energy at the maxima of the differential kinetic curve at each heating rate
1. Introduction:
Physics-2 based models primarily solve a form of the Navier-Stokes equation that is suitable for atmospheric modelling with significant density variation. Heat transfer by conduction, convection, and radiation are included in the model, and the combustion process is modelled by a simple mixed-is-burned scheme. Furthermore, the pyrolysis of solid fuels is modelled by the Arrhenius equation for each species [6]. The physics-based model provides an in-depth simulation that can shed light on the detailed mechanisms of fire propagation. The pyrolysis modelling requires an accurate estimation of thermal degradation properties of forest fuels.
The spread of fire front inside of a forest progresses rapidly through surface litter fuels, which typically contain broken pieces of dead and live bark, twigs, and leaves [7]. The burning of larger branches (diameter > 6mm) and forest timber plays an important role in smouldering combustion, total smoke and heat release. However, combustion of larger material is of secondary importance in the modelling the propagation of a fire front. Larger materials that undergo smouldering combustion can also cause re-ignition of a spreading wildfire several days after an initial fire front has passed through an area [8].
Another mechanism of spread of fire is through the ignition caused by firebrands [7, 9]; firebrands constitute, for example, burning pieces of bark, twigs and leaves. Firebrands generally travel along with the wind causing ignition of the surface fuels [7, 10]. It is speculated that the thermochemical properties of forest litter materials are different that of the forest timber. Those differences were observed in the present work through Fourier transform infrared spectroscopy (FTIR), and Thermo-gravimetric analysis (TGA).
Mishra et al. 2015 [11] carried out thermal degradation studies on pine timber in an inert atmosphere of nitrogen. They classified the complex pyrolysis of pine timber into three regimes: removal of moisture from the timber (in the temperature range of 30-150⁰C), active pyrolysis (thermal degradation of cellulose and hemicellulose in the temperature range of 150-400⁰C) and passive pyrolysis (thermal degradation of lignin in the temperature range of 400-700⁰C). The authors also suggested that a 2D diffusion model (see Table 1), with reaction order 1.5, was the appropriate one to predict the thermal degradation of pine wood up to 70% conversion. Liu and Fan 1998 [12] studied the thermal degradation of different wood species and their leaves in an inert atmosphere of nitrogen, assuming that the degradation followed a second-order reaction kinetics. They showed that the kinetic parameters obtained agreed with the TGA data. Furthermore, they found that the mass loss curves for wood and leaves are complicated and appeared to be governed by several simple reactions occurring throughout the entire range of temperature analysis.
Leoni et al. 2001 [13] and 2003 [14] reported on the kinetics of Pinus pinaster pine leaves (typically referred to as needles) during drying and thermal degradation processes respectively. They measured the rates of the processes using differential scanning calorimetric (DSC) measurements in an oxidative atmosphere (i.e. in air). Their study revealed that the thermal degradation of pine needles occurred in the range of 200-550⁰C, which in turn was composed of two exothermic reactions: (1) oxidation of the evolved gases, and (2) char combustion. They also concluded that further studies were required to estimate kinetic parameters, especially, for the purpose of prediction of fire propagation. Font et al.
3 mass spectrometry (TGA-MS). Here the authors proposed multiple reaction models for individual regimes of thermal degradation, i.e. multiple reaction models for each of the pyrolytic, char oxidation, and oxidative pyrolysis regimes.
For the purpose of modelling large-scale fires, it is often desirable to employ reduced models for the constituent reaction processes. Senneca 2007 [16] applied a single reaction model to pyrolysis, char oxidation and char gasification with carbon dioxide for wood chips, olive husk, and pine seed shells. The author found an acceptable level of agreement with the predicted and observed values from TGA runs. Morvan and Dupuy 2004 [17] applied a single reaction model for pyrolysis and char oxidation for Mediterranean shrubs to simulate fire propagation.
In light of the above, it became increasingly clear that there is a requirement to estimate the thermal degradation parameters of individual forest litter fuel materials for better prediction of fire propagation through the forest litter fuel bed in Australia. The estimated parameters will be used in Arrhenius based pyrolysis and combustion sub-models [3, 6]. In the present work, we chose two commonly available Australian species of forest fuel litter materials (Pinus radiata (PR)and Eucalyptus obliqua sub. messmate (EM)). These forest litter samples can be divided into three main categories: bark, twigs, and needles/leaves. In those forests where these species are common, the litter accumulation per year is in the range of 1.8-5.5 ton/hectare [18, 19]. This data suggests that the lower layer of forest fuel is not substantially exposed to air. Furthermore, Morvan and Dupuy 2001 [20] used the data pertaining to pine needles that were obtained in an inert atmosphere for their fire simulations. Therefore, following on from their observation, the thermal degradation of all samples considered in the present work was carried out in an inert atmosphere of nitrogen.
2. Theoretical model:
Reaction kinetics used for modelling [3, 6, 17, 20] are defined by the Arrhenius equation of the form:
𝑑𝛼
𝑑𝑡 = 𝐴𝑓(𝛼)𝑒
−𝑥, (1)
where dα/dt is the rate of conversion, x = E/RT is the reduced form of activation energy, A is the pre-exponential factor, and f(α) is the reaction model. Table 1 lists the most commonly applied reaction models [21]. Here α is the mass conversion, which is defined as:
𝛼 = (𝑚0−𝑚𝑡)
(𝑚0−𝑚𝑓), (2)
where m0 is the initial mass, mf is the final mass and mt is the mass at time t.
For the dynamic TGA process, we define the heating rate β = dT/dt. Therefore, by using the definition of β in equation (1) we get:
𝑑𝛼 𝑑𝑇=
𝐴 𝛽𝑓(𝛼)𝑒
−𝑥 . (3)
4 energy from the slope of straight lines at each iso-conversional step of α = 0.01 [25]. The FWO equation is given as:
𝑙𝑜𝑔𝛽 = log ( 𝐴𝐸
𝑅𝑔(𝛼)) − 2.315 − 0.4567
𝐸
𝑅𝑇 . (4)
where g(α) is the integral form of the kinetic model.
The KAS method is similar, except that log(β/T2) is plotted against 1/T (Eq. 5) to obtain activation energy from the slope of straight lines at each iso-conversional step of α = 0.01 [25]. The KAS equation is:
log (𝛽
𝑇2) = log (
𝐴𝑅 𝐸𝑔(𝛼)) −
𝐸
𝑅𝑇 . (5)
These two methods are commonly used and Starink 1996 [26] observed that the predictions of activation energy from these two methods differ by less than 1%.
Table 1: Common kinetic models used for obtaining f(α) [11, 21]
Model Symbol f(α)
Johnson-Mehl-Avarami JMA (n) 𝑓(𝛼) = 𝑛(1 − 𝛼)[− ln(1 − 𝛼)](1−1 𝑛⁄ )
1D reaction model R1 𝑓(𝛼) = (1 − 𝛼)
2D reaction model R2 𝑓(𝛼) = (1 − 𝛼)2
3D reaction model R3 𝑓(𝛼) = (1 − 𝛼)3
2D diffusion model D2 𝑓(𝛼) = 1
[−𝑙𝑛(1−𝛼)]
3D diffusion-Jander model D3
𝑓(𝛼) =3
2
(1−𝛼)2⁄3
[1−(1−𝛼)1⁄3]
Once the activation energy has been calculated, from either the FWO or KAS method, it is then required to choose appropriate kinetic model for f(α) as listed in Table 1.
To find f (α) for the forest litter materials, we created the YZ master plot method described by Málek 1992 [21]. For our forest litter samples where JMA (n>1) applies, show noticeable agreement with the experimental observations. Thus, we applied JMA (2), JMA (3), and JMA (4) models to find the best fit [23, 25].
The pre-exponential factor A is identified from the maximum value of the conversion rate dα⁄dt, where xp and αp are defined as the values of x and α at the maximum conversion rate, respectively. An expression for A can be then found by differentiating equation (3) [21, 25], that is:
𝐴 = −𝛽𝑥𝑝
60𝑇𝑝𝑓′(𝛼𝑝)𝑒
𝑥𝑝 . (6)
3. Experimental setup:
5 The forest litter materials from two species of tree (PR and EM) were collected from a forest situated to the east of the city of Melbourne, Australia. The litter samples were separated from any small pebbles, rocks, grass, green leaves, twigs larger than 6 mm in diameter, and soil. The samples were kept in a conditioning cabinet at 27⁰C and 50% relative humidity for more than 36 hours prior to experiments. The samples are broken to the approximate size of 1-4 mm for loading onto 70 μL alumina crucibles that were subsequently used in the Mettler Toledo TGA/DSC 1 instrument. The effect of sample size was found to be negligible on the thermogram, when the experiments were carried out at sizes of 1-4 mm and 0.18-0.6 mm.
3.2 Test procedures:
Thermal degradation of forest litter samples was carried out using a Mettler Toledo TGA/DSC 1 instrument. The apparatus detects the mass loss of sample with respect to temperature, with a resolution of 1μg. In order to avoid any possible interference owing to the the difference in masess of the samples, and for convenience in the data processing, the initial masses of the samples were kept constant for all the experimental runs. The initial sample mass was mi = 7.5 ± 0.01 mg. In the TGA run, the samples were heated from 30-900⁰C in an inert atmosphere of nitrogen, with a constant flow rate of 20 ml/min, at the different heating rates. The flow rate of inert gas was varied at 20, 50, and 100 ml/min; only minute effects were observed on the thermograms at higher flow rates of 50 and 100 ml/min.
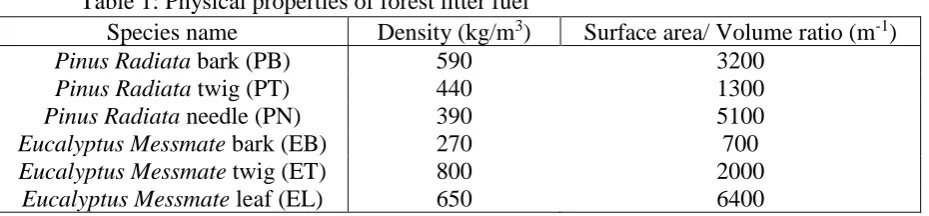
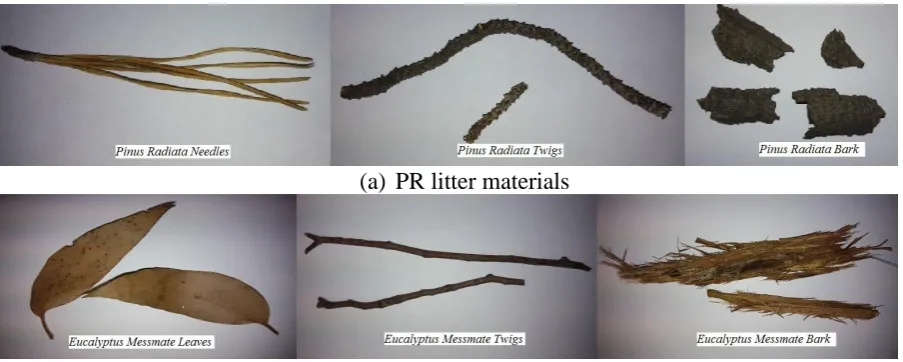
A broad range of heating rates was considered, such as: 5, 7.5, 10, 20, 50, 100 K/min, to obtain thermal degradation parameters of forest litter fuels corresponding to a range of fire propagation patterns during a wildfire. It should be noted here that the composition of forest litter categories varies over a timescale of months and years [27]. To represent a composite forest litter, we selected three representative weight fractions of the individual litter materials (leaves, twigs, and bark) based on the least count of the weighing balance. They were labelled as PN/EL20T20B60, PN/EL40T20B40, and PN/EL60T20B20 for the PR and EM forest litter samples respectively. For example, PN20T20B60 is a sample of pine litter consisting of 20% needles, 20% twigs, and 60% bark (weight percentages). Table 1 shows some bulk physical properties of forest litter fuel used in this study, and Figure 1 depicts the photographs of the individual categories of forest litter samples, after sorting and conditioning.
Table 1: Physical properties of forest litter fuel
Species name Density (kg/m3) Surface area/ Volume ratio (m-1)
Pinus Radiata bark (PB) 590 3200
Pinus Radiata twig (PT) 440 1300
Pinus Radiata needle (PN) 390 5100
Eucalyptus Messmate bark (EB) 270 700
Eucalyptus Messmate twig (ET) 800 2000
6 (a) PR litter materials
(b) EM litter materials
Fig. 1: (a) Photographs of pine needle, twig and bark pieces (b) Photographs of eucalyptus leaf, twig, and bark samples
3.3 Data Processing:
The TGA data acquisition was carried out using the STARe thermal analysis software of the Mettler Toledo instrument. The analysis and processing of data were performed by using MATLAB. The data from three experimental runs were selected to minimise drifts in the results owing variation in the composition of the individual samples, as reported earlier by Yao et al. 2008 [28]. The mass loss data, which varied more than 1% from the ensemble mean of the collected data, were rejected and two more experiments were carried out to choose the most consistent of the three experimental runs to form the final data set. The gradient of mass loss data was cleaned with the nearest neighbour smoothing to remove the sharp peaks, believed to be experimental noise, observed during data acquisition. This can be attributed to the enhanced vaporisation process, especially, at the higher heating rates.
4. Results and Discussion:
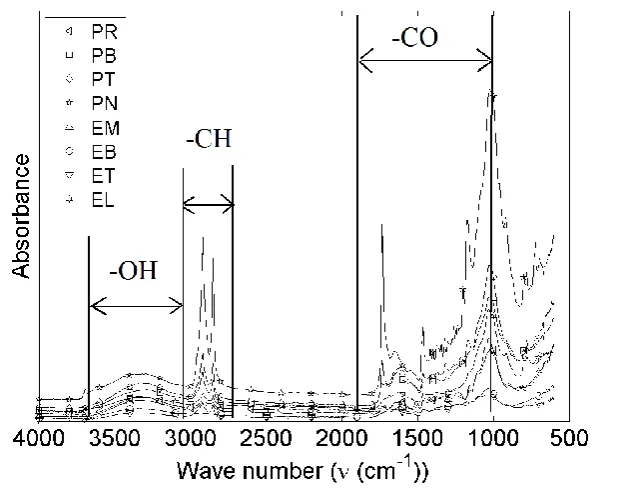
4.1 FTIR analysis
Fourier transform infrared (FTIR) spectroscopic analyses were carried out on forest litter materials and timber with a view to identifying any subtle structural and constitutional differences between the samples. The FTIR spectra were obtained, on samples in the Attenuated Total Reflectance (ATR) mode using a Perkin Elmer Frontier spectrometer, and are shown in Figure 2 for all timber and litter materials. Many qualitative differences between litter material and timber samples are apparent in the spectra, especially in the finger-print region, such as –CH (ν ~ 2800 – 3050 cm-1) and –CO stretch (ν ~ 1000 – 1850 cm-1). The -CH region shows the presence of two bands at ~2920 and ~2860 cm-1 representing to asymmetric and symmetric stretching vibrations of methyl and methylene groups. Their presence is quite high for PN compared to other PR litters, while it is very limited or absent in case of the eucalyptus species. In -CO region there is a significant presence of -CO unconjugated ketone and -COC cellulose vibrations in PN and PT (~1740 and ~1200 cm-1). The observations for EM and PR are similar to the one obtained for Eucalyptus Grandis and
7 and timber samples are duly reflected in the corresponding differences in their TGA mass loss curves and the kinetic properties.
Fig. 2: FTIR spectroscopy of both PR and EM timber and forest litter materials
4.2. TGA analysis
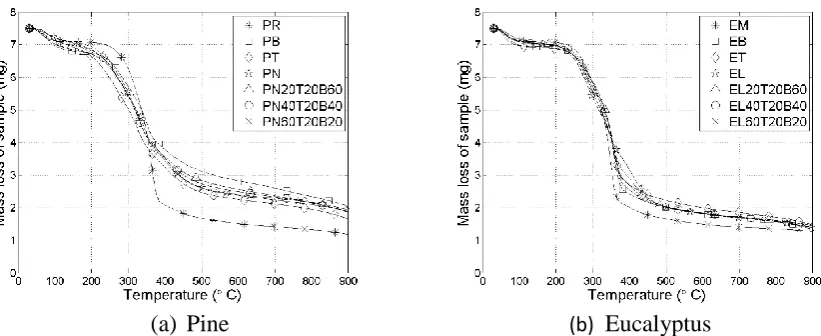
The mass loss curves as a function of temperature for pine and eucalyptus forest litter materials and timbers are shown in Fig. 3 (a) and (b). The figures demonstrate that the general profiles of the mass loss curves of the forest litter materials are noticeably different to those of the corresponding timber material. Furthermore, the general profile of the thermo-grams of the PR litter materials evidently deviated more than those of EM litter materials. It was also observed that a linear superposition of the individual litter fuel components reproduces the mass loss curve of the mixture litter materials (i.e. the mass loss curves are additive in nature). For example, in the case of the PN20T20B60, the mass loss curve can be obtained, with an average deviation of 2%, as follows:
0.2 ×𝑚𝑎𝑠𝑠 𝑙𝑜𝑠𝑠 𝑜𝑓 𝑝𝑖𝑛𝑒 𝑛𝑒𝑒𝑑𝑙𝑒𝑠 + 0.2 ×𝑚𝑎𝑠𝑠 𝑙𝑜𝑠𝑠 𝑜𝑓 𝑡𝑤𝑖𝑔 + 0.6×𝑚𝑎𝑠𝑠 𝑙𝑜𝑠𝑠 𝑜𝑓 𝑏𝑎𝑟𝑘 = 𝑚𝑎𝑠𝑠 𝑙𝑜𝑠𝑠 𝑜𝑓 𝑃𝑁20𝑇20𝐵60,
Any deviation observed can be attributed to the possible mild compositional variations in the samples of the same species.
8
(a) Pine (b) Eucalyptus
Fig. 3: Mass loss as a function of temperature for the species and its litter materials
(a) Pine (b) Eucalyptus
Fig. 4: Rate of mass loss as a function of temperature for the species and its litter materials
In order to determine the activation energy using the FWO and KAS methods [23], plots of log(β) vs. 1/T (FWO) and log(β/T2) vs. 1/T (KAS) for forest litter materials and timbers were constructed (Figs. 5 and 6). From the mass loss data, it can be shown that the pyrolysis reaction occurs in the region α = [0.2, 0.6] for pine and α = [0.15, 0.75] for eucalyptus. Therefore, computations of the kinetic parameters of materials were essentially carried out within the above regions.
9
(c) PT (d) PN
(e) EM (f) EB
(g) ET (h) EL
10
(a) PR (b) PB
(c) PT (d) PN
(e) EM (f) EB
11 Fig. 6: log(β/T2) v 1/T curves for both pine and eucalyptus forest litter materials and timber
for the KAS method of calculating activation energy
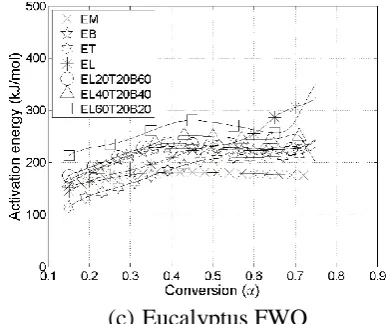
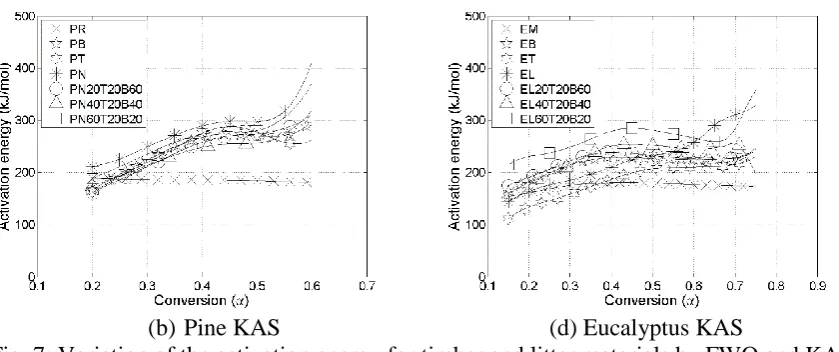
The activation energies with conversion, (E(α)), computed from slopes of the best-fit lines from Fig. 5 and 6, are shown in Fig. 7 which shows the variation of activation energy (E) with conversion (α) for timber and litter materials. The activation energies for both species of timber materials (PR, EM) were found to be almost independent of conversion (i.e. the activation energies are almost constant within the temperature range where main pyrolysis reactions occur). In this case, we can apply a single step reaction model following the recommendation of Vyazovkin et al. 2011 [25]. However, for the litter materials, the activation energies do vary with conversion in the range of the pyrolysis reaction which suggests a multi-step reaction model should be used. A multi-step reaction model, in this case, would correspond to a single reaction model for the decomposition of each of cellulose, hemicellulose, and lignin [30].
However, in order to simulate gross properties of forest fires, for example, the rate of fire spread, time to ignition, etc., it is believed that a single step model for the pyrolysis reaction will be sufficient and will have computational advantages. Morvan and Dupuy 2001 [20] and 2004 [17] applied a single step pyrolysis model to study fire propagation in Mediterranean forest fuels. In the present work, we have observed for samples, EB, ET, EL20T20B60 and EL40T20B40, that the activation energy is constant and approximately independent of conversion (α) in the range of α = [0.4, 0.7] and for pine litter materials in the range of α = [0.35, 0.55]. However, to choose an appropriate reaction kinetic model, (f(α)), for forest litter materials we applied a truncated Sestak-Berggren model [25], and observed that the Johnson-Mehl-Avarami (JMA (3) and (4)) models are the best suitable models for the materials considered.
12
(b) Pine KAS (d) Eucalyptus KAS
Fig. 7: Variation of the activation energy for timber and litter materials by FWO and KAS methods
Table 2 shows the activation energies obtained at the maximum value of dα/dt in the case of individual timber, litter materials and the mixtures of samples by employing the FWO and KAS methods. The difference between the two estimated activation energies are computed at every step of α over the pyrolysis range of α = [0.2, 0.6] for pine and α = [0.15, 0.75] for eucalyptus. The differences are then averaged to obtain the average difference in the activation energies estimated by the FWO and the KAS methods.
Furthermore, the activation energies obtained for timber (PR and EM) are quite close to the values reported in the literature for similar species under similar conditions. The activation energies obtained for Australian pine litters PB, PT, and PN in this study have a higher value than those reported by Korobeinchev et al. 2013 [30] for Siberian Pine forest litters in an inert atmosphere of helium. The authors also observed that the activation energy varied with conversion and spanned from 150 to 400 kJ/mol in the pyrolysis range. This result is similar to our observations for forest litter materials. However, the activation energies observed for EB, and EL are significantly larger than the values reported by Chen et al. 2015 [31]. This is likely to have arisen owing to the difference in methods that are employed to estimate the parameters. Chen et al. 2015 [31] applied the Distributed Activation Energy Model (DAEM) to estimate kinetic parameters for their forest sample.
Table 2: Activation energy for timber and forest litter materials obtained (at the maximum value of dα/dt) by FWO and KAS method
Sample EFWO
(kJ/mol)
EKAS (kJ/mol) Average difference between FWO and KAS (kJ/mol)
Similar observation PR 182.89 (α=0.59) 181.60 (α=0.59) 0.7 159.3 [28]
193.5 [33] PB 268.34 (α=0.55) 271.55 (α=0.55) 2.6 184.3 [31] PT 252.66 (α=0.58) 255.39 (α=0.58) 3.0 167.6 [31] PN 322.75 (α=0.56) 329.01 (α=0.56) 4.5 164.3 [30] 226.3 [12] PN20T20B60 284.22 (α=0.56) 288.37 (α=0.56) 2.7
13 PN60T20B20 301.21 (α=0.55) 306.40 (α=0.55) 3.7
EM 178.58 (α=0.59) 177.28 (α=0.59) 1.0 175.8 [32] 162.7 [28] 205.8 [34] EB 223.89 (α=0.59) 224.79 (α=0.59) 1.0 149.21[32] ET 210.12 (α=0.59) 210.34 (α=0.59) 1.1
EL 250.80 (α=0.59) 253.00 (α=0.59) 0.8 141.15 [32] EL20T20B60 226.30 (α=0.59) 227.31 (α=0.59) 1.4
EL40T20B40 243.87 (α=0.59) 245.79 (α=0.59) 1.7 EL60T20B20 264.87 (α=0.59) 267.91 (α=0.59) 3.4
After obtaining the values for the activation energy by FWO and KAS method, we calculated the pre-exponential factor (A) and assigned the reaction kinetic model (f(α)) required to describe Arrhenius equation (Eq. 1). Table 3 shows an estimation of the pre-exponential factor and attribution of the best reaction kinetic model (f(α)) obtained through a master YZ plot [21, 25] and the truncated Sestak-Berggren model [25] for each sample at different heating rates.
Table 3: Pre-exponential factor (A) and best reaction kinetic model (f(α)) for timber and litter materials at each heating rate (K/min) = [5, 7.5, 10, 20, 50, 100]
Sample Model (f(α)) log10(A) FWO (s-1) log10(A) KAS (s-1) PR JMA (4) [12.25, 12.28, 12.25,
12.23, 12.17, 12.24]
[12.14, 12.17, 12.15, 12.13, 12.07, 12.14] PB JMA (4) [18.96, 19.10, 19.20,
19.26, 19.26, 19.09]
[19.23, 19.37, 19.46, 19.52, 19.52, 19.34] PT JMA (4) [18.32, 18.46, 18.28,
18.47, 18.47, 18.38]
[19.83, 18.90, 19.41, 18.90, 18.70, 18.64] PN JMA (3) [23.90, 24.18, 24.32,
24.40, 24.51, 24.30]
[24.43, 24.71, 24.85, 24.92, 25.03, 24.81] PN20T20B60 JMA (4) [20.50, 20.62, 20.67,
20.71, 20.84, 20.62]
[20.85, 20.97, 21.02, 21.06, 21.19, 20.96] PN40T20B40 JMA (4) [19.88, 20.04, 20.21,
20.32, 20.25, 20.21]
[20.21, 20.36, 20.53, 20.64, 20.57, 20.52] PN60T20B20 JMA (3) [22.22, 22.50, 22.51,
22.60, 22.57, 22.57]
[22.66, 22.94, 22.95, 23.04, 23.00, 23.00] EM JMA (4) [12.30, 12.28, 12.29,
12.27, 12.29, 12.20]
[12.19, 12.18, 12.17, 12.16, 12.18, 12.09] EB JMA (4) [15.67, 15.67, 15.70,
15.62, 15.62, 15.71]
[15.74, 15.75, 15.78, 15.70, 15.69, 15.78] ET JMA (4) [14.43, 14.58, 14.46,
14.52, 14.54, 14.56]
[14.45, 14.59, 14.48, 14.54, 14.56, 14.48] EL JMA (3) [17.22, 17.43, 17.42,
17.45, 17.52, 17.53]
[17.41, 17.61, 17.60, 17.63, 17.69, 17.60] EL20T20B60 JMA (4) [15.81, 15.82, 15.82,
15.82, 15.80, 15.79]
[15.90, 15.90, 15.90, 15.90, 15.88, 15.86] EL40T20B40 JMA (4) [17.73, 17.23, 17.21,
17.16, 17.17, 17.15]
14 18.91, 18.89, 18.94] 19.16, 19.13, 19.18]
5. Conclusions
Measurements of the kinetic properties of forest surface litter fuels are essential to simulate wildfire propagation through the forest surface. The kinetic parameters of two commonly found Australian forest fuels (i.e. Pinus Radiata and Eucalyptus obliqua sub. Messmate) were studied over a broad range of heating rates in an inert atmosphere of nitrogen. The kinetic parameters including activation energies, pre-exponential factors, and reaction models were determined for the pyrolysis reaction of the timber, leaves, bark, and thin twigs. For the same species, the timber sample behaved very differently compared to the corresponding litter materials. These differences could be attributed to their compositional variations as confirmed by their FTIR spectra and to their thermal degradation characteristics revealed through TGA thermograms. For instance, the rates of mass loss showed the presence of two shoulder peaks, as a significant feature, corresponding to hemicellulose and lignin decomposition in litter materials, whereas the corresponding shoulder peaks are relatively smaller for the timber samples. Therefore, the decomposition of cellulose, hemicellulose, and lignin seems to be more or less equally influence the overall pyrolytic profile of the litter materials.
However, in order to simulate and study the gross features of forest fires, such as the rate of fire spread, time to ignition, etc., a single-step model for the pyrolysis reaction appears to be sufficient, and can be easily implemented through the current physics-based computational models [6, 17, 20]. The kinetics parameters observed for the forest fuel samples were obtained by employing the two commonly used methods, i.e. Flynn-Wall-Ozawa (FWO) and Kissinger-Akahire-Sunose (KAS) methods. The mass loss of composite litter shows an additive nature of the individual litter materials with an average deviation of 2%. Hence, using individual litter materials mass loss data can be used to construct a composite forest litter for analysis as litter composition varies over the timescale of months and years. Further, it was observed that the leafy part of forest litter materials, i.e. pine needles and eucalyptus leaves, behaved significantly differently to the bark and thin twigs at least in a qualitative sense.
The activation energies, pre-exponential factors, and the reaction models were also obtained for the equivalent single-step reaction model for the pyrolysis of the litter materials. The values obtained were in agreement with the corresponding values reported in the literature of similar materials. As the next step, we intend to utilise the results obtained so far to numerically investigate the likelihood of firebrands to ignite the fuel bed of litter materials and cause a spotfire. Finally, we also wish to validate the numerical simulations through comparisons to experimental observations.
Acknowledgements:
We wish to acknowledge the financial support given by Bushfire and Natural Hazard Cooperative Research Centre, Melbourne, Australia. The authors also thank Dr Marlene Cran and Mr Lyndon Macindoe at Victoria University for their assistance and helpful discussions in this work.
15 [1] W.M. Jolly, M.A. Cochrane, P.H. Freeborn, Z.A. Holden, T.J. Brown, G.J. Williamson, D.M.J.S. Bowman, Climate-induced variations in global wildfire danger from 1979 to 2013., Nat. Commun. 2015;6:7537. doi:10.1038/ncomms8537.
[2] A.L. Sullivan, Wildland surface fire spread modelling, 1990–2007. 2: Empirical and quasi-empirical models, Int. J. Wildl. Fire. 2009;18:369–386. doi:10.1071/WF06144.
[3] A.L. Sullivan, Wildland surface fire spread modelling, 1990–2007. 1: Physical and quasi-physical model, Int. J. Wildl. Fire. 2009;18:349-368. doi: 10.1071/WF06143
[4] A.L. Sullivan, Wildland surface fire spread modelling, 1990–2007. 3: Simulation and mathematical analogue models, Int. J. Wildl. Fire. 2009;18:387-403. doi:10.1071/WF06145.
[5] K. Tolhurst, B. Shields, and D. Chong, Phoenix: development and application of a bushfire risk management tool, Aust. J. Emerg. Manage. 2008;23:47-54.
[6] K. McGrattan, R. McDermott, J. Floyd, S. Hostikka, G. Forney, H. Baum, Computational fluid dynamics modelling of fire, Int. J. Comut. Fluid Dyn. 2012;26:349–361. doi:10.1080/10618562.2012.659663.
[7] P. F. Ellis, The aerodynamic and combustion characteristics of eucalypt bark: a firebrand study. PhD Thesis 2000 https://digitalcollections.anu.edu.au/handle/1885/49422 (Accessed 30 June 2016).
[8] J.E. Keeley, Fire intensity, fire severity and burn severity: a brief review and suggested usage, Int. J. Wildl. Fire. 2009;18:116-126. doi:10.1071/WF07049.
[9] C.S. Tarifa, P.P. Notario, F.G. Del Moreno, A.R. Villa, Transport and combustion of firebrands, U.S. Dep. Agric. For. Serv. II 1967.
[10] S.L. Manzello, S. Suzuki, Experimentally simulating wind driven firebrand showers in wildland-urban interface (WUI) fires: Overview of the NIST firebrand generator (NIST dragon) technology, Procedia Eng. 2013;62:91–102. doi:10.1016/j.proeng.2013.08.047.
[11] G. Mishra, J. Kumar, T. Bhaskar, Kinetic studies on the pyrolysis of pinewood, Bioresour. Technol. 2015;182:282–288. doi:10.1016/j.biortech.2015.01.087.
[12] N.A. Liu, W.C. Fan, Modelling the thermal decompositions of wood and leaves under a nitrogen atmosphere, Fire Mater. 1998;22:103–108.
[13] E. Leoni, P. Tomi, B. Khoumeri, N. Balbi, A. F. Bernardini, Thermal Degradation of Pinus pinaster Needles by DSC. Part 1: Dehydration Kinetics, J. Fire Sci. 2001;19:379–397. doi:10.1106/QBDC-5VH2-U5X2-FUF7.
[14] E. Leoni, D. Cancellieri, N. Balbi, P. Tomi, A.F. Bernardini, Thermal Degradation of Pinus Pinaster Needles by DSC, Part 2: Kinetics of Exothermic Phenomena, J. Fire Sci. 2003;21:117-130. doi:10.1177/073490402032834.
16 [16] O. Senneca, Kinetics of pyrolysis, combustion and gasification of three biomass fuels, Fuel Process. Technol. 2007;88:87–97. doi:10.1016/j.fuproc.2006.09.002.
[17] D. Morvan, J.L. Dupuy, Modeling the propagation of a wildfire through a Mediterranean shrub using a multiphase formulation, Combust. Flame. 2004;138:199–210. doi:10.1016/j.combustflame.2004.05.001.
[18] B. Berg, R. Laskowski, Litter Fall, Adv. Ecol. Res. 2005;38:19-71. doi:10.1016/S0065-2504(05)38002-0.
[19] P.M. Attiwill, H.B. Guthrie, R. Leuning, Nutrient Cycling in a Eucalyptus obliqua (L’hérit.) Forest. I. Litter Production and Nutrient Return, Aust. J. Bot. 1978;26:79–91. doi:10.1071/BT9780079.
[20] D. Morvan, J.L. Dupuy, Modeling of fire spread through a forest fuel bed using a multiphase formulation, Combust. Flame. 2001;127:1981–1994. doi:10.1016/S0010-2180(01)00302-9.
[21] J. Málek, The kinetic analysis of non-isothermal data, Thermochim. Acta. 1992;200:257-269. doi:10.1016/0040-6031(92)85118-F.
[22] T. Ozawa, A New Method of Analyzing Thermogravimetric Data, Bull. Chem. Soc. Jpn. 1965;38:1881–1886. doi:10.1246/bcsj.38.1881.
[23] H. Tanaka, Thermal analysis and kinetics of solid state reactions, Thermochim. Acta. 1995;267:29–44. doi:10.1016/0040-6031(95)02464-6.
[24] H.E. Kissinger, Reaction Kinetics in Differential Thermal Analysis, Anal. Chem. 1957;29:1702–1706. doi:10.1021/ac60131a045..
[25] S. Vyazovkin, A.K. Burnham, J.M. Criado, L.A. Pérez-Maqueda, C. Popescu, N. Sbirrazzuoli, ICTAC Kinetics Committee recommendations for performing kinetic computations on thermal analysis data, Thermochim. Acta. 2011;520:1–19. doi:10.1016/j.tca.2011.03.034.
[26] M.J. Starink, A new method for the derivation of activation energies from experiments performed at constant heating rate, Thermochim. Acta. 1996;288:97–104. doi:10.1016/S0040-6031(96)03053-5.
[27] D.H. Ashton, Studies of Litter in Eucalyptus regnans Forests, Aust. J. Bot. 1975;23:413– 433. doi:10.1071/BT9750413.
[28] F. Yao, Q. Wu, Y. Lei, W. Guo, Y. Xu, Thermal decomposition kinetics of natural fibers: Activation energy with dynamic thermogravimetric analysis, Polym. Degrad. Stab. 2008;93:90–98. doi:10.1016/j.polymdegradstab.2007.10.012.
[29] M. Poletto, A.J. Zattera, R.M.C. Santana, Structural differences between wood species: Evidence from chemical composition, FTIR spectroscopy, and thermogravimetric analysis, J. Appl. Polym. Sci. 2012;126:337–344. doi:10.1002/app.36991.
[30] H. Niu, N. Liu, Effect of Particle Size on Pyrolysis Kinetics of Forest Fuels in Nitrogen,
IAFSS-Fire Saf. Sci. Proc. Elev. Int. Symp. (2014).
17 [31] O.P. Korobeinichev, A.A. Paletsky, M.B. Gonchikzhapov, I.K. Shundrina, H. Chen, N. Liu, Combustion chemistry and decomposition kinetics of forest fuels, Procedia Eng. 2013;62:182–193. doi:10.1016/j.proeng.2013.08.054.
[32] Z. Chen, Q. Zhu, X. Wang, B. Xiao, S. Liu, Pyrolysis behaviors and kinetic studies on Eucalyptus residues using thermogravimetric analysis, Energy Convers. Manag. 2015;105:251–259. doi:10.1016/j.enconman.2015.07.077.
[33] M. Poletto, A.J. Zattera, R.M.C. Santana, Thermal decomposition of wood: Kinetics and degradation mechanisms, Bioresour. Technol. 2012;126:7–12. doi:10.1016/j.biortech.2012.08.133.
![Table 1: Common kinetic models used for obtaining f(α) [11, 21]](https://thumb-us.123doks.com/thumbv2/123dok_us/7936504.1317653/4.595.67.522.307.436/table-common-kinetic-models-used-obtaining-f-a.webp)

![Table 3: Pre-exponential factor (A) and best reaction kinetic model (f(α)) for timber and litter materials at each heating rate (K/min) = [5, 7.5, 10, 20, 50, 100]](https://thumb-us.123doks.com/thumbv2/123dok_us/7936504.1317653/13.595.68.501.370.772/table-exponential-factor-reaction-kinetic-timber-materials-heating.webp)
