Available online: http://edupediapublications.org/journals/index.php/IJR/ P a g e | 1288 The novel Reference frame best fit fiber bundle shape recognition by Machine Learning
Shaheen Layaq,Ramesh D & V Redya
Lecturer in Computer Science Singareni Collieries Women’s Degree & P.G College Kothagudem , Khammam TS.
HOD in the department of CSE in Bomma Institute Of Technology And Science Asst. Professor Dept of Computer Science, Kakatiya University, Warangal, TG
Abstract
This is about frames of reference and their relation to classification. A classification is needed to establish a frame of reference and, with a frame of reference, measurements and further classifications are possible. The topic is discussed in terms of a method that chooses the”best” among alternative frames of reference. We will describe how measurements induce a fiber bundle that projects from a total space of objects onto a base space of measurement values. Local inverses of this projection, or ”sections” of the fiber bundle play the role of frames of reference or ideal objects that are
attached to the data, as the nearest neighbor in the fiber. In this formalism the invariant properties of personality are parameterized by the variant ones, which are measured, and classification is seen as inverse to measurement. Rather than proving theorems, the article has two goals: to provide engineers with a recipe for solving classification problems; and to bring the concept of moving frames from differential geometry into a broader discussion of classification.
Keywords: Reference frame, best fit, fiber bundle, shape recognition, meaning recognition.
1.
Introduction
Classification is a process for sorting data into a finite set of categories. How to automate the process of classification is very important in today’s computing environment where commercial websites classify customers, search engines classify relevance, news aggregators classify story contents, and in many other app
Available online: http://edupediapublications.org/journals/index.php/IJR/ P a g e | 1289
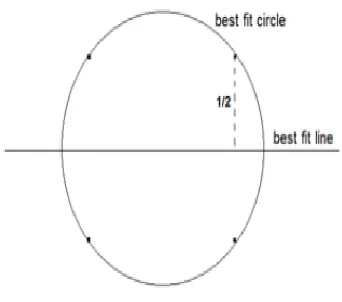
methods include: Bayesian Analysis1; Neural Nets; K-Mean Clustering; and others. By contrast, analytic or a priori method of classification relies on pre-built classifiers, designed into a computer program from the beginning. These methods have been very effective for specific engineering application. For example: Template Matching is used in Optical Character Recognition [3]; Matched Mask detection is used in Speech Recognition [4]; and the ”Rubber-Mask” technique [5] is used in acoustics and might be adapted to a variety of applications. Here, we review an a priori approach called”Best Model” classification. The name is chosen to contrast with the idea of ”best fit”, where a single type of idealized object, or model, like a regression line, is used as a substitute for data. In practice, other models can be used to fit the same data and sometimes provide a better fit. So data that is to be fit with a regression line might also be fit with a circle, a parabola, or some other geometric object and, in that context, the best model classification simply chooses the ideal object with the best ”goodness of fit”. Figure 1 shows a best-fit regression line and best-fit circle, given four data points. Since the circle has an average distance of 0 from the data and
the line has an average distance of ➼, the circle
is closer to the data and a better fit than the line. The circle is the best of the two.
Fig 1: Four data points can be fit perfectly with a circle but the best fit regression line has an
average error of ➼. The circle is a better model.
Available online: http://edupediapublications.org/journals/index.php/IJR/ P a g e | 1290
and hyperbolas to point sets. The authors describe an application where manufactured parts are classified according to which of the two idealized objects (ellipse or hyperbola) is a better fit to cross-section measurements of the part. Their article focuses on fitting methods for ellipses and hyperbolas and not on the of this type of choice. Here we wish to articulate the general nature of this type of choice. We will draw an analogy between geometric reference frames and the more intuitive frames of reference involving recognition, memory and association such as discussed by George Lakoff in [7]. It is hoped this analogy can be a guide in many non-geometric classification problems. Bernard Widrow captured some important ideas in his article [5]. It is hoped the ideas are brought forward here with new ones from differential geometry and an emphasis on the role of measurement in this type of classification.
2.
Related Work
2.1 An Example of Best Model Classification Detecting Gender of a Distant Figure:
General Considerations And Preliminary Choice of Models
Following a best model approach to a particular classification problem may not be easy, because the algorithm designer must themselves create or learn the models to implement the classification. To illustrate the respective roles of measurement, models, and goodness of fit, let us consider how they might apply to a problem in image analysis, ignoring image manipulation details. (Concepts of edge detection, metrology, and image manipulation can be found in Mat Lab documentation; in the National Institute of
Standards and Technology (NIST)
documentation; or in a variety of textbooks on Image Processing).
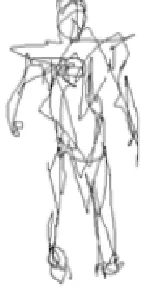
Suppose an imaging system that converts a distant moving object to a blurry squiggly line, as in Fig. 2, and we point this ’camera’ at a figure approaching along the beach and produce an image. Is it a man or a woman?
Available online: http://edupediapublications.org/journals/index.php/IJR/ P a g e | 1291
We will measure height and width of this object at the shoulders. Those will be the ”variants” of the shape. For the ”invariants” we have two simple model shapes, one representing woman the other man. Allow them to be scalable by height (H) and width at the shoulders (respectively W1 and W2) as shown in Fig. 3.
Fig 3: Scalable model shapes, or stencils, parameterized by width and height. ”Woman” on left, ”Man” on the right.
Call these model entities stencils (similar to ”Rubber Masks” [5]). With these stencils we are ready to classify the data by following these steps:
Step-By-Step Algorithm
Step 1 Measure the squiggly line ”image” of the approaching. Measure the height (h ) and width (w) at the shoulders as in Fig. 4. Measure the center (c) as in terms of the midpoints of these spans.
Step 2 Taking these measurements as parameter values, we set the stencil dimensions
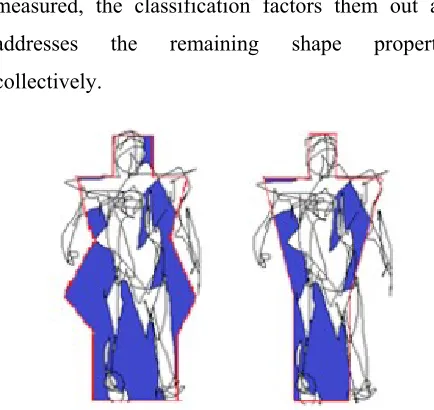
accordingly: with H=h, W1=w, W2=w and centered over the image. We center each stencil, in turn, over the image, as in Fig. 5. Note that when the ”Woman” stencil is scaled to match the data at the shoulder, its head and hips are scaled to be correspondingly wider.
Step 3 Calculate goodness of fit by some method that uses the entire stencil and entire figure.
Available online: http://edupediapublications.org/journals/index.php/IJR/ P a g e | 1292
Fig. 5: The stencils can be aligned with the squiggly line, by matching height, width at shoulder, and center.
Figure 6 illustrates the failure of overlap in dark blue. The reader can imagine some method for quantifying goodness of fit between the scaled and aligned stencils and the squiggly line representing the distant figure for example using the area of dark blue regions. Although height, width, and center are measured, the classification factors them out and addresses the remaining shape properties collectively.
Fig. 6: Dark blue highlights the lack of overlap. The ”Man” stencil on the right has better overlap or ”goodness of fit”.
3.
Implementation
3.1 Moving Frames, Fiber Bundles
And Classification
Definition Of Moving Frames, Fiber Bundles, And Fibration:
Available online: http://edupediapublications.org/journals/index.php/IJR/ P a g e | 1293
mapping from B to E that maps a parameter value b up to a point in the fiber over b is called a section. Thus a section g : B → E is a local inverse of the projection, such that p(g(b)) = b. Sections are expected to be continuous and, when it makes sense, differentiable.
Summary
Sections can be defined by attaching moving frames to parameterized objects
Local geometry of the underlying object is captured in terms of sections namely in terms of local inverses of a many-to-one mapping.
Fig. 7: A standard illustration of a vector bundle (or fiber bundle) includes a total space E, a base space B of parameters, and a projection p(). The inverse image of a parameter b is called the fiber over b. Local inverses of the projection are called sections.
A fiber bundle is more general than a vector bundle, with fibers that can be of any type, not just vector spaces. The idea of attaching frames,
defining sections, and using the sections to characterize geometry remains the same. So we propose fiber bundles and moving frames as a formalism for capturing personality, not just in geometry but in general.
3.2
Classification
Inverts
Measurement:
Available online: http://edupediapublications.org/journals/index.php/IJR/ P a g e | 1294
changes during a posteriori tabulation of new instances of the data.
4.
Experimental Work
4.1 Large-Scale Experiments on
ILSVRC2010:
We report our results using the ILSVRC 2010 subset of ImageNet that contains 1K classes. Results. We provide a comparison of the OVR, MUL, RNK, and WAR SVMs. We do not report detailed results as on the fine-grained data sets, as conclusions are very similar, see [5] for detailed experiments on ILSVRC 2010. We report results for the 4K-dimensional BOVs and 130Kdimensional FVs, see Table 8. We observe that the conclusions drawn from the smaller fine-grained data sets are still valid. First, rebalancing the positives and negatives is important in the case of OVR for low-dimensional training samples. Second, w-OVR is a competitive strategy despite its theoretical suboptimality compared to the ranking objective functions. Third, for high-dimensional FV features all methods perform similarly. The difference between the best and worst performing methods is 0.5 percent at top-1 and 2.8 percent at top-5
5.
Conclusion
Available online: http://edupediapublications.org/journals/index.php/IJR/ P a g e | 1295
available to the sense of touch we feel a slippery surface and shift the object to get a better grip. It seems natural to analyze this as a sequence of measure/best model/measure/best model/ -type actions; which can be described by a tree diagram. Using best models to analyze hand positions assumes they are discrete as a set of ideal ”grip patterns” [11] with continuous parameters determined by perceived dimension. For example, my fingers and opposed thumb form a ”C” shape with a variable span determined by the estimated size of a cup I will grasp. Or, index and first finger are opposed to thumb in a different basic grip pattern used to pick up a pen. A different set of parameters are allowed to vary as determined by the perceived dimensions of the pen. Etc. Thus the best model approach has specific, testable assumptions when applied to hand positions. These are different than the assumption found in some literature, that treat hand positions within a single continuous ”vector space” defined by variable and independent finger positions. See, for example [12].
6. References
[1] S. Boucheron, O. Bosquet, G. Lugosi, Theory of Classification: A Survey of Some Recent Advances. ESAIM: Probability and Statistics, 2005.
[2] J. Langford, Tutorial on Practical Prediction Theory for Classification, Journal of Machine Learning Research, Vol. 6, pp. 273-306, 2005. [3] T. Mahalakshmi, R. Muthaiah, and P. Swaminathan, An Overview of Template Matching Technique in Image Processing, Research Journal of Applied Sciences, Engineering and Technology, Vol. 4, No. 24, December 15, 2012.
[4] P. Green, Missing Links between Hearing and Automatic Speech Recognition, Retrieved from
http://staffwww.dcs.shef.ac.uk/people/P.Green/i naug2 files/v3 document.htm
[5] B. Widrow, The ”Rubber-Mask” Technique II. Pattern Storage and Recognition, Pattern Recognition, Vol. 5, pp. 199-211, 1973.
[6] P. O’Leary and P. Zsombor-Murray, Direct and specific least-square fitting of hyperbola and ellipses, Journal of Electronic Imaging, Vol. 13, No. 3, July 2004, pp. 492503.
[7] G. Lakoff, George Lakoff on Embodied Cognition and Language, YouTube video by Central European University, Retrieved from https://www.youtube.com/watch?v=XWYaoAoi jdQ, 2008.
Available online: http://edupediapublications.org/journals/index.php/IJR/ P a g e | 1296
par la methode du repere mobile, Paris: Gauthier-Villars, 1937.
[9] H. Weyl, Invariants, Duke Math. Journal, Vol. 5, No. 3, 1939. pp. 489-502.
[10] L. Fan, P. Santago, W. Riley, D.M. Herrington, An adaptive template-matching method and its application to the boundary detection of brachial artery ultrasound scans, Ultrasound Med. Biol., Vol. 27, No. 3, March 2001, pp. 399-408.
[11] Bebionic, 14 Grip Patterns, Retrieved from http://bebionic.com/the hand/grip patterns [12] M. Ciocarlie, P. Allen, Hand Posture Subspaces for Dexterous Robotic Grasping, The International
Journal of Robotics Research, Retrieved from
http://graphics.cs.cmu.edu/nsp/course/16-899/papers/AllenGraspingSubspaces.pdf, 2009.
[13] B.F. Skinner, Science and Human Behavior, 1953.
[14] R.W. Sperry, Neurology and the mind-brain problem, American Scientist, Vol. 40, 1952, pp. 291- 312.
Available online: http://edupediapublications.org/journals/index.php/IJR/ P a g e | 1297 Authors Profiles
Shaheen Layaq
M.Sc(IS),M.Phil,M.Tech,APSET,B.Ed Lecturer in Computer Science
Singareni Collieries Women’s Degree & P.G College
Kothagudem , Khammam (District) Telangana(State)
Email : [email protected]
RAMESH D, M. Tech (CS), (PhD), Asst. Professor
Dept of Computer Science, Kakatiya University, Warangal, TG-India.
Email: [email protected]
V Redya,
B.E,MTECH,(PhD) Asst. Professor
This is Redya Working as a HOD in the department of CSE in