BY
WDLLIAM BRIAN ELDER
A thesis submitted in fulfilment of the requirement for the Degree of Master of Engineering
DEPARTMENT OF CIVDL AND BUILDING ENGINEERING
VICTORIA UNIVERSITY OF TECHNOLOGY
MELBOURNE, AUSTRALIA
30001004466951
Elder, William
Brian
Food grains that have been cooled can be stored for prolonged periods. This is because the rate of
population increase of insect pests can be slowed, seed viability is maintained, dry matter loss is
reduced and the persistence of chemical pesticides can be improved.
This thesis reports the development of a mathematical model of ventilated grain stores that enables
optimal cooling strategies to be identified and developed. The model describes heat and mass
transfer in t w o dimensions and it enables heat and mass transfer phenomena that occur in the
boundary layers of grain stores to be examined in detail. This is achieved by first establishing the air
flow distribution in the grain, and then solving the equations that govern heat and moisture transfer.
It is believed that this represents an advance on models previously available. In addition to the
physical phenomena, the model accounts for biological and chemical phenomena that occur in grain
stores.
The thesis also describes the development and operation of commercial mobile refrigerated grain
cooling units that have been developed by the candidate. The mathematical model is used to
determine the optimum strategy for moving the commercial grain cooler from one aeration duct to
the other. T h e objective function is the number of insects in the grain bulk, although other measures
such as seed viability and pesticide residue are also examined. Experiments were conducted on a
commercially operated shed type store to validate the model using a commercial instrumentation
system also developed by the candidate. T h e research shows that the optimum strategy is different
I am grateful to Victoria University of Technology, Melbourne for a Postgraduate Scholarship which
enabled me to undertake this research, and to Associate Professor Graham Thorpe for his
encouragement, guidance and support throughout the tenure. Various members of the staff of the
University and fellow students have assisted with their advice and opinions, particularly when
converting programs from BASIC to FORTRAN. The investment made by McBea Grain Protection
Services, Melbourne in providing facilities and releasing me for two years to concentrate on the
development of this control system research is appreciated, as is the support and encouragement of
my wife Jean, and her tolerance in shouldering additional business responsibilities on behalf of
McBea. Thanks are due to my younger son Murray for assistance in sourcing references on
continued fractions and outlining the number theory involved. Permission to make measurements in
the 1500 tonne bulk of barley owned by G & C Cornell, Lockhart, NSW during the progress of a
grain cooling contract is gratefully acknowledged. Overseas manufacturers of grain silo cooling
equipment have granted permission to copy their commercial literature and relevant exerpts are
included in Appendix 5.
WB Elder
VOLUME 1
Page
Abstract n
Acknowledgements m
Table of contents iv
Nomenclature m
List of Figures x
List of Tables ™
Chapter 1 - Introduction
1.1 Background ' 1.2 Literature review 1
1.3 Supporting papers 2
1.4 Objectives 3
Chapter 2 - Mathematical model
2.1 Resistance to air flow 6 2.2 Heat and moisture exchange 6
2.3 Dry matter loss and respiration heat 9
2.4 Germination loss 10 2.5 Growth of grain infesting insect populations 12
2.6 Breakdown of grain protectants 13
2.7 Climatic data 1 5
2.8 Grain cooler characteristics
2.8.1 Refrigeration system performance 15
2.8.2 Air flow characteristic 17
Chapter 3 - Numerical solution of equations
3.1 Matrix equations 19 3.2 The computational grid 2 2
3.3 The computer program 25
3.4 Data input 2 5
Chapter 4 - Development of commercial grain coolers
4.1 Background 2 7 4.2 Computer control 30 4.3 M c B e a mobile grain coolers
4.4 Cooling a grain shed
5.1 Introduction 43 5.2 Duct layout 43 5.3 Airflow 44 5.4 Operation of mobile commercial grain cooler
5.4.1 Experiment and prediction 45 5.4.2 Minimising insect numbers
5.4.2.1 Commercially constrained operation 48 5.4.2.2 A m o r e efficient cooling operation 50 5.4.2.3 Influence of species on optimum operation 54
5.4.3 Locating potential problems 56 5.4.4 Minimising other quality losses 56
5.4.5 Long-term effects 61 5.5 Minimising the cost of protection 61
Chapter 6 - Limitations of the model
6.1 Introduction 71 6.2 Two-dimensional constraint 71
6.3 Floor duct 72 6.4 Horizontal floor 72
6.5 Heat conduction through floor ignored 73
6.6 Heat liberated by insects 73 6.7 Buoyancy effects not included
6.7.1 Effects within the grain bulk 75 6.7.2 Effects above the grain surface 76 6.8 Store surface coating not included 76 6.9 Air supply duct resistance not included 77
6.10 Linear resistance characteristic 77 6.11 Isotropic resistance to air flow 78 6.12 Crudeness of climatic model 78 Chapter 7 - Conclusions 79
References 82
Appendix 1 - Supporting papers 88
Appendix 2 - A paper printed with permission including the effects of
respiration on the performance of ventilated bulks of grain 114
Appendix 3 - M c B e a grain cooling commercial literature 130 Appendix 4 - M c B e a deep probe wet-bulb temperature system literature 155
Appendix 5 - Overseas grain cooler manufacturers' literature 160
VOLUME 2
Appendix 6 - List of variables in computer program 168
Appendix 7 - Fortan 77 program listing 179
For list of variables' names used in Fortran program see Appendix 5
Upper case
An numerator of continued fraction
B coefficient for rate of increase in insect population Bn denominator of continued fraction
C concentration of pesticide, kg/kg of grain
C0 initial concentration of pesticide, kg/kg of grain
Cj a coefficient for determining loss of viability C2 a coefficient for determining loss of viability
Hw heat of sorption of water into seed, J/kg
K^ effective thermal conductivity of bulk, W m ^ K1 Ka coefficient for standard deviation of seed viability
Kv seed specific constant for determining loss of viability
MM moisture modifier for calculating dry matter loss
MT temperature modifier for calculating dry matter loss
N number of insects
N0 initial number of insects in the grain bulk
P static pressure at outlet of M c B e a Mobile Grain Cooler, P a Q air flow through M c B e a Mobile Grain Cooler, m3/s
Qr calorific value of seed oxidised, J/kg
R coefficient of resistance to air flow, P a s nr2 T grain temperature, °C
TmA instantaneous ambient temperature, ° C
T amplitude of diurnal swing in ambient temperature, K
TIMX wet-bulb temperature corresponding to m a x i m u m rate of insect population growth, °C
Tmem m e a n atmospheric air temperature, °C
TWamb ambient wet-bulb temperature, ° C
TW(mt wet-bulb temperature of air leaving M c B e a Mobile Grain Cooler, ° C
V germination of seed bulk (living seeds : total) V0 initial germination (viability) of seed bulk
W moisture content of seed (dry basis), kg/kg
Lower case
b rate coefficient for increase in insect population
c threshold wet-bulb temperature of increase in insect population, ° C Cj specific heat of water b o u n d in seed, J k g ^ K1
c2 specific heat of seed, J kg^K'
1 ca specific heat of air, J k g ^ K
1
c., a seed specific coefficient in the equation for integral heat of wetting
cn a seed specific coefficient in the equation for integral heat of wetting
cj3 a seed specific coefficient in the equation for integral heat of wetting
ci4 a seed specific coefficient in the equation for integral heat of wetting
c.s a seed specific coefficient in the equation for integral heat of wetting
cxl coefficient in expression for temperature gradient at a node cx2 coefficient in expression for temperature gradient at a node cx3 coefficient in expression for temperature gradient at a node
cx4 coefficient in expression for rate of change of temperature gradient at a node cx5 coefficient in expression for rate of change of temperature gradient at a node cx6 coefficient in expression for rate of change of temperature gradient at a node cyl coefficient associated with convection vertically
cy2 coefficient associated with convection vertically cy3 coefficient associated with convection vertically
hv latent heat of vaporisation of free water, J/kg
hx distance between nodes in the x direction, m k time constant for germination loss
k0 known value of £ at a given temperature or moisture content
m mass of bulk oxidised, kg
m moisture content of seed (% wet basis) - equation 2.9 p air pressure, Pa
p half-life of seed - equations 2.9 and 2.10 qn largest integer less than an
r relative humidity of intergranular air rn remainder (o:n-qn )
rm intrinsic rate of increase in insect population
t time, s
t} half-life of pesticide, weeks
2
teq equivalent temperature for calculating dry matter loss, °C u face air velocity in the horizontal direction, m/s
v face air velocity in the vertical direction, m/s v face air velocity vector, m/s
w moisture content of intergranular air, kg/kg of dry air x x co-ordinate
Greek
a
0 ratio of duct offset from centre to width of bulk less boundary layers and duct widths
ea void fraction of bulk material
<|); volume specific enthalpy of seed, J m^K 1
§2 volume specific enthalpy associated with bound water in seed and convection, J m^K"
ty3 change in enthalpy resulting from conduction, combustion and evaporation of
water, J m^K1
<|>¥ a coefficient in moisture conservation equation
<J>5 a coefficient associated with convection §6 a coefficient associated with dry matter loss
pfl density of air, kg/m 3
pCT density of seed material, kg/m 3
o standard deviation
Subscripts
air
t node number in x direction j node number in y direction
v vapour r gas
Superscripts
Fig. 2.1- Cooling wheat in a 700 tonne capacity steel silo via the emptying auger tube using the high air pressure, low air temperature characteristic of a M c B e a Mobile Grain Cooler
Courtesy L G Moore Holdings, Horsham, Victoris
Fig. 2.2 - Decrease in the intrinsic rate of increase of Sitophilus oryzae (L.) above the maximum rate at the corresponding wet-bulb temperature Tm a x (Desmarchelier 1988) showing trend to
zero at a dry-bulb temperature of 33°C
Fig. 2.3 - Performance chart for McBea Mobile GrainCooler Model RM180GC relating grain store characteristics to cooling rate based on fan and compressor performance for given ambient conditions, grain temperature achieved and level of control over insect populations
Published with the permission of McBea Grain Protection Services, Melbourne
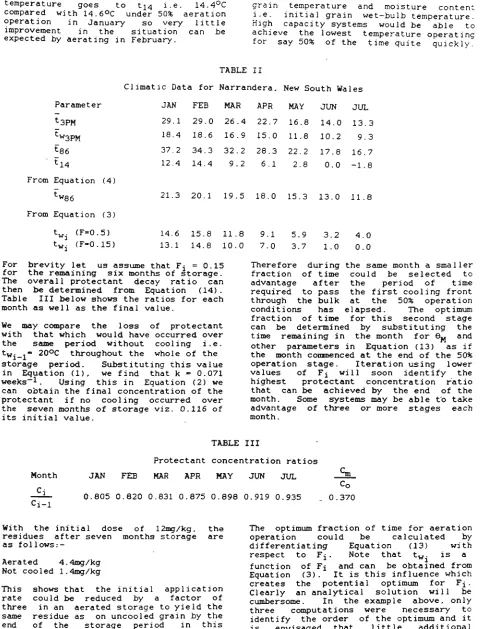
Fig. 2.4 - Stabilising the moisture content of paddy rice in a 300 tonne capacity section of a large drying and storage shed under the influence of a hot dry climate using a M c B e a Mobile
Grain Cooler supplying controlled humidity air via the large grain ventilation fan housing. The fan is switched off during this procedure
Courtesy Ricegrowers' Cooperative Limited, Leeton, New South Wales
Fig. 3.1- Scheme of nodes representing a bulk of grain or other porous media in which nodes are coincident with the sloping top surface
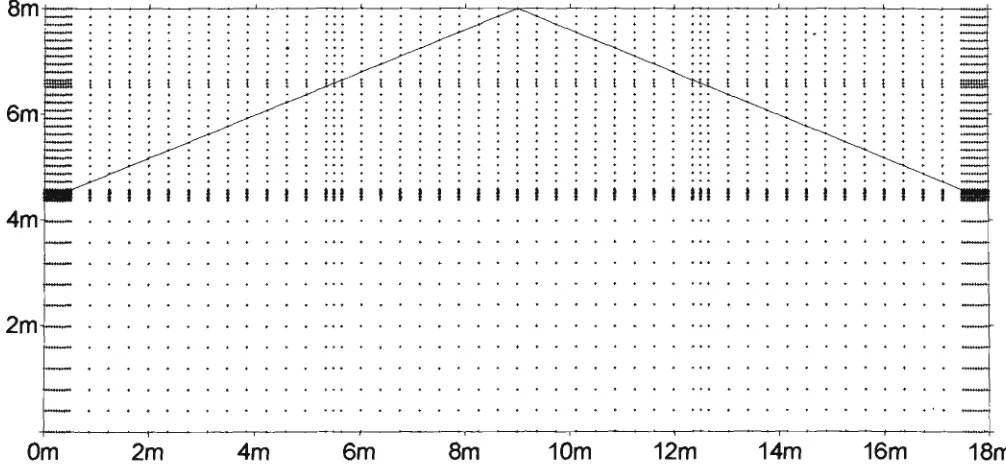
Fig 3.2 - The non-uniform mesh determined by the program from the dimensions of the shed type store simulated showing a c o m m o n node spacing for all positions deep in the bulk, unique node positions identifying the exact width and accurate location (within 5 m m ) of ducts, and closer node spacing at the walls for more accurate calculation of peripheral effects
Fig 4.1 - General assembly of McBea Mobile Grain Cooler Model RM180GC showing 20 amp connection for three-phase 415 volt power supply, chilled air outlet spigot for connecting flexible insulated ducting and the integrated roadworthy trailer providing storage for the electrical extension cable, flexible ducting, fittings and condensate drain hose
Published with the permission of McBea Grain Protection Services, Melbourne
Fig 4.2 - McBea Mobile Grain Cooler with power take-off driven 20kVA three-phase alternator for connection to an agricultural tractor, and McBea-Stanley COOLALL^"*1 for connection to
a 15 amp, 240 volt single-phase electricity supply
Courtesy McBea Grain Protection Services, Melbourne, Victoria
Fig. 4.3 - McBea Mobile Grain Cooler supplying refrigerated air via an existing aeration fan to barley in a 1500 tonne capacity shed type grain store
Courtesy Frankling Grains Pty Ltd, Barham, New South Wales
Fig. 4.4 - Maintaining the germination of seed grains in steel silos near Kununurra in the north east of Western Australia using the first production R M 1 8 0 G C M c B e a Mobile Grain Cooler
M c B e a Mobile Grain Cooler with an after-heater shown in the foreground.
Courtesy AE&EMToynton &HiltcardPty Ltd, Blaney, New South Wales
Fig. 4.6 - Maintaining the quality of undesirably moist adzuki beans in 120 tonne capacity silos using M c B e a Mobile Grain Coolers
Courtesy Buckwheat Enterprises, Parkes, New South Wales
Fig. 4.7 - Cooling wheat in a 700 tonne steel silo where three-phase power is unavailable using a McBea-Stanley COOLALLAl4RK1 single-phase grain cooler. Note the long distance from the
power point at the shearing shed in the background
Courtesy Moore Park Pastoral Company, Beulah, Victoria
Fig. 4.8 - Perforated metal aeration ducting with strenghtening cross bracing rods protruding to inhibit movement of the duct w h e n placed horizontally on the floor to the spigot shown
Courtesy G&C Cornell, Lockhart, New South Wales
Fig. 4.9 - Shed-type grain store in which measurements were made during chilling of barley using a M c B e a Mobile Grain Cooler
Courtesy G&C Cornell, Lockhart, New South Wales
Fig. 4.10 - Larger shed-type grain store showing aeration fans to which McBea Mobile Grain Coolers can be attached during the summer following harvest for chilling the stored grain
Courtesy Graincorp Limited, New South Wales
Fig. 4.11 - Components of McBea Services MSI Deep Probe Wet-bulb Temperature Measuring System showing read-out instrument connected to 1 5 m cable with associated inserting rods in carry bag and calibration cell in instrument case
Courtesy McBea Services, Melbourne, Victoria
Fig. 5.1 - Estimated wet-bulb temperature contours from December 1993 probe measurements shown in malting grade barley in a 1500 tonne capacity grain shed after thirteen days of cooling using a commercial mobile grain cooler initially connected to the left side air distribution duct. Initial grain wet-bulb temperature averaged 31°C
Fig. 5.2 - Predicted wet-bulb temperature pattern after 13 days simulated operation of the cooling plant used on the left side duct of the rural commercial grain store studied
grain borer following a 3 0 day cooling period. Initial insect population w a s 87. Cooler w a s m o v e d from the left side aeration duct to the right side of the shed-type grain store
Note: No cooling yields 2177 grain borers
Fig. 5.5 - Predicted wet-bulb temperature pattern after 15 days simulated operation of two mobile grain coolers, one o n each aeration duct of the rural commercial grain store studied
Fig. 5.6 - Predicted wet-bulb temperature pattern after an additional 15 days with no cooling showing the effects of conduction of heat near the walls and in the centre of the
grain bulk in the rural commercial grain store studied.
Fig. 5.7 - Effect of the time of relocation of a mobile grain cooler on the population of the rice weevil following a 3 0 day cooling period. Initial insect population w a s 87. Cooler w a s
m o v e d from the left side aeration duct to the right side of the shed-type grain store
Note: No cooling yields 119 rice weevils. The initial high temperature inhibits population growth, the increase in numbers occurring only at the periphery of the bulk subject to lower ambient temperatures
Fig. 5.8 - Predicted wet-bulb temperature pattern after 25 days of cooling via the left side aeration duct (top) and after an additional five days on the right side aeration duct (bottom)
-optimum cooling strategy for minimising the number of rice weevils
Fig. 5.9 - Effect of the time of relocation of a mobile grain cooler on the population of three species of grain boring insects following a 3 0 day cooling period. Initial insect population w a s 87
of each species. Cooler w a s m o v e d from the left side aeration duct to the right side of the shed-type grain store
Note: No cooling yields 2427 grain boring insects
Fig. 5.10- Portable screw-in aeration tube for spot cooling using a fan to either force air into or induce air from localised regions of a grain bulk
Courtesy Agridry Rimik Pty Ltd, Toowoomba, Queensland
Fig. 5.11 - Pattern of multiplication ratios for an initial uniformly distributed population of lesser grain borers after 3 0 days of cooling with the simulated mobile grain cooler relocated
from the left side to the right side aeration duct o n the optimum (7th) day for minimising numbers
Fig. 5.12- Pattern of multiplication ratios for an initial uniformly distributed population of rice weevils after 3 0 days of cooling with the simulated mobile grain cooler relocated from the
left side to the right side aeration duct on 7th day (not optimum for rice weevil)
Fig. 5.13 - Pattern of multiplication ratios for an initial uniformly distributed population of rice weevils after 3 0 days of cooling with the simulated mobile grain cooler relocated from the
pesticide fenitrothion following a 3 0 day cooling period. Initial concentration lmg/kg. Cooler w a s m o v e d from the left side aeration duct to the right side of the shed-type grain store
Note: N o cooling yields 0.6263 mg/kg
Fig. 5.15 - Effect of the time of relocation of a mobile grain cooler on the concentration of the pesticide bioresmethrin following a 3 0 day cooling period. Initial concentration lmg/kg. Cooler w a s m o v e d from the left side aeration duct to the right side of the shed-type grain store
Note: N o cooling yields 0.7732 mg/kg
Fig. 5.16 - Effect of the time of relocation of a mobile grain cooler on the concentration of the pesticide Chlorpyriphos methyl following a 3 0 day cooling period. Initial concentration
lmg/kg. Cooler w a s m o v e d from the left side aeration duct to the right side of the shed-type grain store
Note: N o cooling yields 0.6864 mg/kg
Fig. 5.17- Effect of the time of relocation of a mobile grain cooler on the concentration of the pesticide methacrifos following a 30 day cooling period. Initial concentration lmg/kg.
Cooler w a s m o v e d from the left side aeration duct to the right side of the shed-type grain store
Note: N o cooling yields 0.3039 mg/kg
Fig. 5.18 - Pattern after 30 days of concentrations of the pesticide methacrifos applied initially at a rate of lmg/kg in an uncooled bulk of barley in a shed-type grain store having the same
characteristics as the grain store studied.
Fig. 5.19 - Pattern after 30 days of concentrations of the pesticide methacrifos applied initially at a rate of lmg/kg w h e n a bulk of barley in a shed-type grain store having the same
characteristics as the grain store studied is cooled by a commercial mobile grain cooler connected initially for 7 days to the left side aeration duct and thereafter to the right side
Fig. 5.20 - Pattern of relative humidities (water activity) of the intergranular air in the bulk of barley simulated after 3 0 days of cooling by a commercial mobile grain cooler supplying chilled
air for 13 days to the left side aeration duct, then 17 days to the right
Fig. 5.21 - Grain temperature patterns after 13days (top) of cooling by a commercial mobile grain cooler supplying chilled air via the left side aeration duct to the bulk of barly simulated,
and after an additional 17 days (bottom) via the right side duct
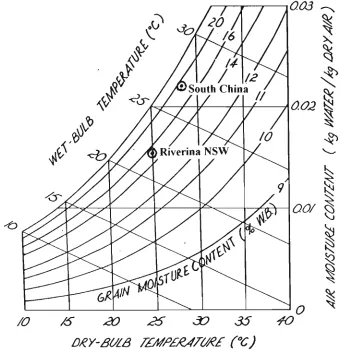
Fig. 6.1 - Increase in the number of lesser grain borers in selected 0.5m thick zones and within lm of the peak during cooling of the grain store simulated using the optimum day to m o v e a
bulks using M c B e a Services M S I Deep Probe Grain Wet-bulb Temperature Measuring System to identify the progress and completion of cooling by a M c B e a Mobile Grain Cooler. Horizontal lines show the threshold wet-bulb temperatures for multiplication of three grain infesting insects of concern to the operator, and the wet-bulb temperatures at which the populations would double in a w e e k
Reproduced with the permission of McBea Grain Protection Services, Melbourne
Fig. A4.1 - Pamphlet describing instrument developed by Novasina, Switzerland with McBea deep probe system for measuring intergranular air wet-bulb temperature and other important
quality control parameters
Fig. A4.2 - Reverse side of pamphlet in Fig. A4.1 showing a calculator designed by the candidate to determine intergranular wet-bulb temperature from grain temperature and moisture
Fig. A4.3 - Price list which also shows relevance of MSI Deep Probe readings on factors which lead to quality loss. System shown being used for chilled wheat in a 1100 tonne sealed silo
Courtesy G J Godde and Sons Pty Ltd, Culcairn, New South Wales
Fig. A5.1 - Description of grain cooling process. Temperature differences apply to European conditions where grain moistures are m u c h higher than they are in Australia
Courtesy PM LUFT AB, Kvdnum, Sweden
Fig. A5.2 - Swedish grain cooler and quality control benefit data for respiring stored grain
Courtesy PM LUFT AB, Kvdnum, Sweden
Fig. A5.3 - German grain cooler at end of shed-type grain store and important design factors for an efficient air distributions ducting system
Courtesy Sulzer-Escher Wyss GMBH, Lindau, FR Germany
Fig. A5.4 - Examples of various German grain coolers on shed-type grain stores
2.1 Coefficients for calculating the integral heat of wetting for a number of grains
2.2 Equivalent maize moisture contents for a number of other grains for calculating dry matter loss resulting from respiration
2.3 Coefficients for determining the loss of viability of a number of seeds
2.4 Rate of population increase coefficients and threshold wet-bulb temperatures for a number of grain infesting insects ranked by threshold value
2.5 Decay coefficients for chemical pesticides applied to stored grain
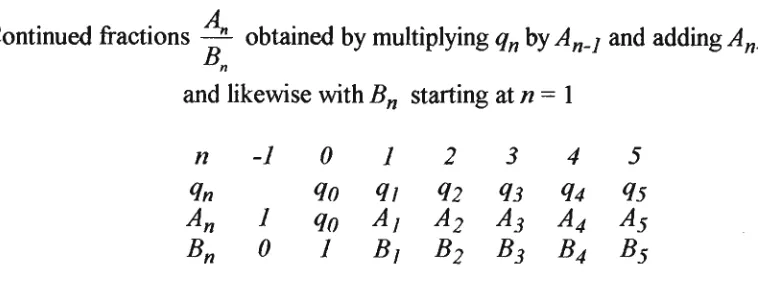
3.1 Continued fractions calculation table layout
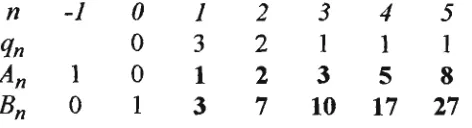
3.2 Continued fractions for selecting equidistant node spacings for an adequate level of accuracy of the model's duct position to the duct location in the grain store simulated for determining
CHAPTER 1
1. INTRODUCTION
1.1. BACKGROUND
When bulk grains are cooled their quality is maintained and damage by insects and other agents of
loss is suppressed. Controllers for systems which pass naturally occurring atmospheric air through
the bulk take various forms from time-switches to sophisticated feed-back devices. Mobile
refrigeration plant is becoming more popular for decreasing the grain temperature more quickly than
can be achieved with atmospheric air. The installation of a feed-back loop from a silo to mobile
plant presents m a n y practical problems especially w h e n the plant is hired and the various silos in
which the sensing equipment is fitted and the mobile plant are owned by different parties. Sufficient
is n o w k n o w n about heat and moisture transfer processes in bulk grain for a realistic mathematical
model of two-dimensional bulks to be formulated, thus there is an opportunity to eliminate the need
for feed-back connections T h e initial condition of the grain can be input from measurements of
temperature and moisture content taken on delivery or once in storage. T h e subsequent changes in
bulk temperature and moisture content can be deterrnined from the k n o w n performance
characteristics of the cooling plant, biological activity models and measured ambient conditions.
1.2 LITERATURE REVIEW
Grain cooling systems are used in many countries where grain is stored in bulk. Evidence of
ventilation systems for grain stores exists in archaeological diggings in Egypt. Early w o r k in the
United States of America on grain cooling using naturally occurring atmospheric air (aeration) w a s
outlined by H o l m a n (1966) and various aspects of the process have been studied since by such
workers as Burgess and Burrell (1964), Griffiths (1967), Brooker (1969), Elder (1972,1990 and
1992), Ingram (1979), Sutherland et al (1971 and 1983), Williams and Elder (1979), Thorpe et al
Noyes et al (1994). Developments in aeration using chilled or refrigerated air have been reported by
Sutherland et al (1970), Navarro et al (1973a and b), Donahaye et al (1974), Brunner (1980), Baldo
and Brunner (1983), Elder and Ghaly (1983), Hellemar (1993) and Maier (1994).
Control of grain cooling systems using naturally occurring atmospheric air is traditionally by means
of a high and low limit thermostat and a high limit humidistat switching the aeration fans. Such
systems have been available from the George A Rolfes Company, Boone, Iowa, U S A and Foss ( A N )
of Denmark. Operators measure the progress of cooling by means of either permanently installed
thermocouple cables or portable probes with a read-out instrument and adjust the high limit
thermostat accordingly. A method of charting to assist operators interpret the large number of
temperature readings taken and to identify and respond correctly to the progress of cooling fronts
was presented by Elder (1971). Charts of the temperature profile are used by Cargill Australia Ltd,
particularly for checking the cooling of oilseeds. S o m e controllers act on the temperature feed-back
signal and such systems have been available from James Watt Electrical in Australia, Eldar in Israel
and Foss. The performance of different control methods has been simulated by J W Sutherland
(unpublished) and reported by Elder (1984). The time-proportioning control method (Elder, 1972)
was shown to have the best performance. A programmable aeration controller involving remote
monitoring is under development by Gibbs (1994) and computer control of aeration based on
climatic data and feed-back signals is described by W u and Li (1994). There do not appear to be any
grain cooling controllers which depend on predictions of changing conditions in the bulk for
feed-back.
1.3 SUPPORTING PAPERS
Recent papers by the candidate which highlight the potential for optimising grain quality parameters
w h e n bulk grain is cooled by through flow of air are reproduced with permission in Appendix 1. The
first (Elder, 1992) derives an analytical solution for the minimisation of the loss of pesticide applied
to the stored grain at intake w h e n aerated using time-proportioning control (Elder, 1972) to select
cooling fan which yields the m i n i m u m breakdown of the insecticide can be calculated for each month
of operation in a specified climate. T h e second paper (Elder and Thorpe, 1994) illustrates the use of
a numerical model for predicting the cooling patterns generated by through flow of refrigerated air in
a shed type grain store in south-eastern Australia and a tall cylindrical silo in southern China, and the
resultant potential for grain infesting insect population growth throughout the bulk. T h e numerical
analysis treatment takes into account heat transfer by conduction from outside through the silo walls
which w a s not considered in the former analytical solution for minimising the loss of pesticide.
1.4 OBJECTIVES
The general objective of this research is the development and validation of a numerical model of the
cooling of bulk grain and associated processes, and to demonstrate its application to:
(i) devising cooling plant operational strategies which minimise effects of agents of quality loss; and
(ii) optimising air distribution duct layout design and the control of the cooling air flow to minimise
the cost of protecting the food from deterioration and loss in value.
The research is to target specific objectives in an ordered sequence as
follows:-• Develop a two-dimensional numerical mathematical model of a bulk of respiring grain
involving heat, moisture and m o m e n t u m transfer. T h e bulk is subject to an air pressure
gradient from air distribution ducting on the floor of the grain store to the grain surface, a
cyclical ambient temperature, biological deterioration of the seeds and associated heating,
grain infesting insect population growth and chemical breakdown of pesticides that m a y be
applied to the grain. T h e model is to be capable of determining in detail the temperature and
moisture gradients close to the surfaces of the grain bulk which is exposed to the cyclical
ambient conditions, and around the air distribution ducting. A non-uniform grid pattern of
nodes is to be used to facilitate such detail without invoking an unnecessarily large number
of calculations where detail is not required deep in the bulk. A novel feature of the research
is the use of continued fractions (Davenport, 1968) to determine automatically the
air distribution ducting so as to free operators of the model, or of an industrial controller
based on the model, from the need to understand the setting up of an appropriate node grid
pattern.
• Describe a commercially available mobile air chilling unit developed by the candidate for
cooling bulk-stored grain, and determine mathematical models of its performance for
interaction with the heat, mass and m o m e n t u m transfer characteristics of the numerical
model of ventilated bulk grain to be developed.
• Carry out experiments in a rural grain store using a commercially available grain temperature
and humidity probe system developed by the candidate to validate the model.
• Conduct numerical experiments involving the interaction between the commercial grain
cooler and grain store to identify optimum cooling strategies to minimise the potential for
insect infestation.
• Examine the potential for novel treatment of duct layout designs facilitated by the model.
• Foreshadow the use of the model in a microprocessor-based controller which automatically
varies the air flow through a commercial grain cooling system to minimise the loss of grain
quality or other index of commercial loss.
• Signal the opportunities afforded by the model to minimise the over all cost of protecting
bulk-stored grain.
The model applies to two dimensional systems that are characteristic of shed type grain stores which
represent approximately 6 0 % of Australia's grain storage capacity.
The ultimate goal is to design and build a controller for optimising the operation of any grain cooling
system. T h e present w o r k has in mind grain aeration systems using naturally occurring atmospheric
air and mobile grain refrigeration plant; however, the mathematical model will not necessarily be
limited to these t w o types. For example, the operation of a system in which the atmospheric air,
before entering the grain bulk, is dried using a desiccant as described by Ismail (1987) could be
parameters. A n objective of the design of the controller should be to m a k e use of the ever increasing
speed and capacity of personal computers (PCs) combined with their decreasing cost and physical
size, rather than adopt the more sophisticated industrial programmable logic controllers (PLCs)
which are now commercially available. The almost universal adoption of PCs by the general
community, even in remote areas where grain cooling systems may be installed, represents a good
reason for developing a controller based on this technology rather than the traditional PLCs used
generally in process industries in major centres. It seems probable that the new generation of plant
service technicians is more likely to be competent in the operation of PCs than in the diverse range of
CHAPTER 2
2. MATHEMATICAL MODEL
2.1 RESISTANCE TO AIR FLOW
The present model assumes that the resistance to air flow is proportional to the local velocity of the
air, and that the resistance coefficient is isotropic. This may be expressed as
Vp = -Rv 2.1
in which v is the face velocity of the air or the air volume flux (m3 s-1 nr2), and R is a resistance
coefficient. Hunter (1983) presents values ofR for 28 different grains and seeds. Hunter also gives coefficients for an additional term S |v| v as in the work of Ergun (1952) which accounts for the
departure from a linear pressure-flow relationship. This second term becomes significant at higher
intergranular air velocities than would normally be encountered in grain aeration systems. Any
refinement of the model may include this effect so that it can deal more accurately with extraordinary
circumstances encountered in industry such as the recent refrigeration of a 700 tonne silo of wheat
via the emptying auger tube (Fig. 2.1) where the air velocities in the region of the air entry will be
sufficiently high to affect the calculation of the pressure drop across the grain bulk. In this study w e
are concerned with the effect of the velocity distribution on the stored grain ecosystem, and Hunter (1983) reports that omitting the additional term S|v| v has little effect on the velocity field.
2.2 HEAT AND MOISTURE EXCHANGE
Much of the past work on heat and mass transfer during ventilation of bulk grain assumes that the
seeds are inert hygroscopic particles. This model however includes the effect of respiration of the
seeds involving the liberation of heat and additional gases (carbon dioxide and water vapour) that
mix with the ventilating air altering its speed, and the removal of oxygen from the ventilating air. To
assumptions to derive the thermal energy equation which follows. The derivation is detailed in
Appendix 2 in which the symbols are defined.
The first term represents the net rate of increase in enthalpy per unit volume, the second the heat
associated with the change in state of bound water to vapour. The third term accounts for the
binding energy of the water in the grain which is oxidised into non solids as a consequence of
respiration processes. The final term on the left hand side of the above equation represents the
difference between the flow of heat in and out of a specific volume of the bulk resulting from
convection of all the gasses including those generated by respiration. The terms on the right hand
side represent respectively heat conduction, the heat of combustion of dry matter and the associated
heat of vaporisation of the water produced. The calorific value of substrate material Qr used is
15 778kJ/kg.
The moisture balance on an elementary region of the grain bulk is expressed as
e0Pa—+pav.Vw= eaPa — (1 +1.66^) 2.3
„H« a Ha of a ^ \ /
The terms denote the rate of accumulation of water, the effect of convection of moisture in and out,
and the water produced as a result of respiration.
The integral heat of wetting for a given moisture content is given by Thorpe et al (1990) as
follows:-f (hv-hs)dW = (cn + caW+ci3W2 + ci4W3 +ci5W4)hv 2.4
where the coefficients for a number of grains are shown in Table 2.1, and hs is the heat of sorption
Fig. 2.1- Cooling wheat in a 700 tonne capacity steel silo via the emptying auger tube using the high air pressure, low air temperature characteristic of a McB e a Mobile Grain Cooler
Courtesy L G Moore Holdings, Horsham, Victoria
TABLE 2.1
Coefficients for calculating the integral heat of wetting for a number of grains
Grain Barley Canola Peanuts Sorghum Sunflower Wheat
Cil
-0.26249 -0.22976 -0.30395 -0.17662 -0.27797 -0.21133
c«2 4.6097 10.5894
7.4899 5.1872 12.6731 4.7403
Ci3
-0.00910 -0.01706 -0.07120 -0.06118 -0.04931 -0.03483
ci4 1.2485 2.4416 3.9970 4.2819 4.4794 2.6210
Ci5
2.3 D R Y M A T T E R L O S S A N D R E S P I R A T I O N H E A T
The dry matter loss calculated in the model is based on the respiration of maize reported by
Thompson (1972). F r o m this work, the rate of loss of dry matter has been reported by Thorpe
(1994) in the following
form:-^p = { 14.72 x IO"10 exp(l.667 x \0~\ -1) + 2.833 x IO9} /(MMMT) 2.5
where the temperature modifier M~ is calculated using three moisture ranges namely below 19% (dry
basis), from 19 to 2 8 % , and above 2 8 % , and based on the deviation from 15.5°C (60°F) as described
in detail by Thorpe (1986). The moisture modifier MM applies over the full temperature range
studied.
It is assumed for the time being that this model of dry matter loss will be adequate for other grains.
The respiration of moist bulks is likely to be dominated by the respiration of micro flora attacking the
seeds. Researchers in this science such as Gibson et al (1994b) and M a g a n and Baxter (1994) use
water activity as a measure of the growth of moulds suggesting that their response is governed more
by the equilibrium relative humidity of the air at the surface of the seeds (water activity) than by the
overall water content of the bulk, m u c h of which m a y be inaccessible to moulds. It is therefore
possible that the model of dry matter loss would be more accurate for other seeds if the equivalent
maize moisture content w a s used, ie. the maize moisture which will generate the same equilibrium
relative humidity as the other seed at its moisture content. S o m e approximate equivalent values are
given in Table 2.2. For the model, it m a y be preferable to later derive an expression for dry matter
loss in terms of intergranular relative humidity which m a y be calculated from the grain type, moisture
content and temperature. A recent paper by Lacey et al (1994) reports oxygen consumption for
wheat at equilibrium relative humidities from 80-95%, and compares it with the rates for barley,
canola (rapeseed) and linseed at 25°C with water activity held between 0.88 and 0.90. This and
T A B L E 2.2
Equivalent maize moisture contents for a number of other grains
Seed Canola Peanuts Sorghum Sunflower Wheat Moisture content % wet basis
10 13 16 10 13 16 14 16 18 10 13 16 14 18 22 Maize equivalent moisture content
% wet basis 19 22 26 15 22 26 17 24 28 18 22 27 17 19 28
2.4 G E R M I N A T I O N L O S S
The loss of germination of different seeds is not a simple function of temperature and moisture.
However, a general rule based on work by Banks (1992) for barley states that for every 4 kelvin
decrease in temperature, the life of the seed over the range of c o m m o n moisture contents is doubled.
Banks (1992) also indicates that a 1 % decrease in moisture content of the malting barley studied
increases seed life by a factor of three. The general relationship m a y be expressed as
follows:-where Vis the germination after time t seconds, and VQ is the initial germination. Given a k n o w n
value of the time constant k at a certain temperature, its value at other temperatures can be
Temperature
modification:-k is a function of temperature T(and moisture content). From the above rule, as t is doubled, modification:-k must
halve for a given V/VQ. N o w / doubles for every 4 K drop in temperature, thus k must halve for every
4 K drop. Thus, if the value of k (k0) is k n o w n at one temperature T0, its value at a n e w temperature Tj will be as
follows:-k = follows:-k0x2^
4
J 2.7
Similarly, the moisture modification
is:-* = is:-*ix 3 , W < * - * > 2.8
The total change in viability is obtained by treating each effect in turn.
More precise modelling of viability is provided by Roberts (1960) and Roberts and Abdalla(1968)
using equations of the following
form:-\ogp = Kv-Clm-C2T 2.9
where/? is the half life of the seed in weeks,
m and Tare respectively the seed moisture content (%) and temperature (°C), and Kv ,Cj and C2 are coefficients for a specific seed
and
o = Kap 2.10
where a is the standard deviation of the frequency of deaths against time, and
K_ is a constant for a specific seed
The coefficients for some seeds are shown in Table 2.3
The model uses the above equations of Roberts and Abdalla (1968). The coefficients in Table 2.3
are for the half viability expressed in weeks. In the computer program, Kv is converted for
T A B L E 2.3
Coefficients for deterniining the loss of viability of a number of seeds (Source:- Roberts and Abdalla, 1968)
Seed Barley
Broad beans Peas
Wheat
* . 6.745 5.766 6.432 4.222
c>
0.172 0.139 0.158 0.108
c,
0.075 0.056 0.065 0.050
Z-0.301 0.379 0.384 0.350
2.5 G R O W T H O F G R A I N I N F E S T I N G I N S E C T P O P U L A T I O N S
Desmarchelier (1988) has shown that the intrinsic rates, rm of population growth of eight species of
stored-product Coleoptera are linearly related to the intergranular wet-bulb temperature, Tw. This
may be expressed mathematically as
rm=b(Tw-c) 2.11
where b and c are species specific constants which are shown for number of insects in Table 2.4.
The objective in cooling grain is to bring the intergranular wet-bulb temperature below c, the
threshold value to stop multiplication. For values of Tw below c, the value of rm is taken as zero.
The number, N, of insects after a time, t, is thus given by
N=N0exp(rmt) 2.12
b
or* -1
MVB 0.034 0.073 0.018 0.122 0.0435 0.048
c
threshold ° C W B
17.6 16.4 14.0 13.9 13.0 9.8
T A B L E 2.4
Rate of population increase coefficients and threshold wet-bulb temperatures for a number of grain infesting insects ranked by threshold value
(Source:- Desmarchelier, 1988)
Insect
Tribolium castaneum (Herbst) Oryzaephilus surinamensis (L.) Oryzae zea-mais Motschulski Lasioderma serricorne (F.) Rhyzopertha dominica (F.) Sitophilus oryzae (L.)
At high grain temperatures, the rate of increase of some species of grain infesting insects reaches a
maximum defined by Desmarchelier (1988) at a wet-bulb temperature 7^, and then declines as the
temperature increases further. The data for rm above 7^ presented by Desmarchelier (1988) for
Sitophilus oryzae (L.) when plotted on a psychrometric chart (Fig. 2.2) show that rm goes to zero at
a dry-bulb temperature of about 33°C. It is obvious that the decline in rm is not a simple function of
any psychrometric property of the intergranular air. As a compromise, the model puts rm for Sitophilus species at zero above 32°C dry-bulb.
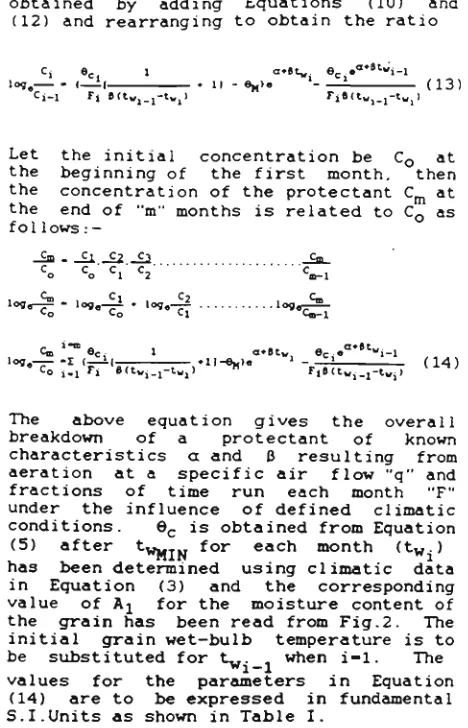
2 6 BREAKDOWN OF GRAIN PROTECTANTS
The loss of pesticide concentration has been related by Desmarchelier and Bengston (1979) to the
temperature Tand the relative humidity r of the intergranular air and is expressed as
f \
-1.386rt »10*( r~3 0 )
C
— = exp
^ 0
V i J
2.13
in which the coefficient B and t1/z (the half-life) are specific to each compound. The model includes
20 25 30
DRY BULB TEMPERATURE °C
20 ENTHALPY (h) kJ/kg
35
40
30
Fig. 2.2 - Decrease in the intrinsic rate of increase of Sitophilus oryzae (L.) above the m a x i m u m rate at the corresponding wet-bulb temperature Tmax (Desmarchelier 1988) showing trend to
T A B L E 2.5
Decay coefficients for chemical pesticides applied to stored grain
Pesticide
Bioresmethrin ioresmethrin + pip.but.
Chlorpyrifos-methyl Fenitrothion Methacrifos
Half-life (weeks)
24 38 19 14 8
B
(per degree C ) 0.033 0.031
0.04 0.036 0.055
2.7 C L I M A T I C D A T A
The mean daily temperature and humidity for each month under consideration is used with a sinusoid
superimposed having an amplitude representing the mean diurnal swing. This is the condition of the
air entering the grain cooler.
( 2nt \
Tan* = Tmean + Tamp S 1\ ^ f J * 2 4 J 2'1 4
where time t is in seconds
The necessary data for sites throughout Australia and some neighbouring islands are given by Bureau
of Meteorology (1988).
2.8 GRAIN COOLER CHARACTERISTICS
2.8.1 REFRIGERATION SYSTEM PERFORMANCE
The thermal performance of the M°Bea Mobile Grain Cooler is shown in Fig. 2.3 and has been
modelled as
follows:-0045/35-7' ^
TWM = 167Q
3
COEFFICIENT O F RESISTANCE T O AIR F L O W (R)
Alfalfa Barley Clean ear c o m Flax Linseed Lupin seed Maize Oats Pea beans Peanuts in shell Rapeseed Rough rice Safftower Sorghum Soybeans Sunflower Wheat 7% 12*, 16% 11% 7.9% 7.5% 12.4% 13% 15% 4.4% 5.7% 13% 5.9% 13% 10% 7.9% 11%
1 6 3 1 8 Pa.s.m 1 6 7 6
6.19 10421 14907 512 719 1816 435 29.0 7097 1952 1 207 2664 646 1 593 3131 2
APPROXIMATE P R E S S U R E O F AIR IN D U C T AT RATED F L O W (400L/S)
Silo door area served by duct = A Height of grain above duct = H Length of air distribution duct = L
1800
STATIC P R E S S U R E
(Pa) P = 0.4
<5-2L Pa
Add 2 0 % for compaction Allow 200Pa for losses
All distances in metres
COOLING RATE D E P E N D S O N AIR F L O W A N D CLIMATIC CONDITIONS CONDENSING CIRCUIT PERFORMANCE
WET-BULB T E M P E R A T U R E
O F AIR ENTERING
C O O L E R CC)
0 10 20 C O O L E R EXIT AIR WET-BULB T E M P E R A T U R E (°C)
M) 20 10
n
/,i
inm h' / or y I-ICIMS iHTHiK. ERATIMC 200Us ^s**y^ \ 300-400-1 .'\\rT O N N E S PER 24 H O U R S
0 200 400 AIR F L O W (L/s)
GRAIN COOLING CAPACITY
600
unl-BULa isc
200 400 AIR F L O W (L/S)
CAPACITY CORRECTION FACTOR
600
GRAIN T E M P E R A T U R E P R O D U C E D
This graph based on data for Australian wheat For other grains refer to supplier or C S I R O _ '\
25
DEDUCT "C" FROM EXIT AIR WET-BULB TEMPERATURE
GRAIN CC) AT COMPLETION OF COOLING 20 15 10 5 0
0 10 20 C O O L E R EXIT AIR WET-BULB T E M P E R A T U R E (°C)
FINAL GRAIN TEMPERATURE DEPENDS ON MOISTURE CONTENT GRAIN INFESTING INSECT POPULATION GROWTH
Insects, including those resistant to insecticides, multiply rapidly in hot grain
2.0+
W E E K L Y MULTIPLICATION
RATIO
WET-BULB T E M P E R A T U R E O F AIR B E T W E E N GRAINS (°C) (if
W E T - B U L B T E M P E R A T U R E : •
The wet-bulb temperature of air m a y be measured by wrapping a piece of muslin or similar around a thermometer bulb, and allowing the air to circulate over the bulb to evaporate the water. This evaporation cools the thermometer bulb to a temperature which eventually stabilises at s o m e value below the air temperature. The wet-bulb temperature of the air between the seeds of a bulk of grain is a very good quality control index for the rates of germination loss, chemical protectant breakdown and Insect population growth.
c. McBea Services, 2 Gilbert Court, Parkdale Victoria 3195, Australia
C = 45
{*&
T=Ambient dry-bulb temperature ( X ) , Q=Air flow (L/s)
Example
Silo diameter 1 4 m Floor area 1 5 4 m2
Grain height 1 5 m Duct length 5 m Grain typewheat (R=3131)
Average wet-bulb temperature of air entering Cooler 2 0 X
Estimate of air pressure in duct at rated flow
(400L/s):-P = 0.4.3131-(^f+5y = 247Pa
Add 20% for compaction: 0.2*247 = 49 Pa
Allow 200Pa for supply duct losses: 203 Fa
Air pressure at Cooler connection 4 9 6 P a (400L/S)
On JAir Flow Performance"
graph.-Mark 496Pa point on 40OL/S verticle line Draw a line from zero through this point to the curve W h e r e sloping line meets curve, read Air Flow (50OUs)
This is the actual air flow through the system Draw a verticle line from this point to the bottom graph On "Condensing Circuit Performance"
graph:-Draw a horizontal line from 2 0 X (Wet-bulb of entenng air) to the SOOL/s sloping line (Actual air flow)
Draw a verticle line from this intersection down to the bottom graph axis (Wet-bulb of air between grains)
Note Cooler's Exit Air Wet-bulb Temperature (10.5X)
On "Grain Cooling Capacity" graph:- „,.„.,_ .„ *.r
Using actual air flow (verticle line drawn from top graph), estimate 10.5 o
between 1 0 and 15* wet-bulb lines . . „ „ * , D r a w a horizontal line from this point to Tonnes/24 hours Grain Cooling Capacity
(60 tonnes/day)
capacity Correction Factor: The temperature (dry-bulb) of the outside *; *« "™» effect on the Cooler's Exit Air Wet-bulb Temperature. T h e Exit Air Wet-bulb will be lower if the outside air is less than 3 5 X . T h e number of degrees lower can be calculated from the formula given for "C".
tf L
M<
5
° C , then T
Wmt= 5°C representing the action of the automatic anti-freeze-up control
signified by the discontinuity in the condensing circuit performance curves in Fig. 2.3. T h e first four
terms represent the influence of air flow on the temperature drop across the refrigerant evaporator.
The curves for different air flows are substantially parallel and provide a simple conversion from
input to output air wet-bulb temperature as seen in the fifth term of equation 2.15. The last term is
an ambient temperature dependent capacity correction factor to account for operation away from the
ambient conditions at which the plant is specified, namely 35°C.
2.8.2 AIR FLOW CHARACTERISTIC
The refrigeration system performance depends on the air flow Q (m
3/s) through the Cooler which is
dependent on the resistance offered by the grain bulk and ducting system, plus any controls varying
the air flow to meet certain criteria. The Cooler's fan/coil/filter characteristic as shown in Fig. 2.3 is
represented by the following
polynomial:-P = 1000(3.330
3- 9Q
2+1.970 +1.54) 2.16
where P is the static pressure in pascals at the outlet of the Cooler.
The air flow performance curve shown in Fig. 2.3 can be seen to approximate a parabola which was
tried initially; however, the cubic equation above was found to more accurately model the Cooler's
fan characteristic.
Separate allowances need to be m a d e for supply duct losses and as these will be different in almost
every case this effect has not been included in the modelling. These losses are usually very small by
comparison with the loss through the grain and therefore they have very little effect on the Cooler's
performance. W h e r e the connecting duct w o r k includes a large fan as shown in Fig. 2.4, the transfer
of heat through the steel casing will be significant w h e n the ambient temperature is high. Conduction
of heat into sub-floor air distribution ducting as discussed in Section 6.5 will also influence the
condition of the air entering the grain.
Fig. 2.4 - Stabilising the moisture content of paddy rice in a 300 tonne capacity section of a large drying and storage shed under the influence of a hot dry climate using a McB e a Mobile Grain Cooler supplying controlled humidity air via the large grain ventilation fan housing. T h e aeration fan is switched off during this procedure
CHAPTER 3
3. NUMERICAL SOLUTION OF EQUATIONS
3.1 MATRIX EQUATIONS
The thermal energy and mass conservation equations are solved by expressing them in finite
difference form. The domain of interest is divided into a non-uniform mesh as shown in Fig. 3.1.
Instabilities in the numerical solution are avoided by expressing derivatives involving convection as
upwind differences (Patankar and Spalding, 1970), ie.
Wj^j-Tuj if
w>
03.1
dx hx\i)
and W= T
u-Ti-ij tfw<0 32
dx hx\i -1)
This can be expressed as
^ = crl(i)£
w+cx2(i)T
iJ+cx3(i)T
i+1J3.3
where cxl(i), cx2(i) and cx3(i)assume values appropriate to the direction of the local flow. Second
derivatives with respect to x, say, may be expressed as
&T
dx
2cx4(i)T,-
hj +cx5(i)T
u+cx6(i)T
i+lJ3.4
as described by Graham et al (1994). A forward difference scheme is used for the derivatives with
respect to time, ie,
?L
=yi—ti± 3.5
* — f — "
hx(i-l)
1 > — 4 >
»-• • *
HI
hx(i)
J^
hy(j)
WH)
J ^
K
• < » — •
- • — < i — < < • • — i « • — i
Fig. 3.1- Scheme of nodes representing a bulk of grain or other porous substance in which nodes are coincident with the sloping top surface
O m 2 m 4 m 6 m 8 m 10m 12m 14m 16m 18m
Using these finite difference approximations, the thermal energy conservation equation may be
written in the form
jrp+ 1 _ J,P
At
where #, = p.sj^c_)
o+ (
Cl)W
+^
^ — Kp^ — P.^l h
sdW
{ Pa\ ca + * (fc)r + (c2)v)]} { u {cx\Tt_, + cx2T + cx3Ti+l)+ v(cylT^ + cy2T+ cy3TJ+1)}
^
3= ^{cx47;_
1+cx5r+
Cx67;
+1+cv47;_
1+cy5 + cy67;
+1}
„ dm
n^ , dm
in which the absence of a subscript or superscript implies w e are considering the (i j ) * node at the
pto time step
ie. 23 s T
Tp = T
i+hj ~ i+l
and T£
x= T**
yThe updated temperature of the (ij)* node is thus calculated from
T^^T+Atfa-fc)/^ 3.7
The discretized form of the moisture conservation equation is
W
p+1-W
p<r>4 T T -*" 4>5 = 4>6 3*8
A t
where $
4= p
(T£
<Tbs - Pa {
u(
cxl
wi-1 + cx2w + cx3w
i+j J + v (cy lw^, + cy2w + cy3w
j+1)\
. dm
'• = "-*--a
The pressure distribution in the grain bulk was found by solving Laplace's equation using the
Alternating Direction Implicit method (Peaceman and Rachford, 1955).
3.2 THE COMPUTATIONAL GRID
The number of nodes selected for the mathematical model depends on the order of accuracy
required, and in this respect the selection is somewhat arbitrary. However, in practical systems it is
necessary to ensure that nodes coincide with actual physical features such as a cooling air inlet duct,
a steel door in a concrete wall or a tunnel, or other feature which will influence the behaviour of the
cooling process. O n e method of locating these features is to introduce non-uniform node spacing.
This has been done in the present work as shown in Fig. 3.1 to more accurately determine peripheral
effects within 0.5m from the surface of the bulk particularly where heat enters through the wall. The
remaining internal space can be divided into larger modules to reduce the number of calculations to
be processed. Where there are multiple air inlet ducts, some of these will be off-set from the
centreline of the bulk and their position must correspond to a node. For uniform node spacing
between the ducts and boundary layers therefore, a rational number as close as possible to the ratio
of duct location to net width of the internal space (after deducting the widths of the ducts) must be
determined. This is achieved using the following continued fractions described by Davenport (1968)
and summarised by Selkirk (1991).
Let a be the real number ratio representing the distance from the boundary to the duct and the bulk
width, and q be the largest integer less than a.
Then a
0= q^r
0where r denotes the remainder. 3.10
If r=0 then calculation finished.
If r±0, ci0 = ^0+-rr- 3.11
r
0Let ay = \
ThuSCt0=<70+
a 1
1
^0+ — f - 3.12
qy
LA
etc
The continued fraction form of a is [qo>a],<l2> •••]
To obtain rational approximations for a, define A_x =1, A0= q0, An = q„An_x + An_2
5 . = 0 , B0 = l, Bn=qnBn_x+B„_2
Rational numbers — for a choice of number of node spacings to duct and across the bulk are
B
n
shown by completing the Table 3.1
below:-TABLE 3.1
Continued fractions — obtained by multiplying q„ by An_j and adding An 2
B
n
and likewise with B„ starting at n = 1
n -1 0 1 2 3 4 5
a
n IO al a2 a3 a4 <l5 A„ 1 q0 A, A2 A3 A4 A5 Bn 0 1 Bj B2 B3 B4 B5
The choice will be determined by the speed and memory limitations of the micro-computer
employed. Where the model incorporates a boundary layer at the walls with fixed node spacing, and
a duct or ducts with a finite width, the dimensions of these and other features must be deducted from
the bulk width to determine the length to be evenly divided by the above procedure.
Example:- In the grain store simulated, the two aeration ducts were 300mm wide and offset 3.5m
each side of the centreline, the store being at total of 18m wide. Using the model's programmed
boundary layer of 0.5m in from each side wall, the space remaining to be divided into equal node
spacings is 16.4m. The distance from the inner edge of the boundary layer to the outer edge of the
q0 = 0. Using the reciprocal of the remainder, a ; becomes 3.381443 yielding qt = 3, thence a2 is
2.621622 yielding q2- 2 and so on as shown in Table 3.2
TABLE 3.2
Continued fractions for selecting equidistant node spacings for an adequate level of accuracy of the model's duct position to the duct locations in the grain store simulated
n -1 0 12 3 4 5
q„ 0 3 2 1 1 1
A„ 1 0 1 2 3 5 8 B„ 0 1 3 7 10 17 27
The bold quotients represent progressively more accurate approximations to the decimal fraction
specified by the dimensions of the grain store. The actual matrix selected by the program is shown in
Fig. 3.2 in which the duct position is only 5mm different from the actual duct locations. The quotient used is the next one in the above Table, namely — resulting in 69 nodes in the x direction
44
after the duct and boundary layer nodes are added to the denominator plus the node at x = 0. In the
computer program, the spacing of the nodes in the y direction is made approximately equal to the
spacing of the x nodes determined by the above procedure; however, if there is some feature in the
vertical direction such as a steel access door or an emptying conveyor between the floor and the
grain surface, continued fractions could again be determined for an appropriate y node spacing to
locate most accurately within computational limits the discontinuity in thermal conductivity up the
wall of the grain store. Above the intercept of the grain surface with the wall of the grain store, the
spacing of the nodes in the y direction is determined by the angle of repose of the bulk so that nodes
coincide with the top surface of the grain. As angles of repose of most materials are less than 45°,
this procedure has the advantage of providing automatically closer node spacing in the peak region
of the bulk which is most vulnerable to heating and loss of quality control. This effect can be seen in
Fig. 3.2.
Continued fractions have been used previously by the candidate in the cutting of helical gears on a
accurate combination of a limited selection of change gears connecting the mandrel rotating the gear
blank to be machined and the w o r k table feed screw. T h e decimal to approximate is a function of the
relative leads of the work table feed screw and of the helix of the gear to be cut. Continued fractions
can also be used to obtain rational numbers approximating n.
3.3 THE COMPUTER PROGRAM
The program is written in Fortran 77. Appendix 6 defines the variables. The listing in Appendix 7
consists of the main program for heat and mass transfer calculations with numerous subroutines for
input data manipulation, physical, chemical and biological properties of the interacting components
and for determining the air pressure distribution. Subroutines included for speeding up the
convergence of the pressure field were introduced w h e n the program w a s written in QBasic; but as
the calculation n o w takes only about five minutes, these are no longer called. A complete list of the
subroutines is given in Appendix 8. C o m m o n variables are compiled in a file listed in Appendix 9.
3.4 DATA INPUT
When mobile grain cooling plant is relocated to a different climatic region and applied to stores of
different dimensions containing different types of grains, the relevant information about the n e w
situation must be supplied to the mathematical model or the plant controller using the model to
optimise operation. T h e operator must also provide initial temperatures, moisture contents, pesticide
concentrations (if any), the quantity or height of grain and the month in which the plant is started.
Where there are multiple ducts, the duct receiving chilled air must be identified. It is envisaged that,
with further development, the input of data will be accomplished using a P C which will generate an
input data file on a removable disk for transfer to the cooling plant controller or computer being used
for optimisation studies. In the case of a cooling plant controller, this same disk would also
accumulate predicted cooling data for later transmission to a centre for analysis and comparison with
an input data file is provided for the above variables, and basic data for moist air, a number of grains,
insects and pesticides, and cooling plant characteristics are contained in relevant subroutines.
The main dimensions of the grain store, the aeration ducting and the properties of the grain bulk are
entered o n a file s h o w n in Appendix 10. Climatic data are also entered together with the initial
temperature, moisture and germination of the grain. T h e initial insect density is assumed to be 1 per
tonne, and initial pesticide concentration lmg/kg. If desired, other values m a y be inserted in the
relevant subroutines.
Program control variables and loop specifiers are also entered in the data input file. The time steps
"dt" and "dtg" m a y need to be decreased if instability or numerical data processing errors occur; but
this will inevitably increase program execution time. T h e re-activation and appropriate editing of the
instability detecting subroutines m a y be required to keep execution time within practical limits.
Cooling plant identification and control data are also included in the data input file, and currently
provide for u p to five different air flows for a specified period entering each aeration duct. In the
simulation of the barley shed store with t w o aeration ducts, the R M 1 8 0 G C M ^ e a Mobile Grain
Cooler model is invoked with its rated air flow of 4 0 0 L/s into one duct, whilst zero flow is specified
for the other. W h e n the number of days for the initial cooling run has been reached, eg. the 7 day
optimum to minimise numbers of the lesser grain borer, the chilled air flow is transferred to the other
duct with zero flow imposed at the first duct and the n e w pressure field determined before
continuing with the heat and mass transfer calculations. T h e file also provides for an air flow