Defect Identification in Concrete Using Active
Thermography Technique
V.K.Divya
1, K.Sivasubramanian
2, D.Suji
3P.G. Student, Department of Civil Engineering, Adithya Institute of Technology, Coimbatore, India1
Senior Scientist, CSIR-Structural Engineering Research Centre, Chennai, India2
Professor and Head, Department of Civil Engineering, Adithya Institute of Technology, Coimbatore, India 3
ABSTRACT: Thermography technique relies on variation in temperature to identify inhomogeneities in the test
medium. Infrared thermography is a non-destructive testing method being used for the detection of shallow depth defects in concrete structures. Infrared thermography technique relies on the infrared rays emitted by the test object to assess its surface temperature. In the present work, the recent research works on infrared thermography technique are reviewed in detail. Later, the possibility of employing thermocouple sensors to identify defects in concrete is explored. Towards this, an experiment is conducted to assess temperature variations in a concrete block of size 0.40.40.15 m. The block is cast with a defect of size 0.10.10.05 m. For the identification of the defect using the thermography technique, the characteristics of the heating source play an important role. Hence, it is proposed to explore the influence of two heating sources on the non-destructive evaluation process. The oven heating and solar heating are considered in the present study. While the oven heating simulates an ideal source with uniform heating of the test surface, the solar heating is uncontrolled. Thus, the influence of these two heating sources on the interpretation of the data for the non-destructive evaluation is discussed in detail. The encouraging results inspire further research on the thermography technique.
KEYWORDS:active thermography, non-destructive testing, defect identification, thermocouple, oven, solar heating
I. INTRODUCTION
In the recent years, the application of Non-destructive Testing (NDT) methods for identification of defects is becoming more popular. Many NDT methods are presently available, such as impact-echo method, ultrasonic pulse echo, ground penetrating radar and infrared thermography. Of these, the first three techniques work based on wave propagation. The characteristics of the reflected wave are used for the evaluation of the concrete properties or the location of the defects. These methods are useful in the identification of internal voids, honeycombs, delaminations, cracks and other subsurface defects [1]. Recently, the infrared thermography technique is gaining popularity for moisture detection and shallow depth defect identification.
Infrared thermography technique (IRT) relies on the variation in the temperature caused by the presence of air packets in concrete. This information is used for the identification of defects. This method uses the infrared rays emitted by the investigated object to assess its temperature gradient on the surface of the test object / specimen [2]. An infrared camera is used for capturing the infrared rays from the object. The data is then processed into a thermogram revealing the temperature variations on the assessed face of the test object [3]. The non-contact nature of this technique makes it an attractive option for non-destructive testing. Also, while other methods collect data at a series of points to evaluate a structure, the infrared thermography technique is capable of monitoring the temperature variations on an area at every time instant [4]. Thus, the IRT method has the characteristics of an efficient non-destructive testing method.
boards, transformers and investigation of equipment reliability [5, 6]; and monitoring molten slag in iron and steel factories [7,8]. On the other hand, the second IRT method uses an external heat source on the test object for the evaluation process. For the non-destructive evaluation in concrete components, the active IRT method is being used [9-12].
In the IRT method, the collection of data could be carried out faster as an area is scanned at any instant. However, as concrete is a poor thermal conductor and a large amount of heat is required to produce an observable variation in temperature in the thermogram. This constrains the wide spread acceptance and application of the IRT method for the non-destructive testing and evaluation in concrete structures. In addition, the higher cost of the equipment restrains wide spread research and application.
Hence, the present work proposes to review the recent research activities using the infrared thermography technique and thus explore the possibilities and limitations in its application for concrete structures. Later, an experiment is planned for the first time in India to investigate the applicability of thermography technique to civil engineering applications. As, the infrared thermography equipments are very costly, it is proposed to carry out defect identification in the laboratory using thermocouples as sensors. It is also proposed to investigate the efficacy of two heating sources for possible defect identification in concrete specimens.
II. REVIEWOFLITERATURES
In concrete structures, IRT is being popularly employed for detection of shallow depth delamination [10, 11]. Further, research on the applicability of infrared thermography for civil engineering applications is being recently pursued [12]. Research in the recent past, have led to the detection of defects in pavements [13], embankment deterioration [14] and non-destructive testing in concrete [15, 16]. However, in India, limited research or application of this method has been observed from the publications.
Maierhofer and Brink [1] performed an experimental investigation to detect voids in concrete structures using impulse thermography and radar techniques. For this purpose, a concrete specimen of size 1.5x1.5x0.5 m was cast. In the specimen, they created eight voids by using polystyrene blocks of sizes 0.2x0.2x0.1 cm and 0.1x0.1x0.1 cm four each. The investigation was performed after a year of concreting using both radar and thermographic techniques. The heating unit used here consisted of three infrared radiators, each having a power of 2400W. The difference between temperature transient curves above sound regions and inhomogeneities provided the information about the location of defects.
Sakagami and kubo [10] developed a new processing technique to evaluate delamination defects in concrete structures based on phase delay measurement using lock-in thermography. Experimental program was carried out on a concrete block specimen of width 1m, height 1m and depth 0.3m. Square shaped polystyrene foam sheets were embedded in the specimen to simulate delamination. The heating was done through quartz lamp heater and an infrared camera was used to capture images of the specimen. It was found that the location and size of defect can be estimated from the contrast change and that the depth can be estimated from the relationship between phase delay and heating period.
Simoes and Tadeu [2] reported the experimental applicability of Infrared thermography in detection of defects embedded in mortar specimens. The temperature patterns were compared with numerical results. Two specimens were cast by coating a steel cylinder with mortar. Internal defects were created between the mortar and steel core by inserting a rubber thread when the specimen was cast. Tests were performed using IR video camera. Numerical simulation was also employed to evaluate the heat diffusion in the systems. The comparison between numerical and experimental results showed that the numerical model can adequately simulate the heat diffusion phenomenon.
thermography method was used to transform the collected data from time domain to frequency domain and the results were obtained as phase grams and ampligrams. From the results, it was concluded that the method of pulse phase thermography (PPT) for post-processing of thermogram sequences can be used to detect defects in reinforced concrete samples.
Gailius and Zukauskas [17] performed investigations to find the relationship between percentage of damage and temperature variation caused by it. Three specimens for every percentage of damage were used for the determination of the temperature. Heating was done in the same direction as loading. Experimental investigations showed that different percentage of damage in concrete produced different thermal properties. Results of the experiments showed that infrared spectrum analysis can be used in the assessment of early stages of concrete damage. Experimental data showed that relationship between damages and temperature distribution in concrete specimen exist, and further investigations on this property of concrete can be useful for non-destructive technique evaluation and in future can be a precise method for non-destructive testing in concrete.Henryk and Lukasz [18] used active thermography to test a model of the concrete wall with the material inclusions with significantly different thermal properties. A wall made of concrete blocks with material inclusions was used in this study. The study performed in climatic chambers consisted of heating the model wall with a 7.2 kW heat pulse, and then recording the thermograms during wall cooling, at regular intervals, using a thermal imaging camera. To identify the size and depth of the material of the inclusions in the wall by active thermography in reflective mode was necessary to use a mathematical model describing the relationship between the time-spatial distribution of the diagnostic output and the diagnostic signal.Inspired by the recent research works on Infrared Thermography (IRT), the present work proposes to investigate the possibility of defect identification in concrete for the first time in the country. Towards this, it is proposed to use the thermocouple sensors. The thermocouple sensors have earlier been used in assessing concrete in retaining walls for monitoring temperature raise [19] and to assess microwave heating of concrete specimens [20]. The present work proposed to apply thermocouple sensors for defect identification in concrete in the laboratory.
III. EXPERIMENTALINVESTIGATION
3.1 EXPERIMENTAL PROGRAM
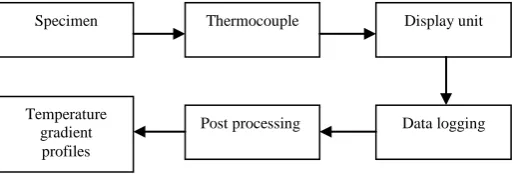
The experimental program involves the casting of the specimen, configuring the position of the sensors, thermal display unit, data logging, post-processing and interpretation of the results. The flow-chart of the experimental program is shown in Fig. 1. In this work, a concrete specimen is cast with a predefined defect. As the present work proposes to use the thermocouples as sensors, it is proposed to adopt equally spaced sensor locations for this investigation. It is also proposed to ensure good bond between the sensing tip and the specimen surface to obtain correct temperature values. Also, the efficacy of the sensors is tested before the start of the experiment. During the experiment, the data is logged at a regular time interval for all sensor positions. This data is then post -processed for identification of the defect location.
Fig. 1. Flow-chart of the experimental thermography investigation
3.2 SPECIMEN DETAILS
The review of the state-of-the-art literature on infrared thermography inspired an experimental study on its applicability to civil engineering applications. This being the first of its kind study, it is proposed to investigate the applicability of two heat sources for defect identification using thermography technique. In the present work, the
Specimen Thermocouple Display unit
Data logging Post processing
specimen has been cast with a M30 concrete. The concrete mix has been cast based on the recommendations of IS:10262-2009 [21]. The mix ratio used for making the concrete is 1:2.03:3.88 with a water-cement ratio of 0.5. The 28th day average cube compressive strength of the concrete has been found to be 43.8 MPa. The concrete specimen has been cast with a size of 0.40.40.15 m. A polystyrene of size 0.10.10.05 m has been placed in the specimen to simulate the defect. Fig. 2 shows the casting of the specimen with a predefined defect. The defect has been placed at mid-width and mid-breadth of the specimen during casting. The defect is placed such that its top surface is 50 mm from the top of the specimen.
Fig. 2. Casting of the specimen
3.3 THERMOCOUPLE SENSORS
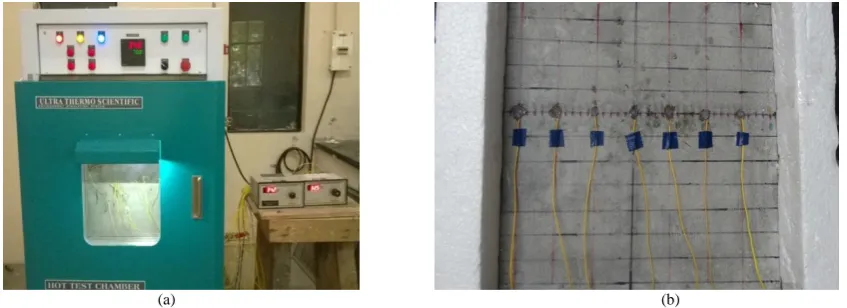
The present study focuses on identifying the defects in concrete by determining the temperature variation on the concrete surface. This is achieved by using the thermocouples as sensors to measure the temperature. Thermocouples are one of the commonly used sensors to measure temperature. They are relatively inexpensive yet accurate sensors that can operate over a wide range of temperatures. A thermocouple is created whenever two dissimilar metals touch at one end, and are measured at the other. The thermocouple used in this study is shown in Fig. 3 (a). By creating a small open circuit voltage as a function of temperature difference between contact point and the measurement point of metals, the temperature at the thermocouple tip can be assessed. The sensing end and open end for applying voltage are observable in Fig. 3 (a). Care needs to be taken to ensure good contact between the sensor tip and the specimen surface. Through this, it can be ensured that the temperature on the specimen surface is transferred to the sensing tip, thus ensuring the logging of temperature values.
The temperature value measured by the thermocouple is displayed by a Digital Temperature indicator. Fig. 3 (b) shows the temperature indicator with 12 channels. The selection of channels is done through rotary switch arrangement. The open end of the sensors is connected to each of the channel, as shown in Fig. 3 (c). The cost of sensor and logging device is very low when compared with infrared thermography equipment. This encourages the wide spread usage of the technique for research applications.
(a) (b) (c)
Fig. 3. Digital temperature indicator used for monitoring the temperature values (a) Typical thermocouple (b) Temperature indicator (c) Channels with connected sensors
3.4 PREPARATION OF SPECIMEN
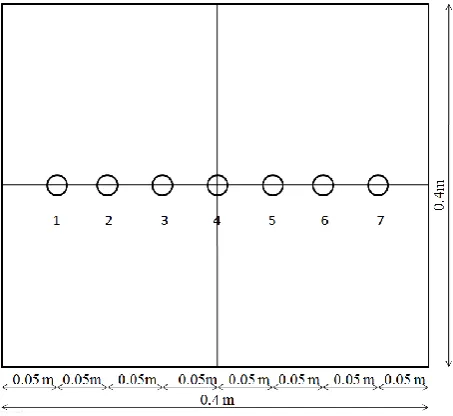
right side of the specimen about the midpoint, as shown in Fig. 4. In order to place the sensors, the specimen surface is cleared of dirt and then smoothened. On the smoothened surface of the specimen, the sensing junction of the thermocouple is placed. Care is taken to ensure good contact between the sensor and the specimen. Then, the sensor is pasted on the specimen using adhesive. The adhesive used here is Araldite. The other end of thermocouple which consists of two open ends is connected to the digital temperature indicator. The positive terminal of thermocouple should be connected to the positive slot of temperature indicator and the negative terminal to the negative slot.
Fig. 4. Layout showing distribution of sensors
IV. METHODOLOGY
A thermography investigation is greatly influenced by the ability of the heating source to uniformly heat the test surface at a constant temperature. Hence, the present work investigates the applicability of two heat sources for conducting non-destructive evaluation in concrete. Firstly, the oven is considered as a heat source (artificial heating source). Secondly, the ambient solar heat (natural heating source) is used for the investigation. The first heat source is aimed to produce uniform heating on the test surface (top surface of the specimen) aiding in much easier identification of the defect. However, the solar heat may not produce an even heating on the test surface. Heating will be influenced by the position of the sun (referring to a particular time in a day). In both the cases, the specimen is placed parallel to the ground and its position remains unchanged with time. Through the present work, the influence of non-uniform heating on the non-destructive evaluation process is investigated.
4.1 CASE 1 – ARTIFICIAL HEATING
The first part of the study focuses on using the oven as the source of heat. The temperature range of oven used here is between room temperature and 180ºC. The oven has a space of 0.60.60.6 m to place the specimen. The specimen size is fixed keeping in mind the oven size. In this method, the specimen is heated by keeping the specimen inside an oven. Fig. 5 (a) shows the test setup used for the case 1 experiment. During the experiment, the specimen is heated on the top surface. The temperature measurement is made directly from the top surface of the concrete specimen.
nodes are recorded every 2 minutes. The oven temperature is fixed based on trial studies. Here, the aim is to conduct the experiment in about the same time as in case 2 (under solar heat). In this experiment, the specimen is heated in oven for nearly 140 minutes.
4.2 CASE 2 – NATURAL HEATING
The second case investigates the applicability of the solar heat for the non-destructive evaluation. In this method, the specimen is heated using natural solar heat. The specimen is insulated with polystyrene pieces on all the four edges, as shown in Fig. 5 (b). The edges on the top of the specimen are also insulated with polystyrene pieces to avoid rapid heating at the edges, as in Fig. 5 (b). The sensors are numbered sequentially from left to right to facilitate in recording the values.
The experiment is planned to be conducted between 11.00 and 13.00 hours in the day with the aim to heat the specimen when the sun is vertically above it, approximately. Thus, it is aimed to reduce the effect of non-uniform heating of the specimen. Next, the sensors at various nodes are connected to the digital temperature indicator sequentially. In the last channel of the temperature indicator, a sensor is connected as reference sensor to measure the ambient temperature. The specimen is kept under sunlight for about 114 minutes. The temperatures at various nodes are recorded every 2 minutes interval.
(a) (b)
Fig. 5. Test setup for heating the specimen in the two cases (a) Case 1 Oven heating (b) Case 2 Solar heating
V. RESULTS AND DISCUSSIONS
From the earlier research works, it has been observed that the presence of defects causes an increase in the temperature during a thermography experiment. This observation shall be the key point for observation while conducting the experiment. The first part (Case 1) of the experiment aims at creating an ideal heating environment with uniform heating of the test surface. By this, the gradual over-heating of the locations above the defect can be observed from the thermocouple readings. In the next case, the ambient solar heat is being used to identify the defect in the same specimen. However, as the heating is from an uncontrollable source and as it can result in non-uniform heating, trials have been made to understand and reduce these uninteresting components of the experiment. The experimental setup discussed earlier has been arrived after these trails. Now, the best results from both the cases are discussed.
5.1 ARTIFICIAL HEATING
experiment simulates an ideal heating environment so that defect identification is possible without ambiguity. From Fig. 6, it can be observed that the temperature values at sensor locations 3, 4, and 5 are slightly higher than the other sensor values. Since a nearly uniform heat source has been used for the study, it can be interpreted that this variation in the temperature values is due to the presence of a defect below those locations. The sensors are placed 50mm apart as shown in Fig. 4. Thus, it can be interpreted that the defect is approximately 100mm wide. Also, it can be observed that the sensor at the middle of the defect (sensor 4) records much higher values than the sensors over the edge of the defect (sensors 3 and 5).
Fig. 6. Temperature distribution at different locations of sensors during ideal heating
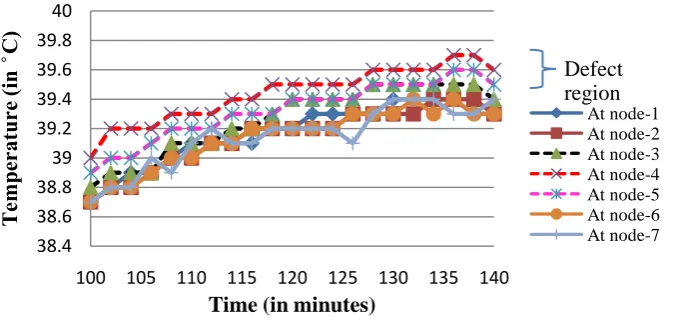
Similarly, the temperature time history data is analysed for observations related to defect identifications. Fig. 7 shows the plot of temperature profile at each node on the specimen where the sensors are placed. From the graph, it can be observed that the temperature profile of the nodes 3, 4 and 5 are higher when compared to the profile of other nodes. This demonstrates that the temperature profile varies over the region of defect. In the defect region, the accumulation of heat energy is observed to be relatively higher when compared to other regions. The specimen is heated for a period of about 144 minutes. It has been observed that the temperature values increase with sustained heating. The temperature variations over the defect areas are observable after heating for a period of about 80 minutes. Hence, the graph is plotted for a 40 minutes period of time starting from 100 minute.
Fig. 7. Temperature distribution at various nodes during different heating periods 36 36.5 37 37.5 38 38.5 39 39.5 40 40.5
0 2 4 6 8
T
em
pe
ra
tu
re
(i
n
̊ C
)
Sensor Number
At 30 min
At 50 min
At 70 min
At 90 min
At 110 min
At 130 min
At 144 min Defect region 38.4 38.6 38.8 39 39.2 39.4 39.6 39.8 40
100 105 110 115 120 125 130 135 140
T
em
pe
ra
tu
re
(i
n
̊ C
)
Time (in minutes)
5.2 NATURAL HEATING
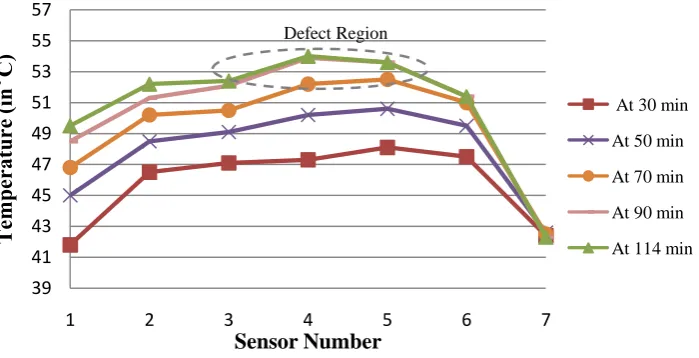
In the second case, the results obtained by heating the specimen under sunlight are discussed. Fig. 8 shows the plot of temperature at various sensor locations on the specimen during different heating periods under sunlight. From the results, it is observed that temperature increases slightly over the nodes where 3rd, 4th and 5th sensors are placed whereas in the other sensors the temperature values are relatively smaller. In addition, the temperature values in sensors 2 and 6 are also found to be relatively higher when compared to sensors 1 and 7. Hence, the interpretation of the size of the defect would be difficult from these results.
Fig. 8. Temperature distribution at various positions of sensors
Fig. 9 shows the plot of temperature time histories at all nodes of the specimen where the sensors are placed. From the graph, it is clear that the temperature profiles of the nodes 3, 4 and 5 are consistently higher when compared to the profile of other nodes. Temperature in these areas increases rapidly when compared to other areas as the time of heating increases. From the temperature profile, the areas of defect can be identified.
Fig. 9. Temperature distribution at various nodes at different time periods 39 41 43 45 47 49 51 53 55 57
1 2 3 4 5 6 7
T
em
pe
ra
tu
re
(i
n
̊ C
)
Sensor Number
At 30 min
At 50 min
At 70 min
At 90 min
At 114 min Defect Region 40 42 44 46 48 50 52 54 56
70 75 80 85 90 95 100 105 110 115
T
em
pe
ra
tu
re
(i
n
̊C
)
Time (in min)
Comparing the results from Fig. 6 and Fig. 8, it can be observed that the temperature distribution at an instant differs based on the heating source. With an ideal heating source, it is possible to arrive at clear and unambiguous results which would help in easy interpretation and identification of the defect location. While applying the solar heat, many influencing factors participate and the higher heat energy from the sun has led to the increased temperature values in sensors 3, 4 and 5 even at the 30 minute interval (as shown in Fig. 8). It is also observed that the higher temperature values in sensors 3 to 5 have influenced sensors 2 and 6 to record higher values (as shown in Fig. 8). Because of these reasons the identification of the defects size becomes difficult. Also, sensors 1 and 7 do not record same temperature values in case 2. This is caused by the orientation of the sun with respect to the normal to the specimen’s top surface. With these observations in the mind, the temperature time histories shall be compared. From Fig. 7 and Fig. 9, it can be observed that the temperatures recorded above the defect are relatively higher when compared to the other locations. However, because of the uncontrolled heating while using the natural heating, the difference between the node 3 and node 6 is not appreciable. Even then, the temperature time histories of the defect region could be differentiated from the other region in Fig. 9. Thus, the applicability of thermography technique for defect identification in concrete seems encouraging. However, the use of a uniform heating source is found to provide encouraging observations.
VI. CONCLUSIONS
Thermography technique is gaining popularity for defect identification. The recent research works on infrared thermography have highlighted its applicability to shallow depth defect identification. However, the higher cost of the equipment has limited the research and applicability possibilities. Hence, the present work focused on employing the thermocouples for assessing the temperature profiles on the test specimen. The low cost of the sensor and the data logging device is expected to promote the greater usage of the methodology, leading to higher interest in applying thermography technique for defect identification.
This paper focused on using thermocouples to map the temperature profiles on a concrete specimen for investigation in the laboratory. Also, the applicability of two heating sources has been investigated for their suitability to defect identification in concrete. From the experimental results, it was observed that the temperature increases over the areas where the defect is located. Temperature profile at nodes where defect is located varies from the temperature at other nodes. It can be concluded that it is possible to identify defect in concrete by predicting the temperature distribution on concrete by using thermocouples as sensors. The applicability of this type of sensors would encourage more investigations in the laboratory. With the understanding from these research works, it would soon be possible to take thermography technique to the field for defect identification.
ACKNOWLEDGEMENT
The paper is published with the approval of the Director, CSIR-SERC.
REFERENCES
[1] Maierhofer Ch, Arndt, R., Rolling, M., Rieck, C., Walther, A., Scheel, H., and Hillemeier, B., “Application of impulse-thermography for non-destructive assessment of concrete structures”, Cement and Concrete Composites, Vol.28, No.4, pp.393-401, 2006.
[2] Simoes, I., Simoes, N., Tadeu, A., and Prata, J., “IR thermography used to detect thin defects versus numerical simulation results”, In Proc. of 11th International Conference on Quantitative Infrared Thermography, pp.11-14, Naples, 2012.
[3] Clark, M.R., McCann, D.M., and Forde, M.C., “Application of infrared thermography to the non-destructive testing of concrete and masonry bridges”, NDT&E International, Vol. 36, pp.265-275, 2003.
[4] Guide book on Non destructive testing of concrete structures, “International Atomic Energy Agency”, Vienna (2002).
[5] Vreugdenburg, T.D., Willis, C.D., Mundy, L., and Hiller, J.E., “A systematic review of elastography, electrical impedance scanning, and digital infrared thermography for breast cancer screening and diagnosis”, Breast Cancer Research and Treatment, Vol.1373, No.3, pp.665-676, 2013.
[6] Jadin, M.S., and Taib, S., “Recent progress in diagnosing the reliability of electrical equipment by using infrared thermography”, Infrared Physics & Technology, Vol.55, No.4, pp. 236–245, 2012.
[8] Zhang, Z., Bin, L., and Jiang, Y., “Slag detection system based on infrared temperature measurement”, Optik - International Journal for Light and Electron Optics, Vol.125, No.3, pp. 1412–1416.
[9] Ruben Pablo, and Jon, “Infrared Thermography for Temperature Measurement and Non-Destructive Testing”, Sensors, Vol.14, pp.12306-12340, 2014.
[10] Sakagami, T., and Kubo, S., “Development of a new non-destructive testing technique for quantitative evaluations of delamination defects in concrete structures based on phase delay measurement using lock-in thermography”, Infrared Physics & Technology, Vol.43, pp.311-316, 2002.
[11] Lai, W.L., Kou, S.C., Poon, C.S., Tsang, W.F., and Lai, C.C., “ Effects of elevated water temperatures on interfacial delaminations, failure modes and shear strength in externally-bonded CFRP-concrete beams using infrared thermography, gray-scale images and direct shear test” , Construction and Building Materials ,Vol. 23, No.10, pp.3152-3160, 2009.
[12] Milovanovic, B., and Pecur, I.B., “The Role of Infrared Thermography in Nondestructive testing of Civil Engineering Structures”, In Proc. of Spearhead Network for Innovative, Clean and safe cement and concrete technologies (SPIN), Krnic & Niksa (ed), Zagreb, 2011.
[13] Dumoulin, J., Ibos, L., Marchetti, M., and Mazioud, A., “Detection of non emergent defects in asphalt pavement samples by long pulse and pulse phase infrared thermography”, European Journal of Environmental and Civil Engineering, Vol.15, No. 4, pp.557-574, 2011.
[14] Chiang, C.H., Cheng, C.C., and Hsu, K.T., “Inspection of Deteriorated Coastal Embankments Using Radar, Thermography, and Impact-Echo”, Nondestructive Testing of Materials and Structures, RILEM Book series, Vol.6 , pp.927-933, 2013.
[15] Belattar, S., Rhazi, J., and Ballouti, A.E., “Non–destructive testing by infrared thermography of the void and honeycomb type defect in the concrete”, International Journal of Microstructure and Materials Properties, Vol.7, pp.235-253, 2012.
[16] Carcangiu, S., Cannas, B., Concu, G., and Trulli, N., “Modeling of Active Infrared Thermography for Defect Detection in Concrete Structures”, In Proc. of 2012 COMSOL Conference, Milan, 2012.
[17] Gailius, A., and Zukauskas, D., “Determination of Concrete Structural Defects by Infrared Spectrum Analysis”, Materials Science, Vol. 9, No.1, pp.106-110, 2003.
[18] Nowak, H., and Nowak, L., “The use of active thermography to detect material inclusions in the walls”, Technical Transactions in civil engineering, Vol.3B, pp.320-328, 2014.
[19] Tayade, K.C., Deshpande, N.V., and Pofale, A.D., “Experimental study of temperature rise of concrete and assessment of cracking due to internal restraint”, International Journal Of Civil and Structural Engineering, Vol. 4, No. 3, pp.353-364, 2014.
[20] Akbarnezhad, A., Ong, K.C.G., and Kuang, K.S.C., “Temperature sensing in microwave heating of concrete using fibre Bragg grating sensors”, Magazine of Concrete Research, Vol.63, No.4, pp.275–285, 2011.