An Overview of Pre-Processing Text Clustering
Methods.
D Sailaja M.V.Kishore B.Jyothi N.R.G.K.Prasad Asst.Professo
r ANITS.
Asst.Professo r ANITS.
Asst.Professor GITAM.
Asst.Professor SAIGANAPATHIENGG
COLLEGE
Abstract:In the last decades digital forensics has become a prominent activity in modern investigations. Seized digital devices can provide precious information and evidences about facts and/or individuals on which the investigational activity is performed. Due to the complexity of this inquiring activity and to the large amount of the data to be analyzed, the choice of appropriate digital tools to support the investigation represents a central concern. In this paper, an effective digital text analysis strategy, relying on clustering based text mining techniques, is introduced for investigational purposes. The proposed methodology is experimentally applied to the Email dataset of an organization that well fits a plausible forensics analysis context.
INTRODUCTION:
Clustering algorithms can be applied to text mining to allow the automatic recognition of some sort of structure in the analyzed set of documents. In particular, clustering is designed to discover groups in the set of documents such that the documents within a group are more similar to one another than to documents of other groups. The core idea is to provide the analyst with clusters including documents semantically related, as a starting point for determining investigation paths.
Most text clustering algorithms rely on the so-called vector-space model. In this model, each text document d is represented by a vector of frequencies of the remaining m terms:
d= ( tf1,…,tfm)
Often, the document vectors are normalized to unit length to allow comparison of documents of different lengths. Note that the vector-space has a very high dimensionality since even after pre-processing there are typically still several thousands of terms, in many text databases you have to deal with approximately 10,000 terms. Due to the high dimensionality, most frequencies are zero for any single document.
To measure the similarity between two documents d1 and d2 represented in the vector space model, typically the cosine measure is used which is defined by the cosine of the angle between the two vectors:
similarity(d1,d2) = (d1.d2) /(|d1|.|d2|)
where • denotes the vector dot product and | | denotes the length of a vector.
The standard clustering algorithms can be categorized into partitioning algorithms such as k-means or k-medoid and hierarchical algorithms such as Single-Link or Average-Link. Scatter/Gather is a well-known algorithm which has been proposed for a document browsing system based on clustering. It uses a hierarchical clustering algorithm to
determine an initial clustering which is then refined using the means clustering algorithm. Many variants of the k-means algorithm have been proposed for the purpose of text clustering, in particular to determine a good initial clustering. A recent study has compared partitioning and hierarchical methods of text clustering on a broad variety of test datasets. It concludes that k-means clearly outperforms the hierarchical methods with respect to clustering quality. Note that k-means is also much more efficient than hierarchical clustering algorithms. Furthermore, a variant of k-means called bisecting k-means is introduced, which yields even better performance. Bisecting means uses k-means to partition the dataset into two clusters. Then it keeps partitioning the currently largest cluster into two clusters, again using k-means, until a total number of k clusters has been discovered.
OBJECTIVE
Digital evidence, as defined as the information and data of investigative value that are stored on, received, or transmitted by a digital device, has become lately a crucial component in law enforcement agencies investigations. The relevance of this kind of evidence, collected when electronic data and devices are seized, is established by digital forensics analysts, which more and more often have to deal with massive amounts of data, still increasing with the capacity of mass storage devices.
Textual information represents one of the core data sources that may contain significant information. The amount of available textual data is usually extremely large , in the order of thousands of texts. The analyst, in this context, encounters objective difficulties in data content analysis and in finding important investigational patterns.
In this paper, a two-steps process is proposed, based on (1) Textual information extraction.
(2) Textual data analysis via clustering.
This work addresses text clustering for forensics analysis based on a dynamic, adaptive clustering model to arrange unstructured documents into content-based homogeneous groups.
This work presented, shows that the text clustering framework can find consistent structures suitable for investigative issues that can considerably aid the analyst during the inquiry activity.
Text Clustering with Python
To cluster a set of documents using Python it involves: a) Tokenizing and stemming each synopsis
c) Calculating cosine distance between each document as a measure of similarity
d) Clustering the documents using the k-means algorithm e) Using multidimensional scaling to reduce dimensionality within the corpus
f) Plotting the clustering output using matplotlib and mpld3 Synopsis:
The entire text present in each document.
Corpus:
Collection of documents.
a) Tokenizing and stemming each synopsis: NLTK:
The Natural Language Toolkit, or more commonly
NLTK, is a suite of libraries and programs for symbolic and statistical natural language processing (NLP) for the Python programming language. NLTK includes graphical demonstrations and sample data. It is accompanied by a book that explains the underlying concepts behind the language processing tasks supported by the toolkit.
NLTK is intended to support research and teaching in NLP or closely related areas, including empirical linguistics, cognitive science, artificial intelligence, information retrieval, and machine learning. NLTK has been used successfully as a teaching tool, as an individual study tool, and as a platform for prototyping and building research systems.
The core functionality of NumPy is its "ndarray", for n-dimensional array, data structure. These arrays are strided views on memory. In contrast to Python's built-in list data structure (which, despite the name, is a dynamic array), these arrays are homogeneously typed: all elements of a single array must be of the same type.
Such arrays can also be views into memory buffers allocated by C/C++. Cython and Fortran extensions to the CPython interpreter without the need to copy data around, giving a degree of compatibility with existing numerical libraries. This functionality is exploited by the SciPy package, which wraps a number of such libraries (notably BLAS and LAPACK). NumPy has built-in support for memory-mapped ndarrays.
Pandas:
Pandas is a software library written for the Python programming language for data manipulation and analysis. In particular, it offers data structures and operations for manipulating numerical tables and time series. Pandas is free software released under the three-clause BSD license.
Data Frame:
Two-dimensional size-mutable, potentially heterogeneous tabular data structure with labeled axes (rows and columns). Arithmetic operations align on both row and column labels. Can be thought of as a dict-like container for Series objects. The primary pandas data structure includes:
pandas.DataFrame(data=None, index=None, columns=None, dtype=None, copy=False)
Tokenizing:
It is the process of breaking a stream of text up into words, phrases, symbols, or other meaningful elements called
tokens. The list of tokens becomes input for further processing such as parsing or text mining. Tokenization is useful both in linguistics (where it is a form of text segmentation), and in computer science, where it forms part of lexical analysis. Typically, tokenization occurs at the word level. However, it is sometimes difficult to define what is meant by a "word".
Often a tokenizer relies on simple heuristics, for example:
Punctuation and whitespace may or may not be included in the resulting list of tokens.
All contiguous strings of alphabetic characters are part of one token; likewise with numbers
Tokens are separated by whitespace characters, such as a space or line break, or by punctuation characters.
Stemming:
Stemming is the term used in linguistic morphology and information retrieval to describe the process for reducing inflected (or sometimes derived) words to their word stem, base or root form generally a written word form. The stem needs not to be identical to the morphological root of the word; it is usually sufficient that related words map to the same stem, even if this stem is not in itself a valid root. Many search engines treat words with the same stem as synonyms as a kind of query expansion, a process called conflation.
Lookup algorithms for Stemmer:
A simple stemmer looks up the inflected form in a lookup table. The advantages of this approach is that it is simple, fast, and easily handles exceptions. The disadvantages are that all inflected forms must be explicitly listed in the table: new or unfamiliar words are not handled, even if they are perfectly regular (e.g. iPads ~ iPad), and the table may be large. For languages with simple morphology, like English, table sizes are modest, but highly inflected languages like Turkish may have hundreds of potential inflected forms for each root.
A lookup approach may use preliminary part-of-speech tagging to avoid overstemming.
The Production technique for Stemmer:
The lookup table used by a stemmer is generally produced semi-automatically. For example, if the word is "run", then the inverted algorithm might automatically generate the forms "running", "runs", "runned", and "runly". The last two forms are valid constructions, but they are unlikely. Some examples of the rules include:
if the word ends in 'ed', remove the 'ed'
if the word ends in 'ing', remove the 'ing'
if the word ends in 'ly', remove the 'ly'
SnowballStemmer:
Snowball is a small string processing programming language designed for creating stemming algorithms for use in information retrieval. Based on Snowball algorithm, given string is stemmed using Snowball Stemmer.
Stopword Removal:
Any group of words can be chosen as the stop words for a given purpose. For some search engines, these are some of the most common, short function words, such as the, is, at, which, on.. etc.
b) Transforming the corpus into vector space using tf-idf:
Tf-idf stands for term frequency-inverse document frequency, and the tf-idf weight is a weight often used in information retrieval and text mining. This weight is a statistical measure used to evaluate how important a word is to a document in a collection or corpus. The importance increases proportionally to the number of times a word appears in the document but is offset by the frequency of the word in the corpus. Variations of the tf-idf weighting scheme are often used by search engines as a central tool in scoring and ranking a document's relevance given a user query.One of the simplest ranking functions is computed by summing the tf-idf for each query term; many more sophisticated ranking functions are variants of this simple model.
Tf-idf can be successfully used for stop-words filtering in various subject fields including text summarization and classification.
How to Compute:
Typically, the tf-idf weight is composed by two terms: the first computes the normalized Term Frequency (TF): the number of times a word appears in a document, divided by the total number of words in that document; the second term is the Inverse Document Frequency (IDF), computed as the logarithm of the number of the documents in the corpus divided by the number of documents where the specific term appears.
TF: Term Frequency, which measures how
frequently a term occurs in a document. Since every document is different in length, it is possible that a term would appear much more times in long documents than shorter ones. Thus, the term frequency is often divided by the document length (i.e. the total number of terms in the document) TF(t) = (Number of times term t appears in a document) / (Total number of terms in the document).
IDF: Inverse Document Frequency, which measures how important a term is. While computing TF, all terms are considered equally important. However it is known that certain terms, such as "is", "of", and "that", may appear a lot of times but have little importance. Thus we need to weigh down the frequent terms while scale up the rare ones, by computing the following: IDF(t) = log e (Total number of documents / Number of documents with term t in it).
To get a Tf-idf matrix, first count word occurrences by document. This is transformed into a document-term matrix (dtm). This is also just called a term frequency matrix.
Sklearn:
Simple and efficient tools for data mining and data analysis
Accessible to everybody, and reusable in various contexts
Built on NumPy, SciPy, and matplotlib
Open source, commercially usable - BSD license
Feature Extraction:
In machine learning, pattern recognition and in image processing, feature extraction starts from an initial set of measured data and builds derived values (features) intended to be informative, non redundant, facilitating the subsequent learning and generalization steps, in some cases leading to better human interpretations. Feature extraction is related to dimensionality reduction.
Feature extraction involves reducing the amount of resources required to describe a large set of data. When performing analysis of complex data one of the major problems stems from the number of variables involved. Analysis with a large number of variables generally requires a large amount of memory and computation power or a classification algorithm which overfits the training sample and generalizes poorly to new samples. Feature extraction is a general term for methods of constructing combinations of the variables to get around these problems while still describing the data with sufficient accuracy.
Joblib:
Joblib is a set of tools to provide lightweight pipelining in Python. In particular, joblib offers:
1. transparent disk-caching of the output values and lazy re-evaluation (memoize pattern) 2. easy simple parallel computing 3. logging and tracing of the execution Joblib is optimized to be fast and robust in particular on large data and has specific optimizations for numpy arrays. The vision is to provide tools to easily achieve better performance and reproducibility when working with long running jobs.
Avoid computing twice the same thing: code is rerun over an over, for instance when prototyping computational-heavy jobs (as in scientific development), but hand-crafted solution to alleviate this issue is error-prone and often leads to unreproducible results
Persist to disk transparently: persisting in an efficient way arbitrary objects containing large data is hard. Using joblib’s caching mechanism avoids hand-written persistence and implicitly links the file on disk to the execution context of the original Python object. As a result, joblib’s persistence is good for resuming an application status or computational job, eg after a crash.
c) Calculating Cosine distance :
different dimension and a document is characterized by a vector where the value of each dimension corresponds to the number of times that term appears in the document. Cosine similarity then gives a useful measure of how similar two documents are likely to be in terms of their subject matter.
dist is defined as 1 - the cosine similarity of each document. Cosine similarity is measured against the tf-idf matrix and can be used to generate a measure of similarity between each document and the other documents in the corpus (each synopsis among the synopses). Subtracting it from 1 provides cosine distance which I will use for plotting on a euclidean (2-dimensional) plane. With dist it is possible to evaluate the similarity of any two or more synopses. The technique is also used to measure cohesion within clusters in the field of data mining.
d) Clustering:
Cluster analysis or clustering is the task of grouping a set of objects in such a way that objects in the same group
(called a cluster) are more similar (in some sense or
another) to each other than to those in other groups (clusters). It is a main task of exploratory data mining, and a common technique for statistical data analysis, used in
many fields, including machine learning, pattern
recognition, image analysis, information retrieval,
and bioinformatics.
Cluster analysis itself is not one specific algorithm, but the general task to be solved. It can be achieved by various algorithms that differ significantly in their notion of what constitutes a cluster and how to efficiently find them. Popular notions of clusters include groups with small distances among the cluster members, dense areas of
the data space, intervals or particular statistical
distributions. Clustering can therefore be formulated as
a multi-objective optimization problem. The appropriate
clustering algorithm and parameter settings (including values such as the distance function to use, a density threshold or the number of expected clusters) depend on the individual data set and intended use of the results. Cluster analysis as such is not an automatic task, but an iterative
process of knowledge discovery or interactive
multi-objective optimization that involves trial and failure. It will often be necessary to modify data preprocessing and model parameters until the result achieves the desired properties k-means clustering algorithm
k-means is one of the simplest unsupervised learning algorithms that solve the well known clustering problem. The procedure follows a simple and easy way to classify a given data set through a certain number of clusters (assume k clusters) fixed apriori. The main idea is to define k centers, one for each cluster. These centers should be placed in a cunning way because of different location causes different result. So, the better choice is to place them as much as possible far away from each other. The next step is to take each point belonging to a given data set and associate it to the nearest center. When no point is pending, the first step is completed and an early group age is done. At this point we need to re-calculate k new centroids as barycenter of the clusters resulting from the previous step. After we have these k new
centroids, a new binding has to be done between the same data set points and the nearest new center. A loop has been generated. As a result of this loop we may notice that the k centers change their location step by step until no more changes are done or in other words centers do not move any more. Finally, this algorithm aims at minimizing an objective function know as squared error function given by:
where,
‘||xi - vj||’ is the Euclidean distance between xi and vj.
‘ci’ is the number of data points in ith cluster. ‘c’ is the
number of cluster centers.
Algorithmic steps for k-means clustering
Let X = {x1,x2,x3,……..,xn} be the set of data points and V = {v1,v2,…….,vc} be the set of centers.
1) Randomly select ‘c’ cluster centers.
2) Calculate the distance between each data point and cluster centers.
3) Assign the data point to the cluster center whose distance from the cluster center is minimum of all the cluster centers..
4) Recalculate the new cluster center using:
where, ‘ci’ represents the number of data points in ith
cluster.
5) Recalculate the distance between each data point and new obtained cluster centers.
6) If no data point was reassigned then stop, otherwise repeat from step (3).
e) Multi-dimensionality Scaling: Bag of Words (BoW):
In text search and classification of text, word order contributes less to the search result or document classification unless it is part of a phrase. Therefore, it is a common practice to use the frequency of occurrence of words sacrificing the word order which is known as "bag of words". In this document representation method, document is converted to vectors by simply counting number of occurrence of words. For example, the following two sentences would have the same vector representation: "I am who I become" and "I become who I am" as the frequency of occurrence of words are same even though the word order is different. The rationality behind of this document representation is that, the presence and count of words do matter more than the word sequence in a sentence for classification. In practice, this representation is "lingua franca" along with tf-idf representation.
J-S Matrix
not solve our curse of dimensionality problem. So, we introduce a dimensionality reduction method (among many others) i.e. Multidimensional Scaling.
Multidimensional Scaling (MDS)
Over-simplified idea behind MDS is that if we could find an embedding which has a significantly lower dimension for high dimension space and preserve the distance between observation pairs, we do not lose much in relative sense since we are keeping the distance between the pairs. Further, we both reduce dimensionality quite a lot and preserve the relative distance to each other. This is somehow different than traditional dimensionality reduction methods where they they generally scale individual observations or all of the observations altogether. MDS seeks to fit a lower embedding for observation pairs. Since the J-S divergence deals with document pairs, J-S Divergence matrix could be considered as a dissimilarity matrix for the documents in that sense. Therefore, it is a perfect fit for MDS as MDS also tries to reduce the dimensionality of J-S measure between two documents. We want to find 2-dimension lower embedding in order to visualize the documents in a scatter plot but 1-dimension works as well as any number of dimension could be used for MDS.
f) Visualizing Clusters:
In Python we can visualize the document clustering output using matplotlib and mpld3.
Matplotlib:
Matplotlib is a python 2D plotting library which produces publication quality figures in a variety of hardcopy formats and interactive environments across platforms. matplotlib can be used in python scripts, the python and ipython shell , web application servers, and six graphical user interface toolkits.
Some of the advantages of the combination of Python, NumPy, and matplotlib are:
Based on Python, a full-featured modern object-oriented programming language suitable for large-scale software development
Free, open source, no license servers
Native SVG support
Mpld3:
The mpld3 project brings together Matplotlib, the popular Python-based graphing library, and D3js, the popular Javascript library for creating interactive data visualizations for the web. The result is a simple API for exporting your matplotlib graphics to HTML code which can be used within the browser, within standard web pages, blogs, or tools such as the IPython notebook.
CONCLUSION AND FUTURE ENHANCEMENT:
An analyst, using the proposed tool, can exploit the obtained clusters in order to get useful investigative information; in particular the tool proves effective when one has to cope with a notable amount of data, when a human operator cannot manually proceed to inspection. In this project, we presented a novel approach for text clustering. Our experimental evaluation on real text and hypertext data sets demonstrated that FTC yields a cluster quality comparable to that of state-of-the-art text clustering
algorithms. However, FTC was significantly more efficient than its competitors on all test data sets. Furthermore, FTC automatically generates a natural description for the generated clusters by their frequent term sets
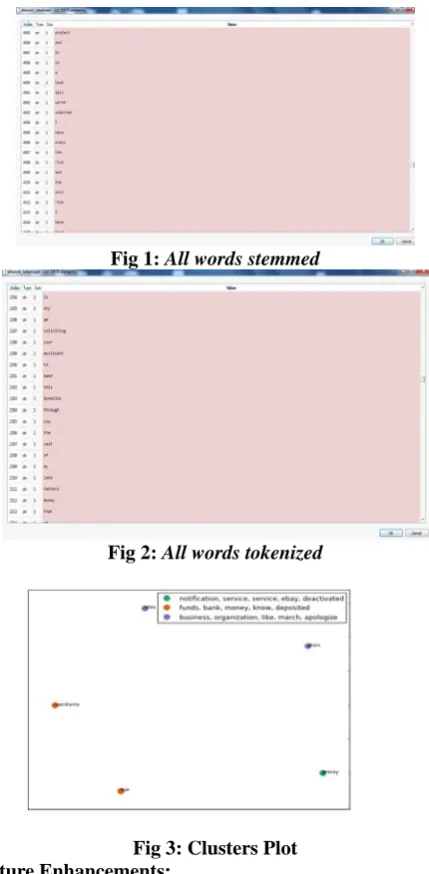
Fig 1: All words stemmed
Fig 2: All words tokenized
Fig 3: Clusters Plot Future Enhancements:
REFERENCES:
[1] Sergio Decherchi, Simone Tacconi “Text Clustering for Digital Forensics Analysis ”Frequent Term-Based Text Clustering
[2] Mena, J.: Investigative Data Mining for Security and Criminal Detection. Butterworth-Heinemann (2003)
[3] Sullivan, D.: Document warehousing and text mining. John Wiley and Sons (2001)
[4] Fan, W., Wallace, L., Rich, S., Zhang, Z.: “Tapping the power of text mining”. Comm. of the ACM. 49, 76—82 (2006)
[5] Decherchi, S., Gastaldo, P., Redi, J., Zunino, R.:Hypermetric k-means clustering for content-based document management, First Workshop on Computational Intelligence in Security for Information Systems, Genova. (2008)