Energy Absorption Due to Oblique Impact Crushing of Thin-Walled Tubes
TsutomuUmeda1,∗and KojiMimura1
1Division of Mechanical Engineering, Graduate School of Engineering, Osaka Prefecture University, 1-1, Gakuen-cho, Naka-ku, Sakai,
Osaka 599-8531, Japan
Abstract.From the viewpoint of improving both the crash safety and the fuel efficiency, various shaped thin-walled tubes have been utilized as energy absorbers of automobiles such as front side members, crash boxes and so forth. In the axial crushing test of the regular polygonal tube, if the number of angles was small enough, it showed a certain inherent wrinkle mode, and the mean buckling load increased with that number, while it showed the mode of cylindrical tube if that number became larger. In the oblique crushing test, the same tendency was also shown within the range that the transition from axial collapse to bending collapse did not occur. This transition considerably decreases the mean buckling load so that it is important to know the threshold crush angle for the transition. Then, the crushing behavior of regular 4-12 angled tubes were investigated with changing the crush angle mainly by the experiment. The threshold angle is sensitively influenced by the initial imperfection and the boundary condition so that both the threshold angles obtained by the experiment and by the calculation for the square tube are 8-13◦ smaller than that predicted by the equation proposed by Han and Park. For the carbon steel S25C, the increase of the strain rate in the axial collapse mode raises the mean buckling load, while it shows little strain rate dependence once the transition occurs.
1 Introduction
In recent years, improving the crash safety with keep-ing the fuel efficiency becomes more and more important for the carmaker, and the environmental issues and the progress in multi-material fabrication have also brought further requirements for the improvement. In the crash accident, a certain amount of the kinetic energy of auto-mobiles will be dissipated as the plastic work in the axial or the lateral buckling of energy-absorbing components, most of which are thin-walled structures or tubes. From the practical viewpoint, most of those components are of various prismatic tubes so that the crushing behavior of rectangular tubes has been studied. Murase et al. stud-ied the inextensional crushing mode of thin-walled square tube subjected to impulsive compressive load by means of the finite element method, in which the large defor-mation with material and geometric non-linearities was taken into consideration theoretically [1]. Wierzbicki and Abramowicz developed the mathematical model of thin-walled polygonal tubes on the basis of the rigid-perfectly plastic material approximation and the condition of kine-matic continuity on the boundaries between rigid and de-formable zones [2], and obtained a formula of the mean buckling load for the axially crushing square tube sub-jected to dynamic compressive load [3]. On the other hand, in general, the crash accident is not a full-lap colli-sion but an offset collision so that the crushing behavior of prismatic tubes under oblique impact load have been also studied. Kecman carried out comprehensive experimen-tal study on the bending collapse of rectangular tubes [4],
∗e-mail: umeda@me.osakafu-u.ac.jp
and Wierzbicki also conducted analytical investigation on the bending deformation of rectangular tubes [5]. Further-more, hat-type section columns [6], tapered square tubes [7] and aluminum foam-filled square tubes [8] subjected to oblique load have been also investigated. Han and Park studied the transition of the crushing behavior of rectan-gular tubes subjected to oblique dynamic load from axial collapse mode to bending collapse mode by means of the theoretical examination and the numerical simulation and obtained a certain equation, which estimates the threshold angle for that transition, from the approximation of theo-retical and simulated data plotted [9].
In this study, to obtain the design policy of the energy-absorbing component subjected to offset collision, impact crushing tests of some regular polygonal tubes were car-ried out besides quasi-static and low-speed crushing tests with changing the crush angle from 0 to 30◦. Then, the effects of the crush angle, the number of angles and the cross-head speed of testing device were discussed. The numerical simulation was also conducted to investigate the effects of crush angle and boundary condition using the ex-plicit FEM code LS-DYNA [10].
2 Experiment
+0.02
−0.00
10.4
R 0.6
φ5
1.5
5.5 5.5 27
5
t 1.2 2
Fig. 1.Drawing of specimen for tension test.
800
600
400
200
0
T
rue stress, MPa
0.20 0.15
0.10 0.05
0.00
True strain
1.92×10⁻³ s-1
5.61×10⁻² s-1
9.24×10⁻¹ s-1
1.39×10³ s-1
Fig. 2.Stress – strain relationships of normalized S25C at strain rates within the range from 10−3to 103s−1.
t = 0.5
a = 18.6
a
= 28
t = 0.5
a = 22.4
t = 0.5
n = 4 n = 5 n = 6 Loading surface first contacts at this edge
t = 0.5 t = 0.5
a = 11.2
n = 10 n = 11 a = 10.1
Fig. 3. Cross-sections of polygonal tube specimens (L=100 mm).
2.1 Specimens and the results of tension tests
Regular polygonal tubes were quarried by the wire electric discharge machine from the block of carbon steel S25C for mechanical structure, which was normalized at 880-900◦C for 30 minutes per 25 mm thickness and was air-cooled. The tension tests were carried out with the speci-men shown in Figure 1, which was quarried from the block of normalized S25C, by means of AUTOGRAPH AGS-H 5kN (Shimadzu Corporation, the testing strain rate:∼10−3 s−1), TS-2000 (Saginomiya Seisakusho, Inc., from∼10−2 to∼100 s−1) and the non-coaxial Hopkinson bar method testing apparatus (∼103 s−1). The true stress – true strain relationships within the strain-rate range from 10−3to 103 s−1were obtained as shown in Figure 2 and shows remark-able strain rate dependence.
Figure 3 shows cross-sections of polygonal tube spec-imens used in the crushing test. The thicknesstis 0.5 mm, the cross-sectional areaAis approximately 55 mm2, and the axial lengthLis 100 mm while, for the oblique crush-ing test, that is extended 20 mm extra to fix the specimen on the testing device with the fixture of the same length. In the oblique crushing test, the load was applied to the left-side edge by the surface of loading part that was inclined from the horizontal plane. The circular tube of internal di-ameter 34.5 mm were also made with the same dimensions fort,AandL.
A/D converter
V = 6.67 mm/s
Crosshead
Specimen Fixture
Output from built-in load cell Angle-variable jig
Extensometer
Amplifier
Terminal panel
PC φ
INSTRON testing machine Model 1116 25ton
Fig. 4.Configuration of low-speed oblique crushing test.
(a) Angle-variable jig
n = 5 n = 6
n = 10 n = 11
20
(b) Fixture (b) Cores
Fig. 5. Jig, fixture and cores for Instron universal testing ma-chine.
2.2 Axial and oblique crushing tests
To examine the effect of cross-head speed of testing ma-chine, quasi-static and low-speed oblique crushing tests were also conducted by means of the Amsler-type hy-draulic universal testing machine REH-30 (Shimadzu Cor-poration, the testing cross-head speedV 0.03 mm/s) and the Instron universal testing machine Model 1116 25ton (V = 6.67 mm/s) respectively. For example, Figure 4 shows the configuration of low-speed oblique crushing test. The angle-variable jig, fixture and cores in Figures 5 (a), (b) and (c) were used to apply the oblique load on the top of tubal specimen with fixing its bottom. The angle-variable jig is able to change the angle of loading surface from the horizontal plane,φ, from 0 to 30◦by 5◦, and the fixture and cores are 20 mm long in the axial direction so that those fit with the extra part of tubal specimen to fix that for lateral movement or rotation. The angle-variable jig and fixture were made of the rolled structural steel SS400. The cores were made of SS400 or the polyester resin while there was almost no difference due to the core material in the crushing behavior of specimen.
Specimen
Stopper
Load sensing block Attachment
Magnetic scale
Linear magnetic encoder
Impact block Crosshead
Air piston
Bridge box
Oscilloscope
Electric winch
PC
GPIB
Amplifier V=3~4m/s
2600
700
φ
Fig. 6.Configuration of impact oblique crushing test.
Fig. 7. Photograph around load sensing block with specimen (n=5) and stopper.
Fig. 8.Schematic drawing of the fixture of specimen (n=6).
The drop-weight testing machine was used with the cross-head speed of 3-4 m/s at the impact moment. The oblique impact was applied to the top of specimen using the in-clined surface of attachment (φ=0, 10, 15, 20, and 30◦) on the impact block (38 kg) and the extra part (20 mm) of specimen was fixed on the load sensing block with the core and the fixture shown in Figure 8. The impact block was prevented to move more than 80 mm using the stopper as shown in Figure 7. The attachment, fixture and stop-per were made of the carbon steel S45C, and the induc-tion hardening process were applied to the loading parts of attachment and load sensing block. The load and dis-placement were measured by the load sensing block and the linear magnetic encoder respectively.
Unless otherwise stated, the surfaces of loading part and specimen, which were contact with each other, were degreased using the acetone. The effective length of spec-imen is 100 mm so that the nominal strain rate becomes about 3×10⁻⁴s−1 for REH-30, 6.67×10⁻² s−1 for the
In-Fig. 9.Crushed square tubes (n=4,V0.03 mm/s).
15
10
5
0
Load
P
, kN
80 60
40 20
0
Displacement
∆
L
, mm
φ = 0º
φ = 10º
φ = 20º
φ = 30º
Fig. 10.P–∆Lrelationships (n=4,V0.03 mm/s).
stron testing machine and 3-4×101s−1for the drop-weight testing machine respectively. As shown in Figure 2, there is almost no difference of stress – strain relationship due to strain rate dependence between quasi-static (3×10⁻⁴s−1 for REH-30) and low-speed (6.67×10⁻²s−1for the Instron testing machine) crushing tests.
2.3 Examples of experimental results
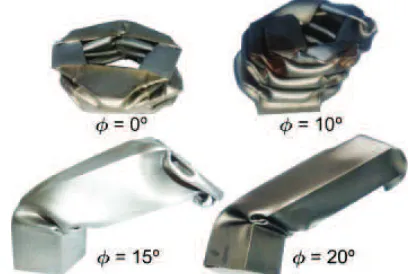
For example, Figure 9 shows crushed square tube spec-imens for φ =0, 10, 20, and 30◦ under the quasi-static crushing condition, and Figure 10 shows corresponding load (P) – displacement (∆L) relationships. The crush-ing behavior in Figure 9 shows the transition from axial collapse mode to bending collapse mode betweenφ=10◦ and 20◦, and the load level and absorbed energy also drop considerably within the same range ofφ.
In the same way, Figure 11 shows crushed hexagonal tube specimens forφ=0, 10, 20, and 30◦ under the low-speed crushing condition. The transition of collapse mode also emerges between 10◦ and 20◦, though V andn are different from those for the quasi-static crushing tests of square tubes. Figure 12 shows correspondingP–∆L re-lationships, and Figure 13 showsP–∆Lrelationships of hendecagonal tube specimens under the same cross-head speed condition. It is found that the load level increases withn if the axial collapse occurs while it is almost the same if the bending collapse occurs.
rela-Fig. 11.Crushed hexagonal tubes (n=6,V=6.67 mm/s).
15
10
5
0
Load
, kN
80 60
40 20
0
Displacement
, mm
= 0º
= 10º
= 20º
= 30º
Fig. 12.P–∆Lrelationships (n=6,V=6.67 mm/s).
15
10
5
0
Load
P
, kN
80 60
40 20
0
Displacement
∆
L
, mm
φ = 0º
φ = 10º
φ = 20º
φ = 30º
Fig. 13.P–∆Lrelationships (n=11,V=6.67 mm/s).
Fig. 14.Crushed pentagonal tubes (n=5,V=3∼4 m/s).
tionships. Though the higher harmonic oscillations are in-cluded, the load level increases due to the strain rate de-pendence as compared with those ofP–∆Lrelationships in Figures 10 and 11. The transition of collapse mode emerges between 10◦and 15◦.
15
10
5
0
Load
P
, kN
80 60
40 20
0
Displacement
∆
L
, mm
φ = 0º
φ = 10º
φ = 15º
φ = 20º
Fig. 15.P–∆Lrelationships (n=5,V=3-4 m/s).
2.4 Numerical model
Numerical simulations were performed using the explicit FEM code LS-DYNA Ver. 971d [10] to mainly discuss the effects of n and boundary condition. For example, Figure 16 shows the numerical model of hexagonal tube (n = 6) and its boundary condition. This model con-sists of 2 700 quadrangular shell elements of Belytschko-Leviathan type (5 integration points in thickness direction) and 2 754 nodes. The coefficient of friction,µ, is given us-ing the relative velocity between contact surfaces,vrel, as
follows:
µ=µk+(µs−µk)e−β|vrel| (1)
whereµs andµkare the coefficients of static and kinetic
friction respectively and β is the exponential coefficient [10]. Here, it is assumed that µs = 0.28, µk = 0.2 and β=0.001 s/mm. Furthermore, to reproduce natural buck-ling behavior, the pseudo-random number, the absolute value of which is less than 0.01 mm, is taken by the lin-ear congruential method and is added to the coordinates of nodes except those at the both ends, as initial imperfection. The normalized S25C was modeled as an isotropic elastic-viscoplastic material, whose flow stress – plastic strain relationship was given by the Johnson-Cook model [11] as follows:
σy=σ0+B( ¯εp)nJ
1+Clnε˙¯
p
˙
ε0
(2) whereσy, ¯εp and ˙¯εp are the flow stress, the equivalent plastic strain and its rate respectively. σ0, B andnJ are
the initial yield stress and the parameters related to work-hardening at quasi-static strain rate respectively. C and
˙
ε0are the parameter related to strain rate dependence and the standard strain rate respectively. Table 1 shows respec-tive material constants of the normalized S25C used in this study. The calculation of low-speed crushing tubes was carried out both by reducingV within the limits of com-puting capability and by equating the effect of strain rate on the stress – strain relationship in the calculation with that under actual strain rate condition.
2.5 Examples of calculated results
Table 1.Material constants of normalized S25C in Equation (2).
ρ E
ν σ0 B nJ C
[kg/m3] [GPa] [MPa] [MPa]
7840 205 0.25 290 815 0.581 0.0265
VelocityV
L = 100mm
Rigid wall
Hexagonal tube
31.74mm
V
x y z
φ Rigid wall
Fig. 16.Example of polygonal-tube model (n=6).
15
10
5
0
Load
P
, kN
80 60
40 20
0
Displacement
∆
L
, mm
Calculated with fixed support end Calculated with contact condition Experimental (contact condition)
Fig. 17.Comparison ofP–∆Lrelationship under low-speed ax-ial crushing condition between experimental and calculated re-sults (n=4).
Fig. 18.Deformation of square tubes calculated with changingφ
under low-speed crushing condition (n=4,∆L=50 mm).
the supported end of tube respectively and show qualita-tive agreement with the experimental result. However, the load levels of the former results are higher than that of the latter. This difference might come from the accuracy of calculation using shell element for torsional deformation, friction and material models, the mesh dependence, the initial imperfection and so on. Figure 18 shows crushed square tubes at∆L=50 mm forφ=0, 15 and 30◦under low-speed crushing condition, and Figure 19 shows calcu-latedP–∆Lrelationships of square tubes with changing
φ. The deformation of square tube forφ=30◦in Figure 18 (c) shows the bending deformation at the fixed end, and in Figure 19 the load level greatly decreases with changing
φfrom 20◦to 25◦, so that the transition of collapse mode seems to occur between 20◦ and 25◦. However, the load level of eachP – ∆L relationship in Figure 19 is rather larger than corresponding relationship in Figure 10.
Fig. 19.CalculatedP–∆Lrelationships with changingφ(n=4).
8
6
4
2
0
Mean buckling load
P
m
, kN
12 11 10 9 8 7 6 5 4
Number of angles
n
Experimental CalculatedCircular tube (experimental) Circular tube (calculated)
Fig. 20. Comparison of Pm by low-speed axial crushing tests
between experimental and calculated results.
15
10
5
0
Load
P
, kN
80 60
40 20
0
Displacement
∆
L
, mm
Experimental (3×10⁻⁴ s-1)
Experimental (6.67×10⁻² s-1)
Exp. (6.67×10⁻² s-1, with KURE CRC5-56)
Exp. (6.67×10⁻² s-1, with teflon coating & zinc stearate)
Calculated (6.67×10⁻² s-1)
Fig. 21.Experimental and calculatedP–∆Lrelationships under different boundary conditions (n=5,φ=10◦).
3 Effect of the number of angles and the
boundary condition
In this study, the energy absorption capacity is evaluated with the mean buckling load Pm, which is given by
di-viding the area under the curve of P – ∆L relationship up to∆L=70 mm (before starting densification) by the same value of ∆L. Figure 20 shows the comparison of Pm–nrelationship obtained under low-speed axial
crush-ing condition between the experimental and calculated re-sults. In both the results, first, Pm increases withn and
Number of angles n 䢺
䢸
䢶
䢴
䢲 Circular
䢳䢳 䢳䢲 䢻 䢺 䢹 䢸 䢷 䢶
Mean buckling load
P
m
, kN φ = 0°
φ = 10°
Strain rate: 6.67×10⁻²s-1
φ = 20° φ = 30°
Mean buckling load
P
m
, kN
Number of angles n
Circular Strain rate: 3-4×101s-1
● φ = 0° ■ φ = 10°
▲ φ = 15° ▼ φ = 20°
Axial collapse mode
(a) Low-speed (b) Impact Fig. 22.Variation ofPmwithn(experimental results).
the results for different boundary conditions and the calcu-lated result. Here, to discuss the difference between exper-imental and calculated results, oblique crushing tests were performed under four conditions; 1) quasi-static, 2) low-speed, 3) low-speed and lubricated with KURE CRC5-56 and 4) low-speed and lubricated with teflon coating and zinc stearate. Surely, the experimental results under those conditions are different from each other, and espe-cially the difference between quasi-static and low-speed crushing tests implies the velocity dependence of the co-efficients of friction because this material has no strain rate dependence within the range from quasi-static to low-speed conditions. The calculated result was obtained un-der the low-speed crushing condition, and its load level is still larger than that of any experimental result. Changing the magnitude of the coefficient of friction and the initial imperfection, the adoption of another material model, and the refinement of mesh size have been also investigated to some extent, however, those were not so effective so far. In this study, therefore, the numerical analysis is confined to qualitative evaluation.
4 Effect of crush angle
Han and Park proposed the equation that predicts the threshold angle of transition for square tube [9] as follows:
φc=4.81+1564.00e−1.12(L/a) (3)
whereφcanda are the threshold angle and the width of
square tube respectively. In this study,a =28 mm, L =
100 mm so thatφc=33.5◦. This value is 8-13◦larger than
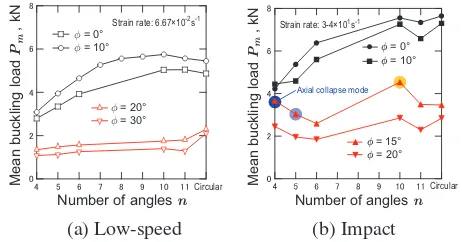
the crush angle φ, at which the bending collapse mode was confirmed by the experiment (20◦) and the numeri-cal analysis (25◦). Figure 22 (a) and (b) show the varia-tion of the mean buckling loadPmwith the crush angleφ
and the number of anglesnunder the low-speed and the impact crushing conditions respectively. Under the low-speed crushing condition, the transition of collapse mode occurs betweenφ=10◦and 20◦for alln, andP
mgreatly
decreases and becomes almost constant regardless ofnin the bending collapse mode. Under the impact crushing condition,Pmgrows with the strain rate. Forφ=15◦, the
square tube caused the axial collapse mode in a probabil-ity of two in three, and the pentagonal tube also caused the axial collapse mode in a probability of one in three. The polygonal tubes ofn≥6 caused the bending collapse mode. Then, the transition of collapse mode occurs around
φ=15◦, and it is expected thatφ
cdecreases with the
in-crease ofn. Furthermore,Pmincreases even in the bending
collapse mode to a certain extent, and particularlyPmhas
a peak value forn=10.
5 Conclusions
In order to obtain the design policy of the energy absorb-ing component subjected to oblique load, impact crushabsorb-ing tests of some regular polygonal tubes were performed be-sides quasi-static and low-speed crushing tests with chang-ing the crush angle φ. The transition of collapse mode occurs between φ =10◦ and 20◦ in the experiment and between 20◦ and 25◦ in the numerical simulation for the polygonal tubes used in this study. In the axial collapse mode, the mean buckling load increases with the number of angles,n, and has a peak value atn=10, then it de-creases a little to approach to the value of circular tube. It also increases with the strain rate if the material has the strain rate dependence. In the bending collapse mode, the mean buckling load is not so sensitive tonand shows lit-tle strain rate dependence. The results of impact crushing tests show that the threshold value,φc, is around 15◦and φcdecreases with the increase ofn.
References
1. Murase, K., Katori, H. and Nishimura, T., Bull. Japan Soc. Mech. Eng.26, 923–929 (1983)
2. Wierzbicki, T. and Abramowicz, W., Journal of Ap-plied Mechanics50, 727–734 (1983)
3. Abramowicz, W. and Jones, N., Int. J. Impact Engng. 2-2, 179–208 (1984)
4. Kecman, D., International Journal of Mechanical Sci-ences,25-9&10, 623–636 (1983)
5. Wierzbicki, T., Recke, L., Abramowicz, W., Gholami, T., and Huang, J., Computers & Structures, 51-6, 611– 623 (1994)
6. Wallentowitz, H. and Adam, H., design materials and innovative joining methods. Int. J. Crashworthiness,1-2, 163—180 (1996)
7. Reid, S.R. and Reddy, T.Y., International Journal of Mechanical Sciences,2-9, 623–637 (1986) International Journal of Impact Engineering,32, 1595–1620 (2006) 8. Reyes, A., Hopperstad, O.S. and Langseth, M.,
Inter-national Journal of Solids and Structures41, 1645–1675 (2004)
9. Han, D.C. and Park, S.H., Thin-Walled Structures35, 167–184 (1999)Proceedings of the 58th Japan Congress on Materials Research (in Japanese) (The Society of Materials Science, Japan, 2014), 64–65