Use of Rubber Shock Absorber to Mitigate
the Effect of Seismic Pounding
Dr. Nilesh U. Mate
1, Dr. Sachin. V. Bakre
2, Dr. Omprakash. R. Jaiswal
3Associate Professor and Head, Department of Civil Engineering, Amrutvahini College of Engg, Sangamner,
Ahmednagar, India
Associate Professor, Department of Applied Mechanics, VNIT, Nagpur, India2 Professor, Department of Applied Mechanics, VNIT, Nagpur, India3
ABSTRACT: The present paper addresses the comparative study of three adjacent three-degree-of freedom structures for elastic and inelastic systems with and without pounding under seismic excitations. The main intention of the present study is to investigate the pounding response of lumped MDOF models with and without rubber shock absorber in the form of bumper damper. Total six models have been preparedfor the dynamic analysis by considering the presence and absence of pounding as well as shock absorber. The entire numerical simulation is carried out in time domain by considering the input of real earthquake ground motion.
The result of the comparative study shows that the response of elastic and inelastic systems is different in the absence and presence of shock absorber. The use of rubber as a shock absorber proves to be much useful to reduce the shear force, impact force and displacement response of colliding structures, especially on pounding subjected sides of the structures.
KEYWORDS: Seismic pounding; Rubber shock absorber; MDOF elastic and inelastic stick system; Time history analysis; Spectral acceleration response; structural strain energy.
1. INTRODUCTION AND SOME PAST STUDIES
Medium to severe magnitude earthquakes in the past three decades have brought to the interest of earthquake engineers, structural engineers and researchers about the problem of structural pounding which is collision of adjacent structures due to the insufficient separation distance between them. Pounding can cause brutal damage and even collapse of structures during earthquakes. At each instance of collisions, the structures are subjected to short duration high magnitude lateral impulsive impact forces for which structuresare not generally being designed as per the conventional design structural codes. In the past, it is noticed that the pounding forces can be much higher than the seismic forces calculated as per conventional design codes (Jeng-Hsiang, 2005). Also, Pounding of one structure against another can lead to a weakening of either structure which resulted into the premature failure of the structures. The problem further becomesworst, if there is an older adjacent building, which is built to less stringent seismic codes and much closely located to the properly designed new construction. Designer should have to take additional precautions in such cases. An excessive vibration decreases the serviceability of these newly constructed buildings.
The problem of earthquake induced pounding between adjacent building‟s slab segments and adjacent deck segments of bridge has received considerable attention in the recent past. In Bhuj-India (2001) earthquake,
1Associate Professor and Head, (Corresponding Author), Department of Civil Engineering, Amrutvahini
College of Engg, Sangamner, Ahmednagar.
major damages of the structures have been reportedby Agarwal et al.(2012), Jain et al.(2002) and Patil (2004). Based on the survey and investigations conducted by Jain et al. (2002), it was reported that there were mostly infill wall damages, column shear failures and possible collapse due to pounding in many of closely spaced buildings. Pounding in bridges have lead to local crushing and spalling of pier bents, abutments, shear keys, bearing pads and restrainer, and also contributed to the collapse of decks. From the inspection report of Agarwal
et al.(2012), it was reported that the Anand building and old Surajbari bridge were severely damaged and collapsed due to pounding action. In Bhuj earthquake, over 10000 schools were destroyed or damaged. In Anjar, 350 children died when building had caved in on them(Patil, 2004). The inspection results have shown that many school buildings had moderate damage and about 4-5% school buildings were heavily damaged. The damages and deficiencies observed in the schools were reported due to various structural failures, and amongst them pounding is one of the significant reasons.
Numerical and experimental studies have shown that pounding introduces impact loads in addition to the forces caused by the ground acceleration itself. Due to pounding floor acceleration and interstorey deflections are significantly amplified, which is upsetting the serviceability of the structures i.e. damaging the non structural sensitive in-house equipments. During collision of structures, there is a sudden break of momentum of the displacement at the pounding levels which results in large and quick short duration acceleration impulses in the opposite direction and causes a greater damage to the structures. When these impact loads and acceleration spikes from pounding are too high, then the structural system has to be modified by employing some of the impact mitigation measures. Several methods have been proposed by the researchers all over the world to avoid collapse of buildings and bridges due to detrimental effects of structural poundings (Soong and Dargush, 1997; Anagnostopoulos and Karamaneas, 2008; Bhaskarrao and Jangid, 2006; Yang et al., 2003). The following measures have been generally proposed and examined for the pounding mitigation of buildings: (a) filling the structural gap with some soft shock absorbing materials(Anagnostopoulos and Karamaneous, 2008), (b) use of energy dissipation devices in the structures (Soong and Dargush, 1997), (c) Permanent connection or use of damper between the adjacent two buildings (Bhaskarrao and Jangid, 2006; Yang et al., 2003), (d) use of „collision‟ or bumper walls in one or both adjacent structures (Anagnostopoulos and Karamaneous, 2008). One of the proposed measures, on which this paper is intended, is the assimilation of soft material, such as rubber, on the location where impact is likely to be occurred, which will act as a shock absorber. This concept of rubber shock absorber is mostly used in ports and harbors, where it can protect the fender pile structurefrom the heavy blow of ships.
To reduce the effects of pounding, small separation distances needs to be maintained and these gaps needs to be filled up with a special shock absorbing material (bumper dampers). So that where the structures are subjected to pounding action, there will not be any damageto the main structure. The bumper damper element in the form of rubber shock absorber can be placed between the structures, but connected only to one of the structure. Bumper dampers are the energy dissipation links that are activated when the gap is closed. The presence of the bumper damper element will reduce the impulsive forces transmitted from one structure to the other. Anagnostopoulos and Karamaneous (2008) have proved that a soft viscoelastic material filling gap between two adjacent structures could reduce the effects of pounding significantly. This solution, however, did not reduce the building response below the values reached without pounding. Another inconvenience of this solution is that it does not solve the problem for the last building in a row. Recently, Polycarpou et al. (2013) have presented a simple but efficient methodology that can be used to simulate the incorporation of rubber layers between neighboring structures with relatively narrow seismic gaps. A new nonlinear inelastic force-based impact model has been proposed in the literature by the authors for limited thickness of bumper as a measure against seismic pounding.
) ( )
( ) ( ) (
) ( )
( Cu q t F t F t Mu t u
Mt t CD CE g
single structural unit. Total six models have been proposed in the analysis by considering the presence and absence of pounding as well as shock absorbers. The comparative study is carried out for all these considered models. The dynamic response of fixed base MDOF system is investigated under Arleta-Northridge (1994) ground excitation in time domain.
II. MATHEMATICAL FORMULATION OF FIXED BASE MDOF SYSTEM IN STRUCTURAL POUNDING
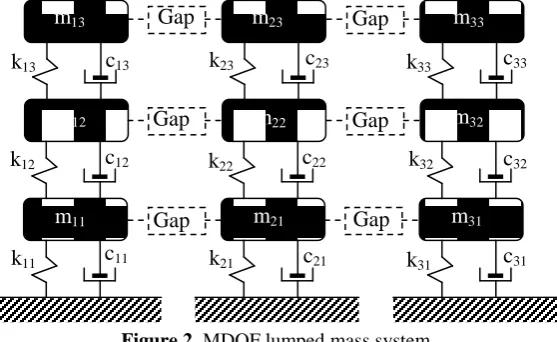
The theoretical formulation for modeling of three adjacent fixed based MDOF damped elastic/inelastic structures is presented here. The outer structures experiences only one side pounding incidence, while the inner structure suffers both side pounding incidences during seismic excitation at base. The three storey RC buildings shown in Figure 1 are converted to a lumped mass spring dashpot system (as depicted in Figure 2) as per the basic rules of structural dynamics. Figure 2 shows the lumped masses at each floor, storey-wise stiffness and linear viscous dashpot constants of each building. The gap element stiffness, separation distance and damping constant between the adjacent structures can also being depicted in same figure. Dynamic equations of multi degree of freedom systems under pounding can be written by drawing the free body diagrams for the lumped masses and then by using equilibrium equations. Finally, these equations can be more conveniently expressed in matrix form as given in equation 1.
The incremental governing equations of dynamic contact motion considering one sided pounding due to seismic input at time „t‟ can be written as:
(Eqn. 1)
Where, M = mass matrix; C = damping matrix; q(t) = inelastic force vector „or‟ elastic force vector; FCD(t) are the damping force caused by the dashpot used for an impact simulation between the adjacent structures.This also represents the rubber shock absorber damping. FCE(t) = Kk u(t) – KS are impact force caused by the dashpot and
spring between adjacent MDOF structures; KS is the spare constant gap element stiffness matrix; u(t)= acceleration
vector at time t; u(t)= velocity vector at time t; and ug(t)= input ground acceleration vector at time t.
a) Left building plan
5 m 5 m 5 m
3 m
3 m
3 m
15 m
3.75 m 3.75 m 3.75 m 3.75 m
b) Middle building plan c) Right building plan
3 m 3 m 3 m 3 m 3 m
3 m
3 m
3 m
) t ( 3 ) t ( 2 ) t ( ) t t ( 0 ) t t
(
a
(
u
u
)
a
u
a
u
u
S t t k t t kc t t C u K u K
F ( ) () ()
) , ( 1 Z u g u A z u Z Z u t Z
uy n n
t a7
The solution of the equation (1) for MDOF system subjected to one side pounding is obtained using average acceleration Newmark-Beta method (implicit method). The incremental quantities in the above equation are the change in the responses from time „t‟ to „t+t‟.Newmark method adopts approximation as following;
0 ≤ ≤ 1
The parameters that define the acceleration changes in the time step (t), and also decide the stability and accuracy of Newmark method are setting as = 1/2 and 1/6≤β ≤1/4 (in the present study β is considered as ¼), for this parameters the results are quite satisfactory.
The equilibrium equation at time t+t is expressed as follows:
) ( ) ( ) ( ) ( ) ( )
( Cu qt t F t t F t t Mu t t u M g E C D C t t t
t
(Eqn. 3)
) t t (
u
andu
(tt) can be obtained by solving equation (2). After substituting them into equation (3) and simplifying, we obtainP u
K tt (Eqn. 4)
Where,
ut+t can be obtain by solving equation (4),
u
(tt)and
u
(tt)also can be obtain according expression as follows: (Eqn. 5) Where,; 2 0 1 t a 1 2
t a ; t a 1
2 ; 1
2 1
3
a ; 4 1
a ;a 1)t
2 1 (
5 ; a6 t(1); .
Impact force also can be obtained as follows: (Eqn. 7)
Thus, we can get all the desired results, e.g. displacements, velocity, acceleration and impact force, etc. Wen(1976) proposed the equation for modeling non-linear hysteretic force-deformation behavior, in which the inelastic force q(t) (as mentioned in equation 1) is calculated as
q(t) = k0 u + (1-) Q Z (Eqn. 8)
Where, k0 is the initial stiffness; is the non-dimensional ratio of post to pre-yielding stiffness; u is the
incremental displacement; Q is the yield strength; and Z is a non-dimensional hysteretic component satisfying the non-linear first order differential equation expressed as
(Eqn. 9)
Where, β,, A and n are the dimensional parameter which control the shape of the hysteretic loop; uy is the yield
displacement and
u
is the incremental displacement. The Zcan be obtained by solving the differential equation 9 by using the fourth order Runge-Kutta method.no impact during impact
)
)(
(
)
(
)
(
)
(
)
(
)
(
) ( 5 ) ( 4 ) ( 1 ) ( 3 ) ( 2 ) ( 0 12 12 ) ( 5 ) ( 4 ) ( 1 ) ( 3 ) ( 2 ) ( 0 t t t k t t t g t t t t t t gu
a
u
a
u
a
C
C
u
a
u
a
u
a
M
l
d
s
t
t
u
M
u
a
u
a
u
a
C
u
a
u
a
u
a
M
t
t
u
M
P
no impact during impact
)
(
1 0 1 0 kk
a
M
a
C
C
K
q
C
a
M
a
q
K
) ( 7 ) ( 6 ) ( )(t t
u
ta
u
ta
u
t tu
(Eqn. 6)t u u u
utt t[(1)ttt]
2
) 2 1
( u u t
u u
All the inelastic MDOF systems are assumed to be elasto-plastic in nature. For elasto-plastic force deformation characteristics, the values of Wen‟s parameters are taken as β==0.5; A = 1 and n = 15 (Wen, 1976). In thepresent seismic analysis, buildings are modeled as shear buildings and do not include frame action. Any rotation of the buildings is also neglected.
II. APPLICATION EXAMPLE OF PRESENT NUMERICAL STUDY
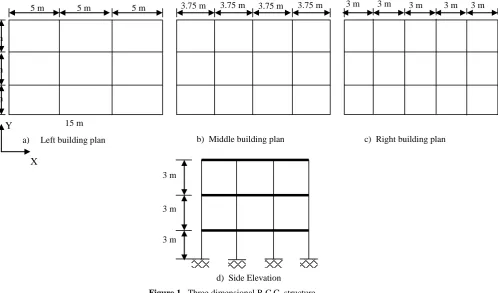
Three adjacent RC buildings of three storeys each with different floor masses and stiffnesses are considered for the numerical study. As per the basic rules of structural dynamics, the RC buildings are converted into a lumped mass spring dashpot system based on mass and stiffness of the structure. Study presented in this paper is mainly focused on linear elastic orelasto-plastic fixed base three adjacent, three storey, MDOF systems by considering nonlinear viscoelastic contact element for impact simulation. The output of the present study are obtained by developing a MATLAB code (MATLAB, 2009), which is capable to calculate the pounding response at the floor levels by using Newmark-Beta method. The three dimensional buildings chosen for the present study are given in Figure 1. For the present application example, the plan area of these three buildings is kept constantas 15 x 9 m, in order to avoid torsional pounding effect in the buildings. M25 grade of concrete is considered and modulus of elasticity of concrete is calculated as per IS 456:2000 code. The beam and column sizes in each building are considered constant throughout plan and elevation. The wall is placed only over the outer beams. The other structural properties are mentioned in Table 1. The imposed load is taken as 4.5 kN/m2 on floor area. For seismic weight calculations, 50 % contribution of live load is considered in the study except for roof, For roof live load contribution is zero. The full wall load is over the floors including roof also in the seismic weight calculations. The three degree of freedom spring dashpot models(as shown in Figure 2)arebeing developed from 3-D structures. The lumped masses at each floor levels and storey stiffness are computed as per the basics of structural dynamics. For gap element properties and structural properties of MDOF stick models referred the respective section below.
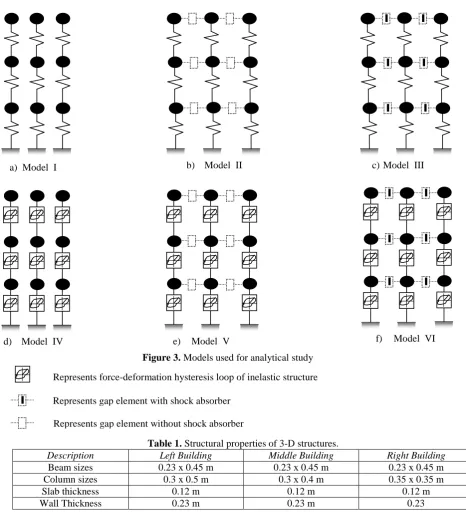
A total of six models have been prepared and studied in MATLAB, their details are given below and in Figure 3.
a) Model I – Elastic MDOF structure not subjected to pounding and also without shock absorber. b) Model II - Elastic MDOF structure subjected to pounding but without shock absorber.
c) Model III – Elastic MDOF structure subjected to pounding and also with shock absorber.
d) Model IV – Inelastic MDOF structure not subjected to pounding and also without shock absorber. e) Model V – Inelastic MDOF structure subjected to pounding but without shock absorber.
f) Model VI – Inelastic MDOF structure subjected to pounding and also with shock absorber.
m
13m
12m
11k
11k
12k
13c
13c
12c
11Gap
Gap
Gap
m
22m
23m
21k
23c
23k
22c
22k
21c
21Gap
Gap
Gap
k
33c
33m
33m
32m
31k
32k
31c
32c
31Table 1. Structural properties of 3-D structures.
Description Left Building Middle Building Right Building
Beam sizes 0.23 x 0.45 m 0.23 x 0.45 m 0.23 x 0.45 m
Column sizes 0.3 x 0.5 m 0.3 x 0.4 m 0.35 x 0.35 m
Slab thickness 0.12 m 0.12 m 0.12 m
Wall Thickness 0.23 m 0.23 m 0.23
A. STRUCTURAL PROPERTIES FOR MDOF STICK MODELS
m11 = m21 = 173.331 ton, m31= 133.956 ton, k11 = k21 = k31= 555.55x10³ kN/m, m12 = m22 = 175.661 ton, m32=
136.286 ton, k12 = k22 = k32= 355.55x10 3
kN/m, m13 = m23 = 182.041 ton, m33= 140.641 ton, k13 = k23 = k33 =
a) Model I b) Model II c)Model III
Figure 3. Models used for analytical study
Represents force-deformation hysteresis loop of inelastic structure
Represents gap element with shock absorber
Represents gap element without shock absorber
); ( ) ( )
(t 3/2 ct t
2 / 3
) (t
333.472x10³ kN/m, Rayleigh mass and stiffness proportional damping is being used for calculating the damping constants. For first two modes of excitation, the damping ratio is considered constant as 0.05. Pounding forces over all storey levels of the left, middle and right structures are initially being considered as zero in developed MATLAB code.
Where, m11, m21 and m31 is the mass at storey level 1, 2 and roof level of left building, similarly k11, k21 and
k31 is the stiffness of storey 1, 2 and 3 of left building. In the same manner the masses and stiffnesses of middle
and right structures are described and used in the program. All these properties are shown in Figure 2.
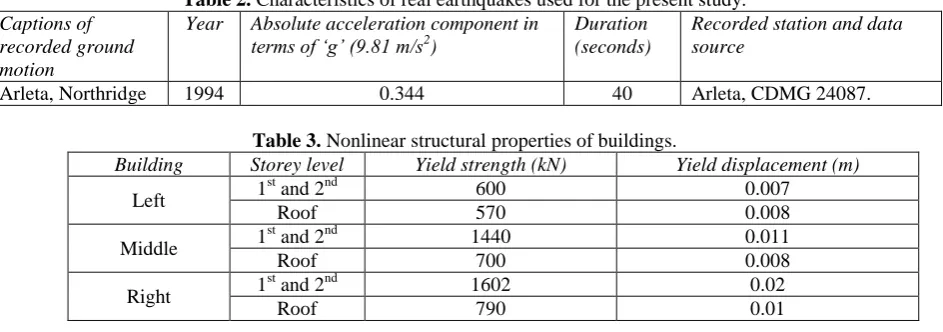
Concrete is a brittle material, which has very complex force-deformation characteristics, but in combination with a sufficient amount of reinforcement it produces good elastic-plastic force-deformation hysteretic behavior. Further, this behavior gets enhanced into a perfectly elastic-plastic force deformation hysteretic behavior in a building because of large number of indeterminacy and rigid connections (Beretero and Popov, 1975). The inelastic properties are worked out after performing a pushover analysis of three dimensional actual structures (As shown in Figure 1) in SAP 2000 NL software.The hinge properties are considered as default M3 hinges for RC beams and P-M2-M3 hinges for RC columns as per FEMA 356 tables and guidelines. The hinges are in accordance with the static design of structures under dead load combination only. The X-direction pushover load case (along the major dimension of building) is considered as pounding seems to be in the same direction. From pushover capacity curves the yield force and yield displacement for all three independent structures is obtained as given in Table 3.
Table 2. Characteristics of real earthquakes used for the present study.
Captions of recorded ground motion
Year Absolute acceleration component in terms of ‘g’ (9.81 m/s2)
Duration (seconds)
Recorded station and data source
Arleta, Northridge 1994 0.344 40 Arleta, CDMG 24087.
Table 3. Nonlinear structural properties of buildings.
Building Storey level Yield strength (kN) Yield displacement (m)
Left 1
st and 2nd 600 0.007
Roof 570 0.008
Middle 1
st and 2nd 1440 0.011
Roof 700 0.008
Right 1
st and 2nd 1602 0.02
Roof 790 0.01
B. GAP ELEMENT PROPERTIES USED FOR IMPACT SIMULATION WITHOUT SHOCK ABSORBER
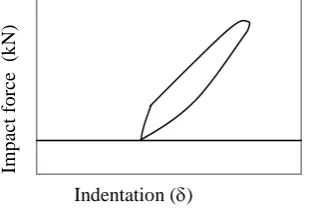
In the present problem the nonlinear viscoelastic contact element is being used for pounding simulations between the adjacent structures in the absence of shock absorber. In pounding, it is expect that the contact area between neighboring structures should be increased as the contact force grows, leading to a non-linear stiffness. In order to model highly non-linear pounding more-accurately, nonlinear viscoelastic model have been developed by Jankowski (2006) as shown in Figure 4 by connecting a nonlinear damper along with the nonlinear spring. The contact force for this model is expressed as:
F(t) =
(t)0 and (t)0 (Approach period)2 / 1 2 1 2 1 2 1 ) ( 3 4 R R R R h h i E i i h 1 , 4 3 i i m R
Where, (t) is the indentation at contact surface, is the impact stiffness parameter and
c
(
t
)
is the impact element damping. Here 𝜉 is an impact damping ratio corresponding to a coefficient of restitution e which can be defined as;Assuming that the colliding structures are spherical of density and the radius Ri estimation can be
calculated as (Goldsmith, 1960):
i = 1,2 (Eqn. 12)
The nonlinear spring stiffness β is linked to the material properties and the radii of the colliding structures as stated through the equation 13 and 14:
Where, h1 and h2 are the material parameters defined by the equation 11:
(Eqn. 13)
i = 1,2 (Eqn. 14)
Here, i and Ei are the Poisson‟s ratio and Young‟s Modulus respectively. The coefficient β depends on
material properties and geometry of colliding bodies. The nonlinear viscoelastic contact law is capable of taking into account energy dissipation during impact phenomenon.In case of pounding, the separation distance between any two collidingMDOF structures is considered as 0.01 m (A very small gap is provided between the adjacent structures that is because in densely populated localities like in oldenIndian cities, the low rise building is mostly constructed much closer to the existing structure). The pounding forces are calculated as per the equation 10 during each time of collision. The coefficient of restitution (e) value is taken as 0.6 for concrete (Jankowski, 2006). ) 16 ) 16 9 ( ( 2 1 2 5 9 e e e 2 1 2 1 ) ( 2 ) ( m m m m t t c (Eqn. 11)
a) Structural configuration of gap element
u
2u
1
Gap
)
(
t
c
Im p ac t f o rce (k N)Indentation ()
b)
Impact force – indentation profile of gap element0 ) 1 ( imp n imp R
imp k C
F
9755 . 0 0025 . 0 7076 . 0 2 1 55 . 1 imp eff imp v m e e
C
C. GAP ELEMENT PROPERTIES USED FOR IMPACT SIMULATION WITH SHOC
K ABSORBER
A critical question raised by the researchers from all around the globe regarding the mathematical simulation of structural pounding by using a rubber as a shock absorber for to mitigate this effect. Whether the available existing impact simulation modeling techniques would allow or predict the true behavior of shock absorber during dynamic loading since rubber have much complex nonlinear stiffness properties. Lot of research has been carried out in the past on this topic by Kajita et al.,(2006), Polycarpou et al., (2013), Anagnostopoulos (1988), and Jankowski et al.,(2000). Kajita et al., (2006) have conducted a static and dynamic collision test between two steel bars of about 300 kg mass of each bar. These bars were forced to collide with each other at a certain velocity with ignoring the friction. The layers of natural rubber as a shock absorber with dimensions 40mm x 40 mm and varying thickness were attached at the collision face of the one of the bar. Some sample experimental results presented by Kajita et al., (2006) have shown in Figure 5 for a rubber bumper of thickness 10 mm with three different velocities. The static test result of the rubber bumper is also included in the same figure. It was observed that the curves obtained for static and dynamic test are not follow the same path. It was also noticed that the impact force generated in the dynamic test are significantly higher than those were obtained in static test. This also indicates that the compressive stiffness of rubber is rate dependent and mostly in exponential form.After attaining the maximum impact force by the bumper during approaching phase, the further values of impact forces are immediately drop down in the restitution phase and it became zero at the end. In restitution phase the pattern is also exponential. The stiffness of rubber became highly amplified after the strain 0.3 in static test.
The impact model for rubber bumper is proposed by Polycarpou et al., (2013) by considering most of the observations of experimental results presents in Kajita et al., (2006)literature. Polycarpou et al., (2013)have developedthe impact model for two phases i.e. approaching phase and restitution phase. In approaching phase a special care for ultimate compressive strain of the material is also taken into account. Since in severe impact once the ultimate strain of the material reach, the stiffness of the rubber is not having significant role in the impact simulationinstead of that the material behind the rubber plays a crucial role in such circumstances. This impact simulation model is depicted in Figure 6, which also shows all these above discussed properties. The impact force penetration relation in approaching phase is denoted by superscript „A‟ can be represented as
It is assumed that after reaching the ultimate compressive strain by the rubber u, the exponential nonlinear
trend of impact force-displacement relationship would change into a linear trend with post yield stiffness kimp_PY,
this post yield bumper stiffness is taken to be equal to nonlinear viscoelastic concrete-to-concrete impact spring stiffness „β‟ (from equation 13).
In restitution phase, the impact force is to be computed by using the equation 16. for (Eqn. 16)
Where, kimp is the impact stiffness constant, in the interpenetration depth, and n is the impact exponent (n
> 1). Dot denotes the first derivation with respect to time. kimp is calculated as
kimp = kst (Eqn. 17)
Where, kst is the static bumper stiffness, is the strain rate-dependent coefficient, normally it is in the range
of 2 and 2.5 (Kajita et al., 2006) for common earthquake induced pounding velocities. Cimp is the damping term,
is given by the formula (Polycarpou et al., 2013) as
(Eqn. 18) u n imp A imp k F for ) -( k k for u im p_PY n u im p u
2 1
2 1
m m
m m
meff
Where, e is the coefficient of restitution (adopted as 0.6 in the entire numerical study), vimp is the
relative impact velocity of colliding bodies just before impact, meff is the effective mass of colliding bodies
calculated as
(Eqn. 19)
In the present case, the value of with shock absorber is adopted as 0.005m, which means the thickness of rubber bumper (tb) is being taken as 0.005m. The value of is chosen as 2.5 for equation 17 and the value of „n‟ is taken as
2.65 for equation 15 and 16. The value of kst is being calculated from experimental results of Kajita et al., (2006) as
given in Figure 5, which obtainsfor the present study (for, = 0.005m and tb = 0.005m) as 5833 kN/m.The
Characteristics of real-earthquake used for the present study is given in Table 3. This recordis taken from the PEER strong motion database (http://peer.berkeley.edu/smcat/). The output of the time history analysis is measured in terms of floor displacement, shear force, and impact forces at the pounding levels for the entire duration of time history at an interval of 0.02 second. The accumulation of total structural energy with respect to time is also plotted for all these structures, under aground motion, for all the models.During collision of structures there is sudden break of momentum of the displacement at the pounding levels which results in large and quick short duration acceleration impulses in the opposite direction causing a greater damage to the structures. To study this effect top floor spectral acceleration curves for all the three adjoining structures under ground excitation are also plotted in respective sections.
a)
Static test of rubber shock absorber
b)
Impact test of rubber shock absorber
Figure 5. Experimental results obtained from Kajita et al., (2006).
a) Attachment of a rubber shock-absorber in a cavity on the building‟s wall
Approach
Restitution
Im
p
ac
t f
o
rce
(F
imp
)
Im
p
ac
t f
o
rce
(Fimp
)
Time (t) b) For Indentation ()
max<u
Im
p
ac
t f
o
rce
(F
imp
)
Time (t)
Im
p
ac
t f
o
rce
(F
imp
)
Indentation () u
c) For max>u
Seismic gap
IV. RESULTS AND DISCUSSIONS
The comparative present study is carried out amongst all the above considered six models for three adjoining structures in ground excitation.
The comparative study for the elastic and inelastic system with and without shock bumper in the absence and presence of pounding is presented in this section. The results of this study are plotted and tabulated as
a) Peak displacements in back and forth direction of applied ground excitations for three considered adjacent structures, and for all models. These plots are given in Figures7.
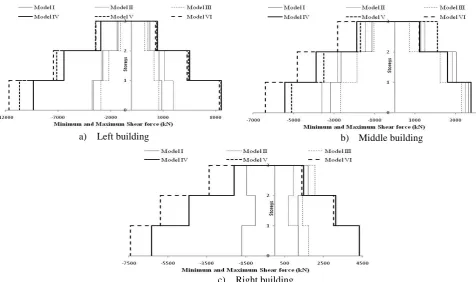
b) Absolute shear forces in back and forth direction of applied ground excitations for three considered adjacent structures, and for all models. These plots can be seen in Figures8.
c) Peak magnitude impact force with total numbers of collisionsunder applied ground motions for all the models. This result is put into a Table 4.
d) Top storey level impactforce versus interpretation depth plots for all pounding subjected models under all ground excitations. Refer Figure 9 for these plots.
e) Spring force versus deformation hysteresis loops of inelastic structures and models for all ground excitations. These loops are presented in Figures 10 to 12.
f) Total structural energy formations with respect to entire duration of time histories for all structures and models are plotted in Figure13.
g) For all the models and structures, top floor acceleration spectra under Arleta ground excitationis plotted, which can be seen through Figure 14.
a) Left building b) Middle building
After assessing the Figure 7, it is observed that middle structure experiences more displacements than left and right structure, irrespective of structure is elastic or inelastic. It is also noticed that the inelastic structure produces more displacements than the elastic structure. In the absence and presence of pounding the displacements not remains identical, however, normally in the absence of pounding the structural displacements was less than the structure with pounding. In the displacement response of structures with and without shock absorber, their is no significant change.
Figures 8, clearly shows that the right structure experiences less shear forces than the middle and left structure because of more stiffness of the structure. Inelastic structure produces more shear forces than that of elastic structure. In left and middle structure, the peak values of shear forces are higher at the base storeys than the upper storeys as expected, but in right structure, this pattern has not been observed that‟s due to the effect of end building pounding in a row. This type of trend is mostly observed in elastic structure than that of inelastic structure. In this ground excitations, the impact forces during the instance of collisions amplify the shear forces in the structures on the sides of pounding. The use of shock absorber is much beneficial for to reduce the shear forces in the structures, as it can be easily seen through plots of shear forces.
Table 4. Peak values of impact force and number of impacts for adjoining stick models.
Input ground motion
Storey levels
Collision between
Model II Model III Model V Model VI
Arleta 1 Left-middle 0 0 0 0.01 (3)
Middle -right 0 0 0 0
a) Left building b) Middle building
c) Right building
2 Left-middle 48 (9) 0.05 (12) 2.42 (1) 0.02 (8)
Middle -right 32.4 (6) 0.09 (14) 42.7 (6) 0.1 (17)
3 Left-middle 84 (16) 0.07 (26) 8.74 (2) 0.5 (14)
Middle -right 102.9 (9) 26.87 (18) 101.8 (7) 36 (20)
* The values in the bracket indicate the number of collisions occurs, whereas above impact force magnitudes are in kN.
Table 4 shows that at the first storey levels of MDOF stick system, pounding forces were not induced in the structures under low and medium ground excitations, like, Arleta. It is observed that top storey produces more impact forces than that of lower ones. Elastic system always produces higher impact forces in magnitudes and in numbers. In low and medium ground excitation, the impact forces offered by the left-middle structural interaction are much severe than the middle-right structural interaction, that‟s because of their low in plane rigidity. But in higher magnitude excitation, the middle–right structural interaction experiences severe impact forces than left-middle structural interaction because of more interpenetration depth of the relative structures. The use of shock absorber proves to be beneficial as it enormously reduces the impact forces in the structures. But the use of rubber bumpers, which reduces the available clearance to 5 mm instead of 10 mm are responsible to increase the total number of impacts. Nevertheless, the softness of rubber elongates the duration of impact forces and reduces substantially the maximum impact forces.
a)
Model II for left-middle interactionb)
Model II for middle-right interactionThe nonlinearity and energy loss associated with impact are illustrated by the impact force versus relative displacement plot.Figure 9 demonstrates that Arleta ground motion produces heavier magnitude impact forces in the structure. With the application of rubber as a bumper damper, the impact forces are spread up for a quite a broad relative displacements due to softness of rubber. The impact force magnitudes are extremely curtail down with the use of shock absorber. The impact force versus interpenetration depth plots are became regular and more consistent with the use of rubber as a shock bumper.
b) Left structure b) Middle structure c) Right structure
After studying the force-deformation hysteretic loops in Figures 10 to 12, it is observed that the left inelastic structure experiences more plastic deformation than other inelastic structures. All inelastic structures left some permanent deformation at the end of the seismic event. It has been found that 1) there is considerable difference in the force-deformation hysteresis loops of inelastic structures, when pounding is ignored or considered,2) there is noticeable difference in the force-deformation hysteresis loops of inelastic structures, when the shock absorber is considered or ignored. Use of shock absorber makes the force deformation hysteresis loops of structure more regular and consistent than that of the structure in the absence of shock absorber.
c) Left structure b) Middle structure c) Right structure
a) Left structure
b) Middle structure
c) Right structure
After interpretingtheFigure13, it is perceived that the right structure absorbs more amount of total structural energy than middle and left structure since of more rigidity, damping and inertia of the structure. It was observed that inelastic structure attracts less structural energy than the elastic structure. Pounding have increases the total strain energy demand in the structures. Formation of total strain energy in the structures depends upon the ground motion characteristics.
a) Left structure
c) Right structure
Figure 14:Top storey level floor acceleration spectra under Arleta ground motion.
From the floor acceleration plot(Figure14), it is identified that the middle structure experiences more amount of acceleration than left and right structures owing to both side pounding effects over the structure. Elastic structures always have peak spectral acceleration values than inelastic structures. Pounding phenomena amongst structures always produces more amount of acceleration than pounding free structures, irrelevant of structural elastic or inelastic behavior. In case of pounding, elastic structures always overestimates the floor spectral acceleration than inelastic structure, that‟s happens due to more number of impact taking place in elastic structure. On the other hand, the inelastic structure undergoes plastic deformation which ultimately leads to less number of contacts with the adjacent structural units. In elastic structure with the use of shock absorber, it happens that the peak floor spectral acceleration values may get on higher sides. However, in the inelastic structure it is observed that spectral acceleration values are significantly lower down with the use of shock absorber. One important observation in inelastic structure is that after attaining the peak spectral acceleration value at some fundamental time period, the further successive values may not easily suppressed down than as that of elastic structure, but it remains constant. In end rigid right structure, the peak spectral acceleration values are spread up into wider band, whereas for other two structures these values are condensed into much narrow bandwidth.
IV. CONCLUSIONS
The behavior of three adjacent MDOF stick systems in the presence and absence of pounding with and without rubber bumper is investigated. The time history analysis is carried out by considering the inputs of four real ground motions. The governing equations of motion of MDOF stick models considering elastic and inelastic behavior are formulated and solved using MATLAB program. Total six models have been compared and studied. Based on the trends of the results, the following precise conclusions can be drawn.
a) The use of rubber shock absorber proves to be much beneficial to reduce the shear forces and displacement response of colliding structures, specifically on pounding subjecting sides of the structures.
c) With the application of shock absorber the magnitudes of impact forces are significantly kept under control during structural pounding, but the numbers may get amplified due to softness of rubber bumper.
d) The structures absorb less amount of strain energy with the application of shock bumper in the structures during pounding. And with the application of rubber bumper in the colliding structures, the floor spectral acceleration values can be significantly lower down.
e) Use of bumper damper makes the force-deformation hysteresis plots more regular and consistent than the system without shock absorber, mostly noticed for flexible systems.
REFERENCES
1) Agarwal, P., Thakkar, S. K. and Dubey, R. N. (2012), “Behavior of building, bridges, dams and ports during Bhuj earthquake of
January 26, 2001,” ISET Golden Jubilee Symposium, October.
2) Anagnostopoulos, S. A. (1988) “Pounding of buildings in series during earthquakes,” ASCE Journal of Structural Engineering and
Structural Dynamics, 16, 443-456.
3) Anagnostopoulos, S.A. and Karamaneas, C. E. (2008), “Use of collision shear walls to minimize seismic separation and to protect
adjacent buildings from collapse due to earthquake-induced pounding,” Journal of Earthquake Engineering Structural Division. (Appeared
online www.interscience.wiley.com), DOI:10.1002/eqe.817.
4) Bertero, V. V. and Collins, R. G. (1973) “Investigation of the failures of Olive view stair towers during the San Fernando earthquake
and their implications on seismic design,” Report no. EERC 73-26, Earthquake Engineering Research Center, University of California, Berkeley, CA.
5) Bhaskararao, A. V. and Jangid, R. S. (2006), “Seismic response of adjacent buildings connected with friction dampers,” Springer
Bulletin of Earthquake Engineering, 4, 43-64.
6) Jain, S. K., Lettis, W. R. , Murty, C.V.R. and Bardet, J. P. (2002), “Bhuj, India earthquake of January 26, 2001 reconnaissance report,”
Public No-2-01, Earthquake Engineering Research Institute (EERI), Oakland, CA.
7) Jankowski, R. (2006) “Pounding force response spectrum under earthquake excitation,” Engineering Structures, 28, 1149-1161.
8) Jeng-Hsiang, L. (2005), “Evaluation of seismic pounding risk of buildings in Taiwan,” Journal of Chinese Institute of Engineers, 28(5), 862-872.
9) Kajita, Y., Kitahara, T., Nishimoto, Y. and Otsuka, H. (2006), “Estimation of maximum impact force on natural rubber during collision
of two steel bars,” First European Conference on Earthquake Engineering and Seismology (1st ECEES), Geneva, Switzerland, September
3-8.
10)MATLAB (2009) “The Language of Technical Computing, Getting started with MATLAB,” Version R2009b, The Mathworks.
11) Patil, U. S. (2004), “Risk reduction in school buildings against earthquake,” New Zealand Society of Earthquake Engineering (NZSEE)
Conference, 42-44.
12)Polycarpou, P. C., Komodromos, P. and Polycarpou, A. C. (2013), “A nonlinear impact model for simulating the use of rubber shock
absorbers for mitigating the effects of structural pounding during earthquakes, Earthquake Engineering and Structural Dynamics,42, 81-100.
13) Soong, T. T. and Dargush, G. F. (1997), Passive energy dissipation systems in structural engineering, Wiley, Chichester.
14)Wen, Y. K. (1976) “Method for random vibration of hysteretic systems,” Journal of Engineering Mechanics, ASCE, 102(2), 249-263.
15)Yang, Z., Xu, Y. L., and Lu, X. L. (2003), “Experimental seismic study of adjacent buildings with fluid dampers,” ASCE, Journal of