A Survey on Cabinet Tree Based Approach to
Approach Visualizing and Exploring Big Data
Sonali Rokade, Bharat Tidke
PG Scholar, M.E., Dept. of Computer Network, Flora Institute of Technology, Pune, India Assistant Professor, Dept. of Computer Network, Flora Institute of Technology, Pune, India
ABSTRACT: In the real world, hierarchical structures are often very large with thousands or even millions of elements and relationships. Therefore, a capability of visualizing the entire structure while supporting deep exploration at different levels of granularity is urgently needed for effective knowledge discovery. Enclosure or space-filling visualization, such as Treemaps techniques proposes an interesting approach to solve this problem. The Treemap algorithm ensures almost 100% use of the space by dividing it into a nested sequence of rectangles whose areas correspond to an attribute of the dataset, effectively combining features of a Venn diagram and a pie chart. Originally designed to visualize files on a hard drive, Treemaps have been applied to a wide variety of areas ranging from financial analysis, sport reporting, image browsing [9] and software and file system analysis .It has been recognized that besides optimizing aspect ratios, in many applications it is desirable to guarantee constant size and aspect ratios for all of the rectangles to be laid out. This is motivated by supporting visual comparability when displaying multi-dimensional or abstract data types such as images [Bederson et al. 2002] or time series data [Dayal et al. 2005], which call for regularity-providing layout generation algorithms. Consider for example the problem of laying out sets of hierarchically structured time series, or more generally, bar chart data. Then, in order to be able to compare time intervals and value magnitudes, there must not be too many different scales present in the display tessellation
KEYWORD: TreeMap, Cabinet Tree, Granularity, Dataset
I. INTRODUCTION
Much of data we use today has a hierarchical structure. Examples of hierarchical structures include university-department structure, family tree, library catalogues and so on. Such structures not only play significant roles in their own right, but also provide means for representing a complex domain in a manageable form. Current GUI tools, such as traditional node-link diagrams or file browsers, are an effective means for users to locate information, however one major drawback of common node-link representations is that they do not use screen real estate very efficiently.
In the real world, hierarchical structures are often very large with thousands or even millions of elements and relationships. Therefore, a capability of visualizing the entire structure while supporting deep exploration at different levels of granularity is urgently needed for effective knowledge discovery [3]. Enclosure or space-filling visualization, such as Treemaps techniques proposes an interesting approach to solve this problem. The Treemap algorithm ensures almost 100% use of the space by dividing it into a nested sequence of rectangles whose areas correspond to an attribute of the dataset, effectively combining features of a Venn diagram and a pie chart [6]. Originally designed to visualize files on a hard drive [7], Tree maps have been applied to a wide variety of areas ranging from financial analysis, sport reporting [8], image browsing [9] and software and file system analysis [10].
user in a visual form. Visualization supports a human being’s natural capability to recognize visual information quickly.
II. CONTRIBUTION
The primary objective of this research is the effective visualization of large bodies of hierarchically structured information. Effective visualizations of large bodies of hierarchically structured information can help users gain insight into relevant features of the data, construct accurate mental models of the information, and search for regions of particular interest. Current hierarchical display techniques scale poorly and are poor tools for dealing with large hierarchical data sets. In addition to scaling, poorly existing techniques have generally not been designed to deal with multi-dimensional data sets. The algorithms have generally been designed to represent small static hierarchies on pieces of paper. They have not been designed as interactive presentation techniques for large, complex data sets.
The major contributions of this dissertation are the:
Development of a unified theory of containment based hierarchical visualization,
Implementation of interactive treemaps, and
Controlled evaluation of interactive treemaps.
Part of our contribution and a good deal of our motivation has been related to giving treemaps a solid foundation. Establishing the treemap concept as legitimate new child in the evolution of data graphics has provided a unified encapsulation of many previously existing techniques. The idea of representing hierarchy via partitioned rectangles has been extended into a general glyph based multi-variate hierarchical visualization technique capable of partitioning display spaces of arbitrary dimensionality in any coordinate system.
III. RELATED WORK
1. Purpose of study reviewed
Visualization is a key concern for business intelligence and data analysis professionals because it affects how data is provisioned for users and the value they gain from it. In addition, visual data discovery has accelerated the transition toward easy-to-use, self-service visual analysis. As users interact with data visually, they see and then want to explore data relationships between and across standard business and demographic sources, and are increasingly likely to want to integrate non-relational sources such as geospatial data.
2. Existing systems
Visualization of data has been an integral part of scientific research from the earliest times, with visual representations of data appearing in scientific literature from as early as the 10th century (Friendly, 2006). A great number of approaches for data visualization has been introduced since (see Keim, 2001, 2002), with visualization methods most commonly used in our everyday lives, such as histograms and pie charts often encountered in newspaper and weather reports, being in use for more than a century in a nearly unchanged form (Friendly, 2006; Wilkinson and Friendly,2009; Loua, 1873). However, recent technological advances and emergence of large scale data sets have clearly indicated limitation of the existing methods in this new setting (Keim et al., 2006; Vempala, 2012), and there remains a clear need for the development of novel visualization approaches.
(Tenenbaum et al., 2000) or Laplacian eigenmaps (Belkin and Niyogi, 2003), which attempt to project examples to a lower-dimensional, non-linear manifold. However, lower-dimensional projection methods in most cases imply a significant loss of information, and the resulting plots may also be difficult to interpret by non-experts for whom the visualization results are often intended.
IV. EXISTING SYSTEM MECHANISM
1. Problem statement
In the real world, hierarchical structures are often very large with thousands or even millions of elements and relationships. Therefore, a capability of visualizing the entire structure while supporting deep exploration at different levels of granularity is urgently needed for effective knowledge discovery [3]. Enclosure or space-filling visualization, such as Treemaps techniques [4, 5] proposes an interesting approach to solve this problem.
The Treemap algorithm ensures almost 100% use of the space by dividing it into a nested sequence of rectangles whose areas correspond to an attribute of the dataset, effectively combining features of a Venn diagram and a pie chart [6]. Originally designed to visualize files on a hard drive
2. Overview
As an important application issue, scalability refers to the capability of effectively displaying large amounts of data [11]. Pixel is the smallest addressable element in a display device, so screen resolutions become the limiting factor for scalable visualizations. Larger displays with higher resolutions are being developed for visualization [12] (e.g. the large wall at the AT&T Global Network Operations Center [13]). Therefore, scalability for high resolutions and large data sets become crucial for visualizing big data. Much attention has been devoted in recent years to enhance the layout algorithm of Treemaps (e.g., [4–6, 14, 15]). Few studies, however, paid attention to the improvement of interaction techniques for navigating Treemaps or other display properties. Yet, Treemaps are not very convenient for exploring large hierarchies, especially when it is necessary to get access to details [2]. It also requires extra cognitive effort for viewers to perceive and understand the relational structures that are implicit in the enclosure [16]. Hence, the use of other display properties (e.g. color, label) is important for an intuitive visualization and efficient interaction techniques are necessary for navigating large Treemap to view details.
This paper presents a space-filling technique, called Cabinet Tree, for visualizing big Hierarchical data. Our contributions include the following aspects in the design of
2.1 Cabinet Tree:
Interleaved Horizontal-Vertical and explicit drawing of branches and space-optimized layout for leaves, generating a highly compact and intuitive view;
A contrast-enhanced color strategy and color-coded sorting of leaves to reveal visual patterns;
Focus + context based interaction support at different levels of hierarchy;
Quantitative evaluation of scalability for big data (including hundreds of thousands of nodes) with increased resolutions.
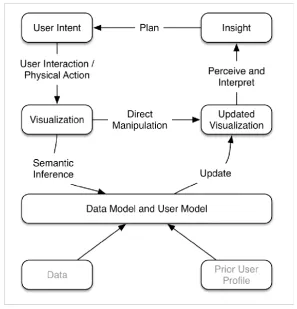
The design of an interactive visualization is often considered as two steps. The first step is to map the relational data into a geometrical plane. i.e. layout. The second step is interaction, i.e. changing views interactively to reach the desired information [17]. However, display properties are also very helpful in providing insights in the hierarchical structure [18]. We review related work on layout design, the use of display properties and interaction design.
2.2 Layout
Fig. 1 Social network data and Treemap
For the promotion of brand, role of marketer is not significant in the modern era of social media. In the past, information was produced by marketers and consumed by customers. Currently more information is generated by customers about brands on social media including blogs, social media networks, online forums etc. Currently marketing teams are struggling in analysis of this online information, which is required for prediction of acceptance rates of products, patterns of purchase and level of satisfaction in customers. Marketers can use these new channels for promotion by developing customers as brand advocates. For travel as well as hospitality industry, decisions related to purchase are mainly determined by online reviews as well as recommendations. Online customer data along with business functions information forms an integrated database. In order to study levels of customer loyalty, study of this integrated database is necessary. It is possible to use customer tree-map for segmenting customers and generation of `brand score' for customers and brand score depends upon (1) Brand engagement of customer behavioural aspect and (2) Attitudes of customers. Two different types of score namely spend value score and advocacy score are calculated using integrated database (traditional CRM and unstructured data). Social CRM tree-map can be created by plotting these scores (by integrating two data-sets) on a 2-D axis [9].
TECHNIQUES OF GRAPH VISUALIZATION
Two Techniques are mainly used for graph visualization 1. Node-Link Technique
V. PROPOSED SYSTEM MECHANISM
5.3.1 Introduction
An unlabeled data pattern and threshold is provided input for the system. In first step, ORCLUS (a subspace clustering algorithm) finds the set of subspaces in the dataset and give the set of subspaces to algorithm as an input and subsequently to split stage where the big clusters are splits into small ones and final output get through the ensemble method. During such scenarios, the need for efficient and perfect clustering technique needs, which will further improves the performance.
5.3.2 Proposed model
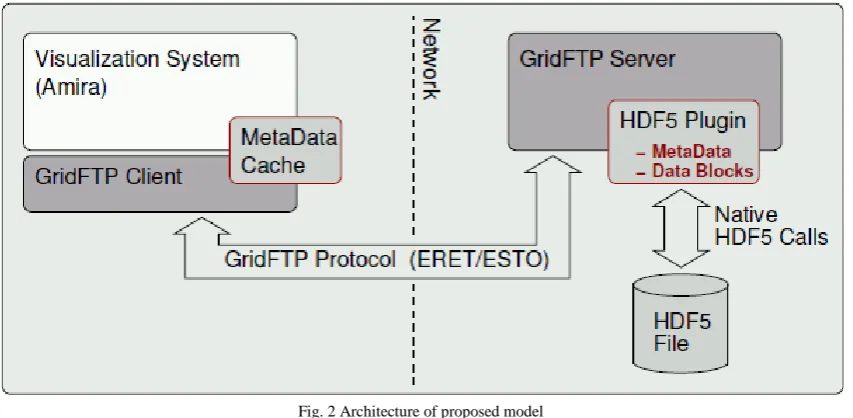
The Architecture of proposed model is shown in the below,
Fig. 2 Architecture of proposed model
Based on the above flowchart of proposed model, the following content will unfold the sub-stages in details:
Stage1. Dataset preprocessing
Import the dataset for clustering and get the information of it as, number of clusters k and the sample number N and the threshold value. And if the dataset contain any missing values replace it with zero and obtain the pre-processed dataset D. (Mostly prefer the real time datasets for more accurate results)
Stage2. The subspace clustering process
Adopt the subspace clustering algorithm - ORCLUS, on the pre-processed dataset D which will take the dataset through following steps and the output will give the subsets of dataset:
VI. CONCLUSION
and data sizes and high layout speed, Cabinet Tree can be considered an effective tool for visualizing huge hierarchical structures in a wider range of applications
REFERENCES
1. McGuffin MJ, Davison G, Balakrishnan R (2004) Expand-Ahead: A Space-Filling Strategy for Browsing Trees. In: Proceedings of IEEE Symposium on Information Visualization, Austin, TX. pp 119–126.
2. Blanch R, Lecolinet E (2007) Browsing ZoomableTreemaps: Structure-Aware Multi-Scale Navigation Techniques. IEEE Trans Vis Comput Graph 13(6):1248–1253.
3. Huang W, Eades P, Hong SH, Lin CC (2013) Improving multiple aesthetics produces better graph drawings. J Vis Lang Comput 24(4):262–272 4. Johnson B, Shneiderman B (1991) Tree-maps: a space-filling approach to the visualization of hierarchical information structures. In:
Proceedings of IEEE Conference on Visualization, Visualization 91, San Diego, CA. pp 284–291
5. Bruls M, Van Wijk JJ, Van Wijk JJ, Huizing K (1999) SquarifiedTreemaps. In: Proceedings of the Joint Eurographics and IEEE TCVG Symposium on Visualization. pp 33–42. doi:10.1007/978-3-7091-6783-0_4
6. Bederson BB, Shneiderman B, Wattenberg M (2002) Ordered and quantum treemaps: Making effective use of 2D space to display hierarchies. ACM Trans Graph 21(4):833–854
7. Shneiderman B (1992) Tree visualization with tree-maps: 2-d space-filling approach. ACM Trans Graph 11(1):92–99 8. Jin L, Banks DG (1997) TennisViewer: a browser for competition trees. IEEE Comput Graph Appl 17(4):63–65
BIOGRAPHY
Sonali S Rokadeis a PG scholar in the Flora Institute of Technology, M.E. Computer Network Department, Pune, Pune University. She has received Bachelor of Information Technology (IT) degree in 2010 from Shivaji University Kolhapur, Maharashtra State, India and currently she is pursuing her Masters education in Computer Networks at Flora Institute of Technology, Pune in Pune University. Her research interests are Big Data (Hadoop), Cloud Computing etc.