Scholarship at UWindsor
Scholarship at UWindsor
Electronic Theses and Dissertations Theses, Dissertations, and Major Papers
1-1-2003
Development of a new durable aluminum-silicon alloy for the next
Development of a new durable aluminum-silicon alloy for the next
generation of engine block casting.
generation of engine block casting.
Robert Ian Mackay
University of Windsor
Follow this and additional works at: https://scholar.uwindsor.ca/etd
Recommended Citation Recommended Citation
Mackay, Robert Ian, "Development of a new durable aluminum-silicon alloy for the next generation of engine block casting." (2003). Electronic Theses and Dissertations. 7202.
https://scholar.uwindsor.ca/etd/7202
Generation of Engine Block Casting
By Robert Ian Mackay
A Dissertation Submitted to the Faculty of Graduate Studies and Research through the Engineering Materials Program of the Faculty of Engineering in Partial Fulfillment of the
Requirements for the Degree of Doctor of Philosophy at the University of Windsor
W indsor, Ontario, Canada, 2003
Published Heritage Branch
395 W ellington Street Ottawa ON K1A 0N4 Canada
Your file Votre reference ISBN: 978-0-494-35075-1 Our file Notre reference ISBN: 978-0-494-35075-1
Direction du
Patrimoine d e I'edition
395, rue W ellington Ottawa ON K1A 0N4 Canada
NOTICE:
The author has granted a non exclusive license allowing Library and Archives Canada to reproduce, publish, archive, preserve, conserve, communicate to the public by
telecommunication or on the Internet, loan, distribute and sell theses
worldwide, for commercial or non commercial purposes, in microform, paper, electronic and/or any other formats.
AVIS:
L'auteur a accorde une licence non exclusive permettant a la Bibliotheque et Archives Canada de reproduire, publier, archiver,
sauvegarder, conserver, transmettre au public par telecommunication ou par I'lnternet, preter, distribuer et vendre des theses partout dans le monde, a des fins commerciales ou autres, sur support microforme, papier, electronique et/ou autres formats.
The author retains copyright ownership and moral rights in this thesis. Neither the thesis nor substantial extracts from it may be printed or otherwise reproduced without the author's permission.
L'auteur conserve la propriete du droit d'auteur et des droits moraux qui protege cette these. Ni la these ni des extraits substantiels de celle-ci ne doivent etre imprimes ou autrement reproduits sans son autorisation.
In compliance with the Canadian Privacy Act some supporting forms may have been removed from this thesis.
While these forms may be included in the document page count,
their removal does not represent
Conformement a la loi canadienne sur la protection de la vie privee, quelques formulaires secondaires ont ete enleves de cette these.
This disseitation is a metallurgical investigation of the A l-9wt.% Si-lwt.% Cu alloys
(known herein as the WA328 (Fe ~ 0.4 wt.%) and WB328 (Fe ~ 0.8 wt.%) alloy). The
WA328 and WB328 alloys will also be investigated for their capacity to replace the
W319 alloy (Al-7wt.%Si-3wt.%Cu alloy) as an engine block cast material.
The main aim of the metallurgical investigation was to understand the role Cu and Si
have on the development of shrinkage porosity in the cast structure, which in turns
controls high cycle fatigue (HCF) properties. In order to achieve this objective a novel
approach using thermal analysis techniques was developed to assess mushy zone kinetics,
the state between the liquidus and solidus where a solid skeletal a-A l phase and an Al-Si
eutectic phase grow at the expense of an interdendritic liquid. Specifically, the cooling
curve and calculated fraction solid curve were partitioned into segments, which reflect
different stages of feeding through the entire solidification event of the alloy. Each
partitioned segment corresponds to a stage of feeding, which in turn signifies a relative
degree of pore growth susceptibility.
The dissertation investigates the viability of the WA328 alloy as a suitable replacement
alloy for engine block applications, namely the V 8 engine block cast at the Nemak
Windsor Aluminum Plant (WAP). A total of forty-three (43) V 8 engine blocks along
with thermal analysis test samples were produced and extensively evaluated using the
aforementioned interpretative techniques of the cooling and fraction solid curves.
WSE-M2A151-A3 requirement. For example, WSE-M2A151-A3 requires that the mean
HCF strength of the bulkhead section of the V 8 engine block must be at least 65 MPa.
However, the production V 8 engine block cast using the W319 alloy attains only a mean
HCF strength of 53.8 ± 3 MPa which is short of achieving what is specified by WSE-
M2A151-A3. V 8 engine blocks cast using the WA328 alloy achieve a mean HCF
strength of 73 ± 4.5 MPa. The improvement in HCF properties for the WA328 alloy was
I dedicate this dissertation to my family, Alward, Yvonne and David Mackay, all of whom
I would like to take this opportunity to thank Dr. J. H. Sokolowski for his support and
guidance throughout the tenure o f this dissertation. Dr. G. Byczynski (Nemak of Canada
Limited), Dr. W. Evans and R. Hasenbusch (Ford M otor Company, Dearborn), are
thanked for providing technical support during the work done on casting the WA328
alloy and WB328 alloy in the Y 8 engine block moulds. D. Cusinato (Nemak of Canada
Limited) is also thanked for his assistance and guidance during work on the V 8 engine
blocks made using the W319 alloy, the WA328 alloy and the WB328 alloy. I would also
like to thank current and former IRC staff and students for their support, most notably Dr.
M. Djurdjevic & Dr. W. Kasprzak. Also thanked for their support and interaction are Dr.
W. T. Kierkus, P. Gallo, M. Paluch and E. Moosberger.
The staff of the University of W indsor Technical Support Centre (TSC) are
acknowledged for their help during the tenure of this thesis project, particularly during
construction of the Enviro-AITAS and the final polishing of the fatigue test specimens. J.
H. Robinson is thanked for assistance with the Scanning Electron Microscope. E. Mares
de la O is thanked for development of the Enviro-AITAS software.
Friendship and support were provided by my girlfriend Karol Witt, by family members
Alan and Janice Cecire, Sharon Taylor, Tom Taylor, and my friends Carolina Polo-
Christy, Graciela Pelayo-Chagoya, Samir Danvantari, Dan Szablewski, Laurie Bams,
Table o f Contents
A b stra c t...I l l
D e d ica tio n ...V
A cknow ledgem ents...VI
L ist o f F ig u re s ... XI
L ist of T ables... XXI
C h ap ter O ne, In tro d u ctio n to Al-Si C ast A lloys... 1-6
1.0 Use of Al-Si Casting Alloys in In du stry... ... 1
1.1 The Casting of Aluminium Engine B locks... 3
1. 1 Focus of this Study...6
C h ap ter Two, L ite ra tu re Review on C ast Solidification... 9-42 2.0 Quiescent Methods of Liquid Metal Filling During the Casting O peration... 9
2.0.1 The Cosworth Precision Sand Process... 9
2.0.1.1 Sand Type Used for the C PSP... 10
2.0.1.2 M elt Treatment at W A P ... 10
2.0.1.3 Casting of a Engine Block via C P S P ... 11
2.1 Chemical Composition of the AA319 & W319 A llo y s...14
2.1.1 Iro n ...15
2.1.2 M anganese ... 15
2.1.3 Zinc...16
2.1.4 B ism uth ... 17
2.1.5 N ick el... 17
2.1.5 Strontium ...18
2.1.6 Antim ony...18
2.1.7 S o d iu m ... 19
2.1.8 Lead & T in ... 19
2.1.9 Titanium & B o ro n ... 20
2.1.10 Zirconium ... 21
2.1.11 Scandium ... 21
2.2 Hydrogen Uptake in Al-Si A llo y ...22
2.2.1 Hydrogen Levels at W A P ... 25
2.3 Source of Hydrogen & Inclusions in Foundry Al-Si M e lts ...27
2.4 Oxides & Inclusions in Al-Si Alloys... 30
2.4.1 Oxide Types in Al-Si M e lts... 30
2.4.2 Titanium Boride Inclusions... 31
2.4.3 Strontium Based Inclusions... 32
2.5 Gas-Shrinkage Pore Nucleation and Growth M echanisms...32
2.6 Mechanism for Feeding During Mushy Zone Solidification...37
2.6.1 Contraction of A1 a-dendrites and the Al-Si Eutectic During Solidification... 37
2.6.2 Modes of Liquid Metal Feeding During Solidification of Al-Si Hypoeutectic A lloys... 39
C h ap ter T hree, L ite ra tu re Review o f F atigue R esistance of Al-Si A llo y s 43-61 3.0 Introduction... 43
3.1 Fundamental of Fatigue F a ilu re ... 44
3.1.0 Stress Conditions with Fatigue...44
3.1.1 Stages of Fatigue Failure... 46
3.1.2 Methods of Crack Propagation M easurem ent...48
3.1.3 Axial Configurations for Fatigue A nalysis... 51
3.1.4 Generation of the S-N C urve... 52
3.1.5 Staircase T e stin g ... 54
3.2 Metallurgical/Structural Factors Affecting Fatigue Crack Growth in Al-Si A lloys... 56
3.3 Effect of Cooling Rate on the Fatigue Crack Growth in Al-Si A llo y s... 61
C h ap ter F our, E x p erim en tal M eth o d o lo g y ...70-101 4.0 Introduction to Experimental M ethodology... 70
4.1 Production Test Alloy Chemistry Specification... 71
4.2 Casting of the V 8 Engine B lock...73
4.3 Heat Treatment of the V 8 Engine B lock... 74
4.4 Description of Test Samples Excised From the V 8 Engine B lo c k ... 75
4.4.1 Metallographic Test Samples A nalysis... 82
4.4.1.1 Phase Identification... 83
4.4.1.2 Porosity M easurem ents... 84
4.4.1.3 Secondary Dendrite Arm Spacing (SDAS) Measurements & Dendrite Cell Size (DCSz) M easurem ents...:...84
4.4.1.4 Quantification of the Area Fraction of Sectioned Primary a-A l Dendrites (A FSP(a-A l))...85
4.4.1.5 Vickers M icrohardness & Brinell Hardness M easurem ents...86
4.7 UMSA Test Sample Quench M ethodology... 92
4.8 Development of an Enviro-AITAS:...94
4.9 Fatigue Testing Procedure... 96
4.9.1 Fatigue Test Sample Soak Time...99
4.10 Monotonic Testing Procedure...101
Chapter Five, Metallurgy o f the AW328 & WB328 A lloys... 102-181 5.0 Chemical Composition of Test A lloys...102
5.1 The Scanning Electron Microscopy (SEM) and Light Optical Microscopy (LOM) Results of the WA328 & WB328 Alloy S tructure... 103
5.2 Thermal Analysis of the WA328 and WB328 Alloys...112
5.2.1 Characteristic Temperature M easurem ents... 117
5.2.2 Partitioned Cooling Curve & Fraction Solid Param eters...121
5.2.3 Heating Behavior of the W319, WA328 & WB328 A lloys... 126
5.3 Mushy Zone Evolution during the Solidification of the WA328, WB328 and W 319 A lloys ... 128
5.3.1 Results of Quenched WA328, WB328 and W319 A lloys... 132
5.3.2 Summary of Phase Nucleation and Solidification Sequence in the WA328 and WB328 A lloys...141
5.3.3 Origins of Polyhedral Si in a Quenched Hypoeutectic Al-Si A lloy...144
5.4 a-Al Dendrite Coarsening During the Solidification Process...147
5.5 Dendrite Ripening in the W319, WA328 & the WB328 A lloys... 154
5.6 Volume Fraction of Dendrites in the WA328 and the W319 A lloys... 160
5.7 Thermal Analysis for Assessing Shrinkage Pore Growth M echanism s...169
5.8 The Contribution of Cu to Pore Development in Al-Si-Cu Based Casting A lloys... 173
5.8.1 The Role of Cu in Porosity Develeopement in the As-Cast W edges 173 5.9 The Effect of Chemistry and Cooling Rate on Mushy Zone Evolution as Determined via Partitioned Thermal Analysis & Fraction Solid Param eters...177
Chapter Six, Integrity of the V8 Engine Block Cast in the WA328 & WB328 A lloys...182-222 6.0 Preliminary D iscu ssio n ... 182
6.1 Assessment of Porosity of the V 8 Engine Block Bulkhead S e c tio n s... 182
6.1.1 Radiographic Examination of the WA328 & WB328 Alloys used to cast in the V 8 Engine B lo ck ...183
6.1.2 Results of Porosity Analysis of the V8 Engine B lo c k ... 185
6.1.3 The Effect of Distribution of Bulkhead Porosity on Fatigue Performance.... 193
6.3 Results of Monotonic Mechanical Testing of the W319 and W A328 A lloy 197
6.4 High Cycle Fatigue R esults...201
6.4.1 Summary of the Staircase R esults... 201
6.4.2 Analysis of the Fatigue Fracture Surfaces... 203
6.4.3 Relationship between Thermal Analysis & HCF Preformance of the V8 Engine B lock... 215
6.5 Hot Tearing Susceptibility of the WA328 A llo y ...222
C h ap ter Seven, Conclusions & F u tu re W o rk ... 227-234 7.0 Concluding R em arks...227
7.0.1 Metallurgical Conclusions... 227
7.0.2 Casting Performance using the WA328 & WB328 A lloys...232
7.1 Future W o rk ... 235
R eferen ces... 237
A ppendix A, Interpretative Thermal Analysis M ethods...253
A ppendix B, Fraction Solid C alculation... 265
A ppendix C, Experimental Method of the Insitu Thermal A nalysis... 273
A ppendix D, Summary of Com positions... 279
A ppendix E, Porosity R esu lts...280
A ppendix F, Enviro-AITAS & UMSA R esu lts... 282
A ppendix G, V 8 Engine Block & UM SA Mechnaical Test D ata...284
A ppendix H, Summary of Riser Sink E valuation... 286
L ist o f F igures
Figure 1.0: Summary of the HCF results of the six alloy compositions investigated by the IRC [20], along with HCF data of wedges from Boileau et.
al. [18]... 5
Figure 2.0a: Schematic depicting the basic functionality of the liquid
processing of the W319. Schematic provided by Byczynski [24]... 13
Figure 2.0b: Schematic depicting the zircon sand mould and mould cavity
reflecting the engine block casting (3.0L V6). The configuration of the
electromagnetic pump orifice and the antenna system which monitors filling
rate is shown. Schematic provided by G. Byczynski [24]...13
Figure 2.1: This graph illustrates the variation between the final percent porosity and the final pore density during cooling with a given solid fraction. Since there is a change in pore density at the H threshold, it is assumed that
the nucleation of the pores is partly dependent on the H content (Reproduced
fro m [5 3 ])... 24
Figure 2.2a: The effect of dissolved hydrogen and the increase of porosity in
the bulkheads 2 and 3 of the 3.0L V-6 engine block [2]... 26
Figure 2.2b: The 3.0L engine block and the location of Bulkheads 2 and 3 ... 26
Figure 2.3a: The formations of the oxide layer on the dross and the reaction
the supplies hydrogen to the melt. Reproduced from [55]...29
Figure 2.3b: The solubility of hydrogen in pure aluminum and the 319 alloy
(Reproducedfrom [2]...29
Figure 2.4a: The Gas-Shrinkage Map, which illustrates the combination of shrinkage stress, and internal gas pressure that can be relived by heterogeneous nucleation from particles present within inter-dendritic region
of the mushy zone [14]... 34
Figure 2.4b: Crevice reducing critical radii (r*) of a pore (Reproduced from
[16])... 36
Figure 2.4c: Schematic of inclusion in interdendritic regions (Reproduced
from [15])... 36
Figure 2.5a: Solidification Contraction of a pure metal. (Reproduced from
Campbell [14])... 38
Figure 2.5b: Schematic of the liquid feeding stage, mass feeding stage, interdendritic feeding stage, solid feeding and complete solidification of a cast
cross-section [66]...42
Figure 3.0: Fatigue test schematics showing the stress nomenclature for a) tension and compression fatigue test, where R = -1, and b) is a tension and
Figure 3.1: A plot of log (da/dN) versus log AK having the sigmodal shape. In region one the crack growth rate decreases with decreasing AK until the threshold region AKth. Region two is the power law region, or sometimes referred to as the Paris regime. Region three is a region of accelerated crack
growth until Kc. The stage three regime is unstable... 49
Figure 3.2: The schematic representation of the effective stress intensity AKeff. In order to fully open a crack a stress Kop must occur above Kmin during the load cycle [80]... 50
Figure 3.3: Example of the S-N curve for an FCC metal (Aluminum) and a BCC metal (Iron) (Example scanned from Boileau [81])... 53
Figure 3.4: Example of the S-N curve for the W319 alloy (Example scanned from Boileau [81])... 53
Figure 3.5: Three fatigue test samples at the beginning of a staircase test. The sequence would continue until the desired number of tests have been completed... 55
Figure 3.6a: The SEM fracture surface of the axial fatigue sample in Table 3.0 having a life of 331, 629 cycles [21]... 57
Figure 3.6b: Region 1 at 5 000X ... 58
Figure 3.6c: Region 1 at 10,000X ... 58
Figure 3.6d: Region 2 at 10,000X... 58
Figure 3.6e: Region 2 at 15,000X ... 58
Figure 3.6f: Region 3 at 5,000X...58
Figure 3.6g: Region 3 at 10,000X... 58
Figure 3.7: A schematic of the wedge casting with chill, riser, down spure and ingate. This wedge was used by Boileau et. al [21] for A356-T6, Boileau et. al [78] for W 319-T6,T7, Canton et. al [22] for W319-T6, and Ren [19] for -(7-9% wt.)Si-(l-4% wt.)Cu synthetic alloys...62
Figure 3.8: Dimensions of the axial fatigue specimen with 28 mm radius polished notched surfaces [22]... 66
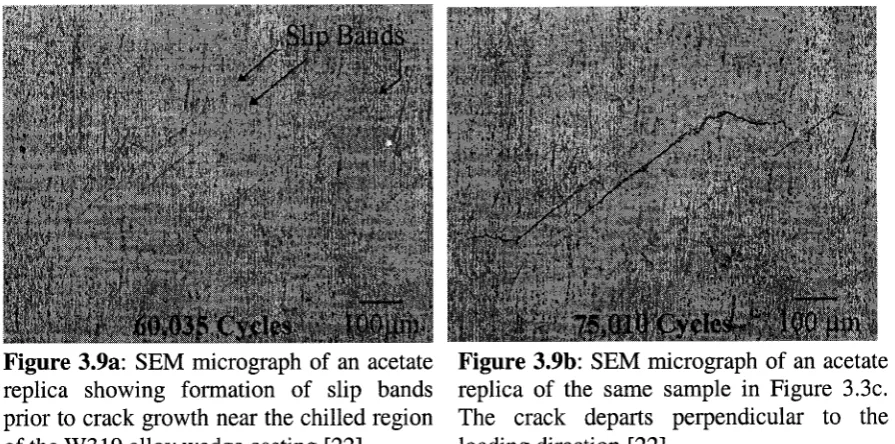
Figure 3.9a: SEM micrograph of an actate replica showning formation of slip bands prior to crack growth near the chilled region of the W319 alloy wedge casting [22]... 67
Figure 3.9b: SEM micrograph of an actate replica of the same sample in figure 3.3c. The crack departs afterwards perpendicular to the loading direction [22]...67
Figure 3.9d: SEM micrograph of a nucleated crack from a A li5(M n,Fe)3Si2 from another W319 wedge sample extracted from the risered end of the wedge
casting [22]... 67
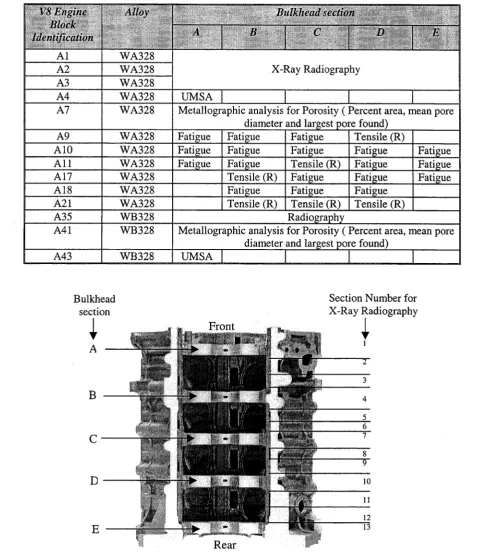
Figure 4.0: The pictograph of the 4.6L engine block and the identification of
the bulkhead sections and the sections that were radiographed... ... 77
Figure 4.1: Bulkhead A of the 4.6L engine block with the outline of where metallographic samples were extricated and the overlay of the location where
UMSA samples were extricated...78
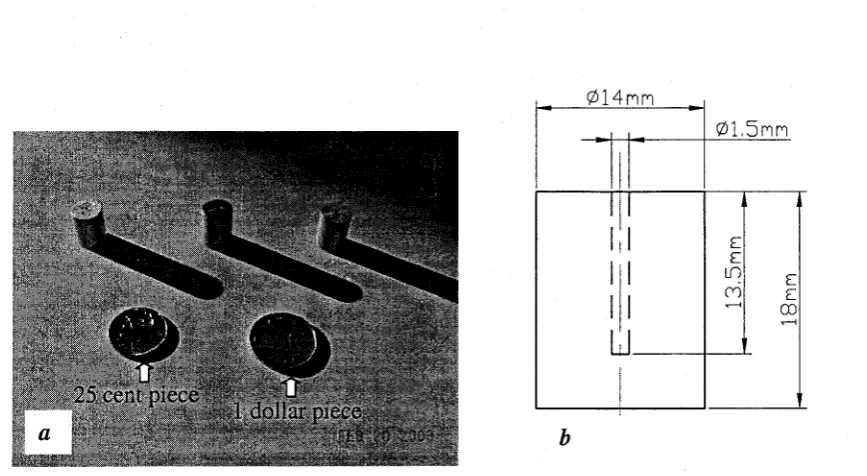
Figure 4.2: a) Pictograph of the UMSA test sample, b) schematic of the
UMSA test sample with dimensions... ...78
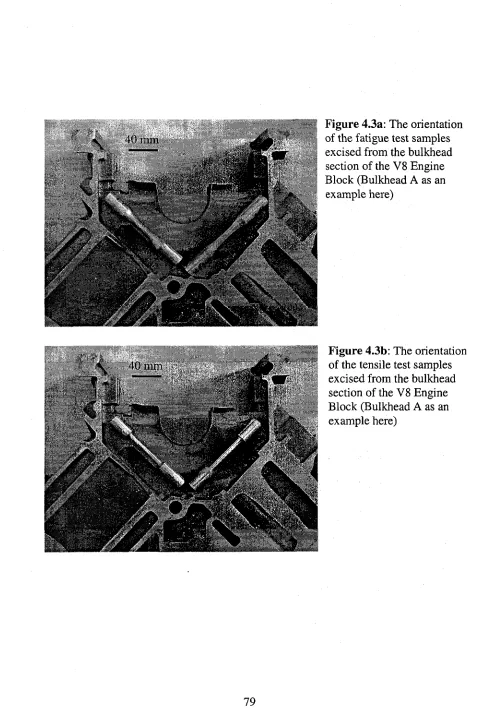
Figure 4.3a: The orientation of the fatigue test samples excised from the
bulkhead section of the 4.6L Engine Block (Bulkhead A as example here)...79
Figure 4.3b: The orientation of the tensile test samples excised from the
bulkhead section of the 4.6L Engine Block (Bulkhead A as example here)... 79
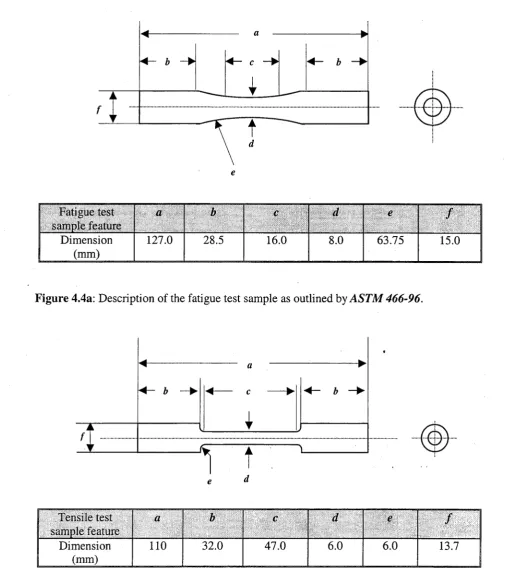
Figure 4.4a: Description of the fatigue test sample as outlined by ASTM 466-
96... ... ... 80
Figure 4.4b: Description o f the tensile test sample as outlined by ASTM E-8... 80
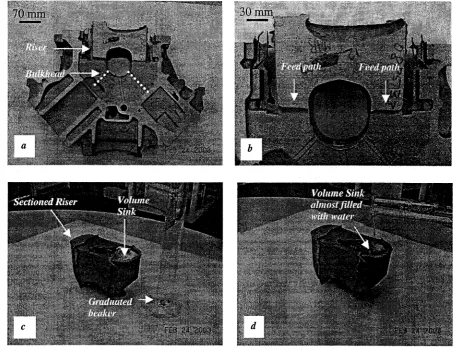
Figure 4.5: a) The view of the riser in relation to the bulkhead and cylinder cavities, b) a zoom up view of the riser and the sink cavity, c) The riser (from riser D, casting A6) along with graduated cylinder filled with water, d) water deposited within riser open sink until filled to the top o f riser. Once riser filled the remaining water is measured and subtracted from the initial amount prior
to pouring... 81
Figure 4.6: Calibration Line for the 0.062” Acrolab & 0.042” Low Mass
Thermocouple (LM T)... ...88
Figure 4.7: Picture of the Universal Metallurgical & Analyzer (UMSA)
apparatus (Patent number: PCT/CA 02/01903 [91])... 91
Figure 4.8a: Illustration of the quenching setup and a cooling curve showing
the effect on solidification at the point labeled as 1... 93
Figure 4.8b: Picture of the UMSA apparatus (Patent number: PCT/CA 02/01903) with suspension apparatus for quenching. Below the UMSA test
sample is the salt water quench... 93
Figure 4.9: Cad-Key drawing of the Enviro-AITAS. 1.) Bottom plate, 2.) Lower insulator/TA sample cup holder, 3.) Lower chamber wall, 4.) Lower chamber shroud, 5.) Compressed air flow vent, 6.) Thin walled steel cup, 7.) Upper insulator, 8.) Pressurizing chamber 9.) Back plate attached to
pneumatic pump...95
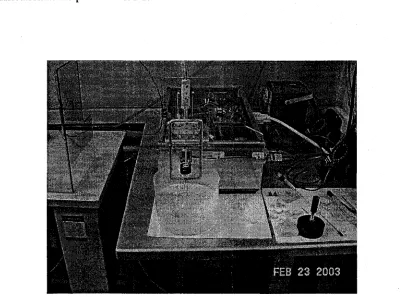
environmental test chamber and temperature controller, d) entire test frame and environmental test chamber in view, e) Load frame, environmental test chamber, Fluke Data logger for strain gauge test sample and Man-Machine- Interface (MMI) and PC for load and strain rate control, f) M ounted strain
gauge test sample... 98
Figure 4.11: Rate of heating for the test fatigue sample and the enviromental test chamber... 100
Figure 4.12: a) View of the load frame with mounted tensile test sample with extensometer, and b) Zoom up of the extensometer mounting on the tensile test sample prior to the start of a test... 101
Figure 5.1(a-f): SEM/BSE micrographs and LOM micrographs for the WA328 alloy (a, c, e) and the WB328 alloy (b, d, f) at low m agnification... 108
Figure 5.1(g-l): SEM/BSE micrographs of the as-cast and heat treated WA328 and WB328 alloys... 109
Figure 5.1m: EDX spectra for the A li5(Fe,Mn,Cr)3Si2 script phase seen in Figure 5.1a... ... 110
Figure 5.1n: EDX spectra for the Al-Ni-Cu phase seen in Figure 5.1g... ... . 110
Figure 5.1o: EDX spectra for the Al-Ni-Fe phase seen in Figure 5.1g... 110
Figure 5.1p: EDX spectra for the ALCu phase seen in Figure 5.1g... 110
Figure 5.1q: EDX spectra for the M g2Si script phase seen in Figure 5.1g... 110
Figure 5.1r: EDX spectra for the Al-Ni-Cu phase seen in Figure 5.11...110
Figure 5.1 (s-x): LOM micrographs of the as-cast and heat treated WA328 and WB328 alloys... I l l Figure 5.2a: Temperature vs. Time curve obtained by using the UMSA system during heating and cooling cycles for the WA328 Alloy. The main metallurgical reactions during heating and cooling...113
Figure 5.2b: First Derivative vs. Temperature curves obtained using the UMSA system during heating and cooling cycles for the WA328 alloy. The main metallurgical reactions during heating and cooling...114
Figure 5.2c: The Enviro-AITAS test sample of the WA328 alloy cast at NEC. The test sample cooling rate was 0.15°C/sec. Identified is #4-a-A l primary dendritic, #5-DCP, # 6-Al-Si eutectic plateau, #7-Al-Fe-Mg-Si-Cu reactions & # 8-Solidus... 115
Figure 5.2d: The cooling curve of the WA328 alloy along with the calculated fraction solid curve... 115
Figure 5.2e: The UMSA cooling curve and first derivative (for the WA328 alloy) of the characteristic temperature values rpA1-Fe-M?-s,-Cu(one)E NUC 5 'pA1'Fe"Mg'
WA328 alloy) of the characteristic temperature values t A1'Fe'Mg-Sl'Cu(°ne)E Nuc ;
rpAl-Fe-Mg-Si-Cu(two) n r
T ° E,NUcandTSoL... H o
Figure 5.2.1a: The Summary of characteristic temperatures found for WA328
alloy and WB328 alloy using both the UMSA and Enviro-AITAS platform s 120
Figure 5.2.1b: The TaDENNuc and Tai‘Sie,nuc seen on a the binary Al-Si are taken from Enviro-AITAS test samples which were cast along with an OES
disk (See Appendix D). The dashed lines represent the compositional limits of
Si content defined for the WA328 and WB328 alloys as shown in Table 4.1...120
Figure 5.2.2a: The results of the partitioned duration (time) range for the WA328 alloy, the WB328 alloy and the W319 alloy, 1) AtaDENSRAN , 2). At*' Si Sr AtAl-Fe-Mg-Si-Cu 1o/t SRAN & 3) At... SRAN... F igure 5.2.2b: The results of the partitioned temperature range for the WA328 alloy, the WB328 alloy and the W319 alloy, 1) ATaDENSRAN , 2) ATa1‘ S*sran & 3) ATA1-Fe-Mg-Si-CuSRAN... 124
Figure 5.2.2c: The results of the partitioned fraction solid for the WA328 alloy, the WB328 alloy and the W319 alloy, 1) afsaDEN, 2) afsA1_Si & 3) afsA1'Fe' Mg-Si-Cu 2 25 Fig u re 5.2.2d: Summary of the partitioned cooling rates of the a-A l primary dendritic growth stage, the Al-Si eutectic stage and the Al-Fe-Mg-Si-Cu eutectic stage for the WA328 alloy, the WB328 alloy and the W 319 alloy. Also included is the total cooling rate for all three alloys... 125
Figure 5.3a: The four overlays of the UMSA cooling curves of the WA328 alloy. The cooling rate of the quenched event is 60.0°C/sec... 129
Figure 5.3b: The four overlays of the UMSA cooling curves of the WB328 alloy. The cooling rate of the quenched event is 60.0°C/sec... 130
Figure 5.3c: The three overlays of the UMSA cooling curves of the W319 alloy. The cooling rate of the quenched event is 60.0°C/sec... 131
Figure 5.3.1a: WA328 Alloy (100X )... 135
Figure 5.3.1b: W B328 Alloy (500X )... 135
Figure 5.3.1c: WB328 Alloy (2 0 0 X )... 136
Figure 5.3.1d: W A328 Alloy (500X )... 136
Figure 5.3.1e: W319 Alloy (200X )... 137
Figure 5.3.1f: W 3 19 Alloy (5 0 0 X )... 137
Figure 5.3.1g: W A328 Alloy (100X )... 138
Figure 5.3.2h: W B328 Alloy (500X )... 138
Figure 5.3.1i: W 319 Alloy (100X )... 139
Figure 5.3.2k: WA328 Alloy (500X)... .. 140
Figure 5.3.21: WA328 Alloy (500X)... ... ... 140
Figure 5.3.3a: The solidification path that permits the nucleation of polyhedrals of Si. Directly below the equilibrium Al-Si eutectic point (Arrow
1) reflects the path in which polyhedrals nucleate and grow. However the liquid adjacent to the polyhedral will become depleted in Si (Arrow 2). The halo forms around the polyhedral until the composition reaches the skewed
couple zone and then stable Al-Si eutectic forms (Arrows 3 & 4 )...146
Figure 5.3.3: b) The structure of the WA328 alloy quenched at 575°C seen at. The arrows mark to location of polyhedral Si. The dashed box is the zoomed up to 500X in c) polyhedrals seen in the above micrograph encapsulate both
the polyhedral Si crystal and the aluminum a-A l halo ... 146
Figure 5.4a: The plot of mean X2 (± 8.5 pm), DCSz (± 9.5 pm) and Vickers Microhardness (standard deviation listed) of the coarse a-A l dendrites in the
as-cast quenched state of the WA328 alloy and the W 319 alloy... 149
Figure 5.4b: The change of DAS (X2), referenced from various sources listed in Table Six, are displayed in the above graph over large solidification ranges (40 seconds up to 2750 seconds) for the W319 alloy, 356 alloy and WA328
alloy. The best-fitted power equation is identified for each profile... 153
Figure 5.4c: The change of DAS (X.2), referenced from various sources listed in Table Six, are displayed in the above graph over large cooling rates (0.04°C/sec up to 2.5°C/sec) for the W319 alloy 356 alloy and W A328 alloys.
The best-fitted power equation is identified for each profile ... 153
Figure 5.5a: At the first quenched stage the dendrite size distribution results a dendrites with a radii of curvature of their tips. In the above case Ra > Rb. This drives the diffusion paths of solute elements (Si, Cu and Fe) along the diffusion paths indicated, while solvent element (Al) diffuses along the
reverse direction...157
Figure 5.5b: Near then end of solidification for the WA328 alloy dendrites which were free to ripen for most of the solidification time yield the above case where the thinner dendrite has dissolved at the expense of the larger dendrites. The cells are now larger yielding a radius of curvature of Rc, which
is larger than Ra and Rb seen in Figure 5.5a... 157
Figure 5.5c: Total solute content of the W319, the WA328, and the WB328
alloys...158
Figure 5.5d: The change of X2 due to increasing content of a binary alloy of Al with either Si or Cu. The above graph is reproduced from Shivkumar et. al [107]. The best fitted curve along with goodness of fit was not included in the
Figure 5.6a: The level rule is a basic method to quantify the relative amounts of primary a-A l phase and the Al-Si eutectic phase if the initial alloy
composition is known The value are shown in Figure 5.6b... 161
Figure 5.6b: Summary of the four types of measurements or calculations used
to assess the fractional amount of primary a-A l dendrites... 163
Figure 5.6c: The quenched structure at T A1'Sl e,n u c for the WA328 alloy...163
Figure 5.6d: The quenched structure at T A1'Sl e.n u c for the W 319 alloy... 163
Figure 5.6e: Schematic of dendrites which must experience volumetric contraction on cooling. The smaller the volume of the dendrites, as with the WA328 alloy, the lower the hydrostatic stress is exerted on the liquid and
consequently a lowing of the driving force for pore nucleation... 166
Figure 5.6f: The Gas-Shrinkage Map, which illustrates the combination of shrinkage stress, and internal gas pressure that can be relived by heterogeneous nucleation of pores. If the WA328 has a smaller fraction of primary dendrites than the W319 alloy then the contribution of hydrostatc
stress towards pore growth will be less...167
Figure 5.6g: Microstructure of the W319 alloy (quenched at 555°C) at 50X
magnification... 168
Figure 5.6h: M icrostructure of the W319 alloy (quenched at 555°C) at 100X
magnification... 168
Figure 5.7a: The temperature solidification range between the DCP and the nucleation of the Al-Si eutectic, and between the Al-Si nucleation and the Al- Si-Cu eutectic nucleation point, for the Al-7 wt. % Si alloys and the Al-9 wt.
% Si alloys having 1, 2 and 4 wt. % Cu. The standard deviation of each mean
characteristic temperature point in no higher than ± 3.7 °C... 171
Figure 5.7b: The apparent fraction solid of the primary dendritic structure, afsaDEN, and the apparent fraction solid o f the Al-Si eutectic, afsAl-Si , for the Al-7 wt. % Si alloys and the Al-9 wt. % Si alloys having 1, 2 and 4 wt. % Cu. The standard deviation of each mean characteristic fraction solid point is no
more than ± 2.3 %...172
Figure 5.8.1a: Cooling curves of the Al-9wt.% Si-lwt.% Cu alloy and the Al-
9wt.%Si-4wt.%Cu alloy [19, 2 0 ]... 175
Figure 5.8.1b: Cooling curves of the A l-7wt.% Si-lwt.% Cu alloy and the Al-
7wt.%Si-4wt.%Cu alloy [19, 2 0 ] ...175
Figure 5.8.1c: Relationship between Cu based phase(s) area fraction and
SDAS for plates with 7wt%Si in the as-cast condition [19, 20]...176
Figure 5.8.1d: Relationship between Cu based phase(s) area fraction and
SDAS for plates with 9wt%Si in the as-cast condition [19, 20]...176
Figure 5.9a: Labelling of partitioned thermal analysis parameters along a
Figure 5.9b: The cross-section of a simple cast section where one side is the Al-9wt.% Si-lwt.% Cu alloy (WA328) and the other side is the Al-7wt.%Si-
4wt.%Cu alloy (W 319)... 181
Figure 6.1.2a: Bulkhead E with adjoining riser. Note the asymmetry of the riser sink towards the right side of the bulkhead. This implies that the right side of the bulkhead drew more liquid feed than the left side. The dash line
delineates the boundaries between left and right bulkhead and riser...189
Figure 6.1.2b: The level of mean porosity found on both the right and left
side of each bulkhead of the 4.6L engine block cast in the listed conditions. ...189
Figure 6.1.2c: Summary of the Mean Pore Diameter found in Bulkhead A
through to E of the 4.6L engine block...190
Figure 6.1.2d: Summary of the Maximum Pore Diameter Found in Bulkheads A through E of the V 8 engine block. The dashed line with an arrow on the right side represents the maximum pore diameter allowable under the WSE-
M2A151-A3 specification ... 190
Figure 6.1.2e: The section risers of both the W319 alloy and the WA328 alloy, both in the non-grain refined condition. The asymmetry of the riser volume sink, seen in risers B, C, D, E, is present irrespective of alloy
chemistry... 191
Figure 6.1.2f: The summary of volume of riser sink data for both the WA328
and the W319 alloys...191
Figure 6.1.2g: A schematic vertical cross-section (as shown in the picture o f Figure 6.1.2a) showing the configuration between the riser and bulkheads B, C and D. Bulkhead B is the critical bulkhead requiring maximum soundness for the running engine operation. Risers B, C, D, and E contain the asymmetrical nature of the sink. The arrows represent the feed paths that
would occur around the crankshaft passage w ay... .-... 192
Figure 6.1.2h: The difference in mean area fraction percent porosity found on the left side versus the right side of each bulkhead section for the five alloy
conditions investigated... 192
Figure 6.2a: The total cooling rate ( = (TaDENNUC - T SOL ) /( t aDENN u c - tsoO) as
recorded by each thermocouple as a function of distance from the riser
thermocouple. Repeated four times... 196
Figure 6.2b: The layout of the In-situ thermal analysis method used for the
4.6L engine block (Bulkhead E) and the locations from which X2 was
measured...196
Figure 6.4.1a: The fatigue staircase results of the bulkhead sections taken from the W319 alloy [18, 114] and the WA328 alloy all cast from the V 8 engine block. The arrow signifies the mean HCF stress required for the WSE-
Figure 6.4.2a: Sample # 3 failed at a stress of 75.8 MPa & having a life of
2,108,933 cycles... 206
Figure 6.4.2b: Sample # 8 failed at a stress of 75.8 MPa & having a life of
4,933,391 cycles... 206
Figure 6.4.2c: Sample # 13 failed at a stress of 79.2 MPa & having a life of
385,668 cycles...206
Figure 6.4.2d: Sample # 1 1 failed at a stress of 75.8 MPa & having a life of
6,996,681 cycles... 206
Figure 6.4.2e: Sample # 22 failed at a stress of 79.1 MPa & having a life of
4,391,998 cycles... ;...:... 206
Figure 6.4.2f: Sample # 24 failed at a stress of 75.8 MPa & having a life of
789,774 cycles... ... 206
Figure 6.4.2g: (SEM/SE) micrograph taken from the fatigue test sample fracture surface. The stress was at 79.2 M Pa with a life of 385,668 cycles. The
dash boxes are shown in high magnification in Figures 6.4.2h and 6.4.2i... 207
Figure 6.4.2h: (SEM/SE) micrograph showing subsurface pores located
within the fractured region. The dashed region is shown in Figure 6.4.2j... 207
Figure 6.4.2i: (SEM/SE) micrograph showing striations and a possible oxide
within the fatigue fractured region... 208
Figure 6.4.2j: (SEM/SE) micrograph showing the fast fracture (tensile
overload) region just adjacent to the transition line seen in Figure 6 .4 .2 g . ...208
Figure 6.4.2k: (SEM/SE) micrograph taken from the fatigue test sample fracture surface. The stress was at 75.8 MPa & having a life of 4,933,391 cycles. The dash boxes are shown in high magnification in Figures 6.4.21,
6.4.2n and 6.4.2p... .7... 209
Figure 6.4.21: (SEM/SE) micrograph showing subsurface pores located
within the fatigue fractured region...209
Figure 6.4.2m: (SEM/SE) micrograph showing subsurface pores located
within the fractured region. The dashed region is shown in Figure 6.4. l o ... 210
Figure 6.4.2n: (SEM/SE) micrograph showing shrinkage pore located within the fatigue fractured region approximately 1mm from the surface and is
possibly connected to the surface pore seen in Figure 6.4.11 & 6.4.1m...210
Figure 6.4.2o: (SEM/SE) micrograph showing striations (~ 5 pm spacing)
within the fatigue fractured region... 211
Figure 6.4.2p: (SEM/SE) micrograph showing the fast fracture (Tensile
overload) region just adjacent to the transition line... 211
Figure 6.4.2q: (SEM/SE) micrograph taken from the fatigue test sample fracture surface. The stress was at 79.2 M Pa with a life of 385,668 cycles. The
Figure 6.4.2r: (SEM/SE) micrograph showing subsurface pones located
within the fatigue fractured region... 212
Figure 6.4.2s: (SEM/SE) micrograph showing striations (~ 3-5 pm spacing)
within the fatigue fractured region... 213
Figure 6.4.2t: (SEM/SE) micrograph showing Si platelets within the fatigue fractured region. Also seen in the micrograph are striations measuring about 5
p m ...213
Figure 6.4.2u: (SEM/SE) micrograph showing the fast fracture (Tensile
overload) region just adjacent to the transition line seen in Figure 6.4.2q... 214
Figure 6.4.3a: The Mean Area Fraction Porosity of the five bulkhead sections
plotted against the mean HCF for the three conditions shown in Figure 6.4.1a.218
Figure 6.4.3b: The Maximum Pore Diameter of the five bulkhead sections
plotted against the mean HCF for the three conditions shown in Figure 6.4.1a.218
Figure 6.4.3c: Summary of the relationship between HCF and the value of the temperature partitioned parameters. 1) A T aDENsRAN > 2) A T A1' SiSRAN & 3)
ATai-Fe-Mg-Si-Cu
S R A N ... ... ...
Figure 6.4.3d: Summary of the relationship between HCF and the value of the partitioned fraction solid parameters. 1) af®0^ , 2) afA1'Sl & 3) afAI‘Fe'Mg"Sl'
Cu
Figure 6.4.3e: The Gas-Shrinkage Map, modified from Figure 5.7f shows the effect of adding a master alloy addition which in turn adds more Sr-based
inclusions suitable to nucleate pores during solidification... 220
Figure 6.4.3f: The Gas-Shrinkage Map, modified from Figure 5.7f shows the effect of adding a master alloy addition which in turn adds more Ti and/or B
based inclusions suitable to nucleate pores during solidification... 221
Figure 6.5a: The side view of risers B, C and D of the 4.6L engine block castings in the A l-9w t.% Si-lw t.% Cu alloy and the production W 3 19 alloy. The hot tears were only evident in the W319 alloy and are indicated by arrows
in the above picture... 224
Figure 6.5b: Picture of a angle view and side view of riser B from a W319
L ist o f Tables
Table 1.0: The Ford Engineering Material Specification WSE-M2A151-A3. * indicates the portion of the specification used in this dissertation to evaluate the compliance of WA328 and WB328 V 8 engine blocks to W SE-M2A151-
A3... 5
Table 2.0: AA grades of the 319 alloy [30] and the W319 alloy (Ford Engineering Material Specification WSD-M2A151-A3, [17]). Chemical levels
are in w t.% ... 14
Table 3.0: Principle discontinuities that nucleate cracks in A356 alloy with Sr modification. The axial fatigue samples were tested at constant amplitude 133 MPa (R = 0.1) by Gall et. al. [21]. Si modification level not specified but the
Sr addition to the 356 alloy melt was 100 ppm... 57
Table 4.0: Comparison between the AA version and the hybrid version of the 319 and 328 alloys. Wabash Alloys supplied the incoming W A328 and the
WB328 alloy ingot as pre the limit specification listed in this table... 72
Table 4.1: Cost differential of the alloy per 50 million pounds. The cost of 50
million pounds of W319 alloy is $35,000,000.00... 72
Table 4.2: The summary of the heat treatment scheme used for the WA328
alloy, WB328 alloy and the W319 alloy...74
Table 4.3: The identification of the 4.6L engine blocks used for the study
along with the test sample type excised from the bulkhead sections... 77
Table 4.4: Summary of the total volume of all risers of the 4.6L engine block...81
Table 4.5: Summary of the depth of penetration with an incident beam energy
of 20 KeV...83
Table 4.6: Values of the linear fitted lines and the respective goodness of fit
parameter... 88
Table 5.0: Average cast chemistry from OES, wt.% ...102
Table 5.2.1a: The results of the Silicon Equivalent (SiEQ) Calculation (using the compositions measured by OES from the disk test samples) and measured characteristic temperature values from the Enviro-AITAS and the UMSA test.
The results are based on 6 repeats... 119
Table 5.2.3: Summary of the characteristic temperature points from analysis of the heating portion of the UMSA thermal curve.. The heating rate for all
three alloys was 0.50°C/sec. The results are based on 6 rep eats... 127
Table 5.3: The temperature of the quenched test alloy samples... 128
Table 5.3.1: Solidification Sequence Summary of the WA328 alloys cast in
WB328 alloy except for the slight change in characteristic temperatures (see
Appendix F)... 143
Table 5.4a: Coefficients associated with the X2 at a quenched stage of solidification and full solidification time. Its important to point out that the power equation that has been reported within literature is valid even for
partially solidified structures... 149
Table 5.4b: Summary of Fully Solidified Test Sample Conditions used in this work and in the referenced work. The data was used to help compile the
results seen in Figures 5.4c and 5.4d...152
Table 5.5: The calculated equilibrium partition coefficient, k, The slope of the
liquidus line for Si, Cu, Fe, Mg and M n... 158
Table 5.6: Hydrogen Solubility as calculated by the A1SCAN approximation
and assuming a melt temperature of 760°C... 167
Table 6.0: The radiographic results for the 4.6L engine block casting cast in a WA328 alloy and the WB328 alloy. The casting x-ray is identified and the date on which radiographic examination was preformed is also indicated. Refer to Figure 4.0, Chapter Four, for the layout of where radiographic section
are taken on the 4.6L engine block... 184
Table 6.1: Summary of monotonic test results from the 4.6L engine block cast
in the W319 and WA328 alloy after heat treatm ent... 200
Table 6.2: Vickers M icrohardness from the left' Side of the Bulkhead for the W319 alloy, the WA328 alloy and the WB328 alloy. The results contained
herein result from an average of 6 indentations... 200
Table 6.3: Brinell Hardness measured on fatigue test bars excised from the
left side of Bulkhead C of the 4.6L engine block after heat treatment... 200
Table 6.4: Summary of the mean HCF stress found for the investigated
C h apter One
Introduction to A l-S i C ast A llo ys
1.0 Use of Al-Si Casting Alloys in Industry
Al-Si cast alloys have numerous applications in the automotive and aerospace industries.
The use of aluminum cast alloys is expected to increase in these industries in the near future.
The reason for this is that these alloys have many desirable qualities such as a high strength-
to-weight ratio, good castability, excellent corrosion resistance, cosmetic surface quality,
resistance to hot tearing, relatively good thermal conductivity, relatively lower melting
temperatures, good machinability and good weldability. Another important consideration,
other than being lightweight, is that aluminum alloys are comparatively easy to recycle,
which is becoming more important in this era of recyclability and environmental awareness
[1,2, 3].
The Al-Si family of alloys are extremely important in the aluminum casting industry since
they make up 85% or more of the total aluminum cast parts produced [2]. These alloys
usually contain between 5.5 and 12% silicon, and the most common alloying elements are
copper and magnesium [2, 3].
Alterations to the microstructure of an Al-Si alloy, usually composed of an a-A l dendritic
aluminum matrix with the subsequent formation of the Al-Si eutectic structure located in the
certain master alloys to the alloy melt prior to casting. Boron and titanium boride
compounds in the aluminium melt can increase the number of heterogeneous nucleation
sites and refine the grain size [2, 3, 4], The addition of sodium or strontium to the melt can
modify the silicon of the eutectic structure from an acicular to a fibrous morphology [5-12].
Additions of strontium reduce solution heat treatment times [9, 12]. An increase in cooling
rate can result in similar alterations to the microstructure. This variability of microstructure
for the same alloy type via cooling rate or master alloy additions allows aluminium-silicon
alloys to achieve a myriad of physical properties, giving them a wide range of uses in the
automotive, aerospace, and other industry sectors.
The most deleterious microstructural constituent in Al-Si cast alloys is the presence of voids
known as porosity. Porosity usually occurs in Al-Si alloys through the evolution of
segregated hydrogen gas and/or liquid feeding difficulties in the mushy zone during
solidification. Another factor that can control cast structure is the relative shape of Si phases
(part of the main Al-Si eutectic), the size and shape of Fe, Cu, and Mg phases, the condition
of the dendritic matrix, and finally the relative cleanliness of the melt [2, 5,10-14].
The aerospace industry, which uses primary stock cast materials, has driven a large part of
this new knowledge on achieving lower porosity in cast parts. Research in aluminium cast
aerospace parts has been ongoing since the Second World War. For the automotive industry,
the increase in cast aluminium use has occurred in the last two decades, and secondary stock
It should be pointed out that secondary stock materials have technical issues that do not face
primary casting materials such as the effect of residual impurities on the role of pore
development during solidification [1, 3, 6,11,14-16].
Currently the methods of assessing the propensity for stable pore nucleation and growth, as-
cast soundness, and the effect porosity has on cast durability represents the most active area
of research within the automotive casting industry. This dissertation is a contribution to this
intensely studied area of Al-Si casting research.
1.1 The Casting of Aluminum Engine Blocks
The V 8 engine block cast at the Nemak Windsor Aluminum Plant (WAP) has to meet or
exceed the Ford Engineering Material Specification WSE-M2A151-A3 [17] in order to be
deemed acceptable as a powertrain component. Table 1 shows the outline of the WSE-
M2A151-A3 Specification. The current mean High Cycle Fatigue (HCF) stress sustainable
in the V8 engine block casting made using the Ford/Cosworth process is 53.8 MPa [18]
which is lower than specified by WSE-M2A151-A3. The HCF properties of engine blocks
have been found to be controlled by the level of the porosity contained within the bulkhead
section [19-23].
Currently most Light Trucks and Sport Utility Vehicles use cast iron engine blocks which
in turn add weight to the powertrain and thus reduce fuel efficiency. However, the
maximum HCF stress that can be sustained by cast iron engine blocks is superior to what
The NSERC/Nemak-Ford/University of W indsor Industrial Research Chair (IRC) in
Light Metals Casting Technology has undertaken the task of improving engine block
properties including durability. The primary focus of this dissertation is to understand the
role of both Si and Cu in the nucleation and growth of pores during solidification.
Reducing the severity of porosity improves HCF properties.
Six alloy compositions, 7 and 9 wt. % Si alloys each having 1, 2 and 4 wt. % Cu, were
prepared and cast into sand wedges at the Nemak Engineering Centre (NEC). The overall
level of porosity, in terms of pore diameter and area fraction was measured via Image
Analysis (IA) methods for the six alloy compositions [19]. The Al-9wt.% Si-lwt.% Cu
alloy was found to contain the lowest overall level of porosity [19, 20]. HCF analysis of
the wedge castings, at a full reversed cyclic stress (R = -1) of 103 MPa, is shown in
Figure 1.0, confirmed that the Al-9wt.% Si-lwt.% Cu alloy has a higher durability [20].
This dissertation will be an extension of the aforementioned work on wedge castings,
where analysis will be made of the performance of the Al-9wt.% Si-lwt.% Cu alloy in
terms of its castability and HCF performance in a shape casting (V8 engine block). Also,
because this alloy is unreported within the literature and is not used as a production cast
alloy, many of the metallurgical features that are well known for the type 319 and 356
Table 1: The Ford Engineering Material Specification WSE-M2A151-A3. * indicates the portion of the specification used in this dissertation to evaluate the compliance of WA328 and WB328 V8 engine blocks to WSE-M2A151-A3.
Property ASTM
Standard
Value of Specified property
*SDAS (k2) ASTM E 155 Average value of X2 ~ 50 pm
(10 measurements at 100X)
No value of X2 > 60 pm
*Porosity ASTM E 3 No larger than 1% (from afield at 100X)
No pore size > 750 pm
^Ultimate Tensile Strength ASTM B 557 225 MPa
*Yield Stress (0.2% proof) ASTM B 557 200 MPa
*Total Elongation ASTM B 557 1.0%
Compressive Yield Strength ASTM E 9 200 MPa
Shear Stress ASTM B 769 180 MPa
^Hardness HBS 10/500 ASTM E 10 85-115 HBS500
*Fatigue Limit at 107 ASTM E 466 65 MPa
*Modulus of Elasticity ASTM B 557 70 GPa
1 Coefficient of Linear Expansion ASTM E 228 23.1 x KrVK (20-250°C)
| Density ASTM B 311 2.760 g/cm3
1400000
1200000
-§
1000000cs & U © U V 800000 600000 400000
200000
-DAS = 55-65 microns IRC/NEC/WAP
Upper Limit Lower Limit
Max. Stress: 103 Mpa, 15 ksi Sr content = 80-120 ppm Feq. 50 Hz
R = -1 (tension/compression) Test temp.: 120°C
Ford Scientific Research Lab Max. S tress: 140 Mpa, 20 ksi Sr content = 300 ppm Feq. 40 Hz
R = - l (tension/compression) Test temp. Room
Al-9%Si- Al-9%Si- Al-7%Si- Al-7%Si-
l% Cu 4%Cu l% Cu 2%Cu
Al-7%Si- Al-9%Si-
4%Cu 2%Cu
356-T6 356-T6 HIP
1. 1 Focus of this Study
This dissertation will investigate the Al-9wt.% Si-lwt.% Cu alloy’s castability, structural
integrity as an engine block compliant with the Ford Engineering Material Specification
WSE-M2A151-A3 [17], and aspects of its fundamental metallurgy. No published
information pertaining to the in-depth analysis of the Al-9wt.% Si-lwt.% Cu alloy exists
other than what has been published in this dissertation or by the IRC [19, 20].
Throughout this dissertation the Al-9wt.% Si-lwt.% Cu alloy is known by two Fe based
variants: the WA328 alloy (0.40wt.% Fe) and the WB328 alloy (0.80wt.% Fe). The
objectives of this dissertation are:
1) To provide a comprehensive and concise literature review on the solidification
characteristics of Al-Si alloys (Chapter Two) and on the fatigue characteristics of Al-
Si alloys (Chapter Three).
2) To outline the use of existing technical platforms and the new and novel technology
platforms and interpretive methods developed by the IRC to analyze the fundamental
aspects of the metallurgy of the WA328 and WB328 alloys. This analysis will be
presented in Chapter Four. Details of the interpretive methods of cooling curves and
fraction solid curves are shown in Appendix A and the fraction solid calculation is
3) To establish a list of the observable phases in the WA328 and WB328 alloys using
the methods of Light Optical Microscopy (LOM) and Scanning Electron Microscopy
(SEM). This analysis will be presented in Chapter Five.
4) To use two thermal analysis platforms (Universal Metallurgical Simulator &
Analyzer (UMSA) and the Environmental Thermal Analysis System (Enviro-
A1TAS)) and the Silicon Equivalent (SIeq) M ethod to establish the characteristic
temperatures for the WA328 and WB328 alloys. This analysis will be presented in
Chapter Five.
5) To use the UMSA to assess the solidification sequence and fraction solid of the
WA328 alloy and the WB328 alloy. This can be done by quenching the UMSA Test
Sample at strategic solidification stages between the liquidus and solidus. This
analysis will be presented in Chapter Five.
6) To develop interpretive methods of cooling curves and calculated fraction solid
curves, which can indicate the volume fraction of a-A l primary dendrites, the Al-Si
eutectic and the complex eutectics involving Al2Cu, Mg2Si, AlsFeSi, etc., in the
investigated alloys. This analysis will be presented in Chapter Five.
7) To use the interpretive methods outlined in Objective #4 to develop a construct of the
evolving mushy zone for several Al-based casting alloys investigated in this
thermal analysis and fraction solid partitioning techniques a plausable kinetic driving
force for the role of Si and Cu on pore development in cast structures will be
identified. This analysis will be presented in Chapter Five.
8) To study the role of a-A l dendritic growth and coarsening kinetics towards the
porosity formation and the mechanical performance in the W319 alloy, the WA328
alloy and the WB328 alloy. This analysis will be presented in Chapter Five.
9) To cast the WA328 alloy and the WB328 alloy into V 8 engine block moulds, heat
treat at B & W Heat Treat Limited, and then evaluate these V 8 engine blocks in
compliance with Ford Engineering Material Specification WSE-M2A151-A3 and
additional metallurgical characteristics deemed necessary to fully explore the WA328
and WB328 alloys castability as an engine block. This analysis will be presented in
Chapter Six.
10) To assess the High Cycle Fatigue (HCF) for the WA328 alloy and compare it to the
W319 alloy, which is in three conditions: with in-fumace Sr; no grain refiner; and
with in-mould grain refiner. This analysis will be presented in Chapter Six.
11) To correlate HCF characteristics to the level of porosity in the bulkhead section of the
V 8 engine block and in turn correlate the porosity and HCF characteristics to the
partitioned thermal analysis and partitioned fraction solid parameters. This analysis
C h apter Two
L iteratu re R eview on C a st Solidification
2.0 Quiescent Methods of Liquid Metal Filling during the Casting
Operation
There are several variations of quiescent liquid metal filling processes utilized by several
cast houses worldwide. Quiescent mould filling methods are the main driving force for
the Tilt Pouring Permanent Mould (TPPM) casting process, Reduced Pressure Permanent
M ould (RPPM) casting process, Reduced Pressure Sand (RPS) casting process, and
Counter Gravity (CG) casting process. The last two processes are mainly devoted to the
production of complex aerospace A356, A357, D357 aluminum sand castings [24-28]
requiring improved fatigue performance. However for 319 type alloys the TPPM or the
RPPM casting process is used since they are better automated for high production. The
final quiescent cast mould fill method is the Cosworth Precision Sand Process (CPSP)
used mainly for sand automotive castings in Nemak and Ford aluminum casting plants
[29],
2.0.1 The Cosworth Precision Sand Process (CPSP)
The CPSP, used at Nemak’s Windsor Aluminum Plant (WAP), at the Nemak Engineering
Centre (NEC) and at the Ford Motor Company’s Cleveland Aluminum Casting Plant
CPSP was developed in the 1970s as a casting process used to make highly specialized
Formula One engine blocks. The virtues of the CPSP over other non-quiescent mould
filling casting techniques is that the yields are typically 85% or better and that the weight
of the castings is up to 10 to 15% lighter [29], Continuous improvements of the CPSP
method is ongoing; leading towards even higher casting yields and reduced cast weight.
2.0.1.1 Sand Type Used for the CPSP
Zircon sand is used at WAP and NEC while silica sand is used at CACP to make engine
block sand packages. Zircon sand is considerably more expensive than silica sand,
however the cost of using zircon sand is off-set by the fact that its reclamation is near
99.8%, where the remaining 0.2% is lost as fines. In many cases silica sand is difficult to
reclaim. The high reclamation rate allows WAP to minimize its waste substantially when
compared to other automotive sand foundries. Zircon sand has a much lower thermal
expansion which provides exceptional accuracy and minimal core distortion (less than
0.05%), and its heat capacity provides faster alloy cooling than silica sand.
2.0.1.2 Melt Treatment at WAP
The type of metal used at WAP which produces the 2.5L, 3.0L, 3.9L and the 4.6L engine
blocks is a non-grain refined and non-Sr modified W319 alloy (Chemistry shown in
Section 2.1). The W319 is brought into the foundry in ingot form and is charged into the
reverb furnace. The W319 alloy is not grain refined due to the contribution of Ti to the
added due to the fact that Sr leads to an increased propensity for shrink porosity in the
finished casting. Finally chlorine was used as a degassing process for the removal of
hydrogen from the melt. However this also contributed to the pump clogging occurrence
and has since been replaced with argon degassing [30]. An illustration of this process is
shown in Figure 2.0a [24],
The assembled sand mould is then delivered to a 4 station index rollover system. The 4
station index rollover system has 4 fixtures which hold the sand package, and it advances
the package to the pump nozzle connecting it to the main side sprue. The metal is drawn
from a holding well via an electromagnetic pump which is submerged at the middle of
the pump well (see Figure 2.0b [24]). This ensures that the cleanest metal is drawn into
the mould.
2.0.1.3 Casting of an Engine Block via CPSP
The electromagnetic pump programmable logic control (PLC) system controls the fill
rate of the molten metal delivered into the mould with the use of a feedback system. The
fill rate and duration at which liquid metal is delivered into the mould is cast part
dependent. For example the 4.6L engine block requires a fill time ranging from 20 to 22
seconds. The fill rate is monitored by a parallel plate capacitor setup where one side of
the capacitor acts as a stationary antenna and the other is the liquid aluminum within the
mould. As the mould fills the distance between the plate and the aluminum in the mould
flow) or too slow (i.e. cold shuts) the computer control console will adjust the voltage to
the pump accordingly to achieve the predetermined fill rate [24].
The sand package containing the solidified castings is then transported to the Thermal
Sand Removal (TSR) furnace where the zircon sand is reclaimed. After the sand is
reclaimed and partial solutionizing occurs the casting is air quenched. The air quench is
preferred over a water quench since air quench induces less distortion in the casting,
preserves the integrity of the cast iron liners and deters the formation of Zr based sludge
from returning to the remelt. The risers are then removed from the casting and it is then
N 2 gas blanket
launder electromagnetic pump w ell
7.0 m ---:---electromagnetic pump
Figure 2.0a: Schematic depicting the basic functions of the liquid processing of the W319 alloy. Schematic provided by G. Byczynski [24],
mould level sensor time / level
program
1 . 1
electromagnetic pump
2.1 Chemical Composition of the AA319 & W319 Alloys
As stated previously the alloy currently being used to cast aluminum engine blocks at WAP
is the W319 alloy. The W319 alloy is a high Si hybrid version of the AA (Aluminum
Association) designation 319 alloy [31]. Other differences in the W319 alloy when
compared to the various AA 319 grades is the lower Fe content (0.40 wt % max) and the
lower Mg content (0.05 - 0.50 wt. %). Table 2.0 lists the overall chemistry of the W319 (as
listed in the Ford Engineering Material Specification WSD-M2A151-A3 [17]) and the AA
grades of the 319 alloy. It is perceived that the combination of higher Si and lower Fe
provides better castability and mechanical properties in sand cast automotive parts produced
using the CPSP.
Table 2: AA grades of the 319 alloy [31] and the W319 alloy (Ford Engineering Material Specification WSD-M2A151-A3, [17]). Chemical levels are in wt.%.
Alloy Si Fe Cu Mn Mg Ni Zn Ti
319.0 5.5-6.5 1.0 3.0-4.0 0.5 0.1 - 1.0 0.25
319.1 5.5-6.5 0.8 3.0-4.0 0.5 0.1 - 1.0 0.25
319.2 5.5-6.5 0.6 3.0-4.0 0.1 0.1 - 0.10 0.25
A319.0 5.5-6.5 1.0 3.0-4.0 0.5 0.1 - 3.0 0.25
A319.1 5.5-6.5 0.8 3.0-4.0 0.5 >0.1 0.35 3.0 0.25
B319.1 5.5-6.5 1.2 3.0-4.0 0.8 >0.1 0.35 1.0 0.25
B319.2 5.5-6.5 0.9 3.0-4.0 0.8 >0.1 0.35 1.0 0.25
2.1.1 Iron
One of the principal impurity elements in many secondary Al-Si alloys is Fe. Fe results in
the formation of brittle intermetallic compounds. The occurrence of Fe based intermetallics
is less in primary Al-Si alloys since Fe levels are kept below 0.20 wt %. In secondary stock
Al-Si alloys the Fe levels range from 0.20 wt % to 1.0 wt % [31].
Depending on the cooling rate, Fe levels can lead to deleterious secondary phase
constituents within the cast structure at about 0.70 wt. % [31-36]. In Al-Si casting alloys, Fe
reacts with A1 and Si to form a thermodynamically stable phase having the stoichiometry of
Al5FeSi, also known as the [3-phase [31-38]. The morphology of this phase is in platelet
form, but seen as needle-like in a two-dimensional metallographic cross-section [31]. As a
consequence, one of the major difficulties with Al-Si alloys is that Fe, if present in large
enough quantities, can lead to this particular intermetallic having deleterious effects on the
mechanical properties of the cast part [31, 33, 37, 38]. In addition, these compounds are very
hard with the result that machining cast parts with relatively high Fe content can be difficult,
resulting in high casting finishing costs [31].
2.1.2 Manganese
Manganese has very little solubility in A1 and as a consequence Mn in the remaining liquid
will combine with Fe, Si and A1 to produce a different Fe-bearing intermetallic having the
stoichiometry Ali5(Mn,Cr,Fe)3Si2, also known as the a-phase [33, 36, 37, 39]. The
morphology is script shape, but the phase has been shown to have other morphologies such
convert P-phase to a-phase is 1 to 2 [36, 39]. Overall the a-phase is much more compact
and less detrimental to the mechanical properties and slightly improves feeding into
interdendritic channels.
2.1.3 Zinc
15 years ago, Resch et al. [40] performed a study on the mechanical properties of 319, 332
and 333 alloy samples having elevated Zn levels. The result was that incremental
adjustments of Zn from acceptable Aluminum Association limits (less than -1 .0 wt. % [31])
up to 4.1 wt. % actually slightly improved tensile properties, while ductility was largely
unaffected in the T5 and T6 conditions. The final result was that the lower limit of Zn in
these secondary alloys had no real basis in mechanical property deterioration. It was
suggested that since cast houses would find little supporting evidence of the deleterious
effects of elevated Zn on mechanical properties, that a re-evaluation of a realistic upper limit
of Zn in 3xx.x alloys needed to be determined.
Mackay et al. [41] investigated the role of Zn in a base 356 alloy with residual levels up
to 15wt.% Zn. This research was conducted to better understand the basic metallurgy and
solidification kinetics of Al-Si-Zn-Mg alloys. The work was spurred by the previous, but
scanty reports, of superior mechanical properties attained by Al-Si alloys containing
unusually high levels of Zn. Thermal Analysis (TA) was used by the authors to better
understand the solidification kinetics of an Al-7wt.% Si-0.30wt.% Mg alloy having
incremental Zn levels between approximately 0 wt.% and 15 wt.%. The findings of this