Department of CIVIL, CSE, ECE, EEE, MECHNICAL Engg. and S&H of Muthayammal College of Engineering, Rasipuram, Tamilnadu, India
Copyright to IJIRSET www.ijirset.com 171
Implementation of Mining Algorithms for
Improving Efficiencies in Product Session Data
Nikhil Gaikwad1, Gaurav Chavan2, Twinkle Samal3, Avinash Sonule4
B.E Student, Department of Computer Engineering, A.C.Patil College of Engineering, Navi Mumbai, India1, 2, 3, 4
Abstract— For any business output means product should be perfectly formulated which is decided in meeting and to make meeting successful there should be some strategies analysis to review different opinion of different member in meeting, and based upon that product is successful in market or not. First it was given by Anvil tool which was bit difficult to analyze because it was working on gesture recognition and then it worked on tree-based structure mechanism which created and define the sessions so that each session can accommodate the individual’s opinion, and after that session, if rectification is performed, but commands such as propose, acknowledgment, and negative response do not have a fixed structure or a notion that can differentiate them from one another. So in Proposed system we are using various Data Mining algorithms to label the nodes which differentiate from one another. The experimental results show that Threshold value which will decide future step of the product.
Index Terms—Threshold, bayesnet, Human Interaction, ARM, Classification.
I.INTRODUCTION
Meetings and human interactions provides a platform for communicating between members participating in a meeting. During a meeting, several kinds of human interactions may occur. In a particular meeting session following interactions occur: (i) proposing an idea, (ii) positively or negatively reacting to a proposal, (iii) acceptance of a proposal. We use mining methods to gather significant information regarding the success rate of the decision made in a meeting, using pattern detection.
Data mining is useful in discovering valuable information or knowledge from large datasets. Also, frequent pattern mining [1,2,3] is useful in finding frequently occurring patterns from meetings .The discovered interaction patterns helps to:
(i) Check the effectiveness of decisions made in meetings,
(ii) Conclude whether a meeting discussion is fruitful or not and (iii) index meetings for further ease of access in database.
Also existing meeting capture systems could use this technique as a smarter indexing tool to search and access particular semantics of the meetings [4, 5]. Second, the extracted patterns are useful for understanding human interaction in meetings. Now, the problem comes in labeling the patterns as well as analyzing the patterns which are discovered. Inspired by tree-based mining, we are going to use a Fuzzy Apriori-T approach[10] which is intended to address the crisp boundary problem encountered in traditional ARM(Association Rule Mining) along with FP-Tree algorithm separately and analyze the results generated by these algorithms.
The rest of the paper is organized as follows:
In Section 2: we will discuss previous study related to our work. Section 3 briefly introduces existing systems and proposed system. Section 4 contains analysis. Section 5 contains relative acknowledgments. Finally we conclude the paper in Section 6.
II.RELATED WORK
responds to whom in multiparty face-to-face conversations.
Yu et al. proposed a multimodal approach for interaction recognition; they also used a tree-based mining method to discover frequent patterns from human interactions in meetings. Such a method focuses mostly on capturing direct parent-child relations.
III.EXISTING AND PROPOSED SYSTEM
In previous works analysis of human Interactions were done using Apriori algorithm and FITM(Frequent Interaction Tree mining) algorithm[2] .The output was the frequent sets of items.Also Chopper algorithm was used for labelling precisely each node in a Tree. In proposed system we are going through FuzzyApriori-T algorithm. These techniques can be summarized as follows:
3.1 Apriori Algorithm
Apriori [2] is a classic algorithm for frequent item set mining and association rule learning over transactional databases. It identifies the frequent individual items in the database and extending them to larger and larger item sets as long as those item sets appear sufficiently in the database. These frequent item sets determined using Apriori algorithm determines the association rules which highlight general trends in the database: this has applications in domains such as market basket analysis. Each transaction has a set of items (an itemset). Given a threshold , the Apriori algorithm identifies the item sets which are subsets of at least transactions in the database. Apriori tends to use a "bottom up" approach, where frequent subsets are extended one item at a time (a step known as candidate generation), and groups of candidates are tested against the data. The algorithm terminates when no further successful extensions are found. It has some drawbacks viz. Candidate generation generates large numbers of subsets.
3.2 Isomorphic Trees
The main problem comes when we cannot decide if two unordered trees are the same. To define a binary relation isomorphic over non-empty trees, the following rules are considered:
1. A tree with a single node (the root) is isomorphic only to a tree with a single node.
2. Two trees with roots A and B , none of which is a single-node tree, are isomorphic if there is a 1-1 correspondence between the sub-trees of A and of B such that the corresponding sub-trees are isomorphic.
Figure 1: Isomorphic Trees 3.3 Chopper Algorithm
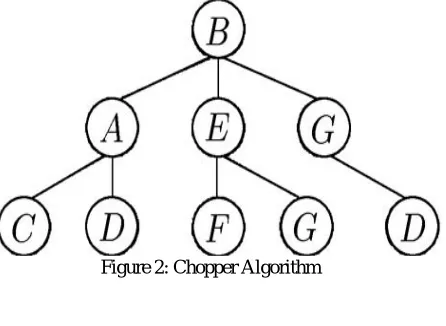
Chopper Algorithm gives the general idea to solve the problem of searching frequent sub-trees. Some properties of an ordered labeled tree will be brought out as follows. We choose the pre-order sequence as the basis of describing an ordered labeled tree, which cannot represent a tree distinctly. Therefore, we have to remember the level number of each element of the sequence in the tree. Thus, we can describe a tree uniquely with the combination of pre-order sequence and level sequence.
For instance, B1A2C3D3E2F3G3G2D3 is used to represent the following tree:
Figure 2: Chopper Algorithm
3.4 FITM
Department of CIVIL, CSE, ECE, EEE, MECHNICAL Engg. and S&H of Muthayammal College of Engineering, Rasipuram, Tamilnadu, India
Copyright to IJIRSET www.ijirset.com 173
siblings to produce the full set of isomorphic trees (ITD). The key principle of generating isomorphic trees is to simplify string matching. Following algorithm generate the isomorphic trees then calculates support values of all trees at Steps 2-3. In Step 4, it selects the trees whose supports are larger than σ and detect isomorphic trees inside them. If m trees are Isomorphic, it selects individual of them and rejects the others. It finally outputs all frequent tree patterns with respect to σ.
3.5 FuzzyApriori-T algorithm[10]
Role of fuzzy sets helps transform quantitative values into linguistic terms, thus reducing possible item sets in the mining process. They are used in the AprioriTid data-mining algorithm to discover useful association rules from quantitative values.
Notation used in this paper is first stated as follows. n: the total number of transaction data;
m: the total number of attributes; D(i) : the i-th transaction datum, 1 ≤i ≤n; Aj : the j-th attribute, 1 ≤j ≤m;
|Aj| : the number of fuzzy regions for Aj ; R jk : the k-th fuzzy region of Aj , 1 ≤k ≤Aj ; V(i)j :the quantitative value of Aj for D
(i)
f(i)j: the fuzzy set converted from V (i)
j. f(i)jk: the membership value of V(i)j. in Region R jk; countjk : the summation of f(i)jk
countj max
: the maximum count value among countjk values, k=1 to |Aj|;
Rj max
: the fuzzy region of Aj with count
α: the predefined minimum support level;
ɣ: the predefined minimum confidence value;
Cr: the set of candidate itemsets with r attributes (items); Cr : the temporary set for recording the fuzzy values of r- items in each data;
Lr : the set of large itemsets with r attributes (items).
The proposed fuzzy mining algorithm first transforms each quantitative value into a fuzzy set with linguistic terms using membership functions. The algorithm then calculates the scalar cardinality of each linguistic term on all the transaction data using the temporary set Cr . Each attribute uses only the linguistic term with the maximum cardinality in later mining processes, thus keeping the number of items the same as that of the original attributes. The mining process based on fuzzy counts is then performed to find fuzzy association rules.
The detail of the proposed mining algorithm is described as follows:
The Algorithm:
INPUT: A body of n transaction data, each with m attribute values, a set of membership functions, a predefined minimum support value α, and a predefined confidence ɣvalue
OUTPUT: A set of fuzzy associate rules.
STEP 1: Transform the quantitative value v(i)j of each transaction datum D(i ) , i=1 to n, for each attribute Aj, j=1 to m, into a fuzzy set f(i)j represented as :
( ) + ( ) +⋯+ ( )
using the given membership
functions, where
Rjk is the k-th fuzzy region of attribute Aj, f(i)jk is v(i)j ‘s fuzzy membership value in region Rjk, and l(=|Aj|) is the number of fuzzy regions for Aj
STEP 2: Build a temporary set C including all the pairs (Rjk , f(i)jk) of each data, where 1≤i≤n, 1≤j≤m, 1≤k≤|Aj|, and f(i)jk≠0.
STEP 3:For each Rjk stored in C , calculate its scalar cardinality for all the transactions from C:
countjk = ∑ f( ).
STEP 4: Find countjmax =
|Aj| MAX k = 1
(countjk), for j=1 to m,
where |Aj| is the member of fuzzy regions for Aj .Let Rj
max
be the region with
count jmax for attribute Aj. Rjmax will be used to represent this attribute in later mining processing.
STEP 5 : Check whether the countjmax of each Rjmax, j=1 to m, is larger than or equal to predefined minimum support value, put it in the set of large 1-itemsets(L1).That is,
L1={Rj max
| count j max
≥α, 1≤j≤m}.
STEP 6: Set r=1, where r is used to represent the number of items kept int the current large itemsets.
STEP 7: Generate the candidate set Cr+1 from Lr. Restated, the algorithm joins Lr and Lr under the condition that r-1 items in the two itemsets are the same and the other one is different. Store in Cr+1 the itemsets which have all their sub-r-itemsets in Lr.
STEP 8: Build an empty temporary set Cr+1 .
STEP 9: Do the following substeps for each newly formed (r+1)-itemsets with items
(s1 , s2 , ..., sr+r1) in Cr+1:
For each transaction datum D (i) , calculate its fuzzy value on s as
f s (i)
= f s1 (i)
Λ f s2 (i)
Λ… Λ f s (i)
using C , where f sj
(i)
membership value D(i) in region Sj.If the minimum
operator is used for the intersection, then f s(i)=
r + 1 Min j = 1
f
sj (i)
.
(b)Store the pair (s, f s(i))of Case I in C , where 1≤i≤n, f s
(i)
≠0.
(c) Set counts=∑ f s(i) using C
(d)If counts is larger than or equal to the predefined
minimum support value α, put s in Lr+1.
STEP 10: IF Lr+1 is null, then do the next step; otherwise, set r=r+1 and repeat STEPs 7 to 10.
STEP 11: Construct the association rules for all large q-item set s with items(s1, s2 ,…,sq), q≥2, using following
substeps :
(a) Form all possible association rules as follows: S1Λ….ΛSk-1Λsk+1Λ… Λsq→sk, k=1 to q.
(b) Calculate the confidence values of all association rules using :
∑ f( )
∑ f( )Λ…Λf( ) , f( ) Λ…Λf( )
STEP 12: Output the rules with confidence values larger
than or equal to the predefined confidence threshold λ.
After STEP 12, the rules constructed are output and can
act as the meta-knowledge for the given transactions. Figure 3: Output of Fuzzy T Apriori Algorithm
IV.ANALYSIS OF VARIOUS ALGORITHMS USED
Analysing Different Algorithm
Naive Bayes
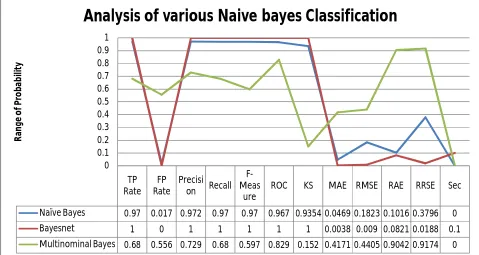
A Naive Bayes[13] classifier is a simple probabilistic classifier based on applying Bayes’ theorem with strong (naive) independence assumptions A more descriptive term for the underlying probability model would be ”independent feature model” An overview of statistical classifiers is given in the article on Pattern recognition In Naive Bayes Algorithm the TP Rate is 0.97 and FP Rate is 0.017 .
Bayesnet
A Bayesian network [13], Bayes network, belief network, Bayes(ian) model or probabilistic directed acyclic graphical model is a probabilistic graphical model In Bayes Net Algorithm the TP Rate is 1and FP Rate is 0.
Department of CIVIL, CSE, ECE, EEE, MECHNICAL Engg. and S&H of Muthayammal College of Engineering, Rasipuram, Tamilnadu, India
Copyright to IJIRSET www.ijirset.com 175
The multinomial Naive Bayes classifier [14] is suitable for classification with discrete features. Algorithm the TP Rate is 0.68 and FP Rate is 0.55
J48
J48 is an open source Java implementation of the C4.5 algorithm in the weka data mining tool. C4.5 is an algorithm used to generate a decision tree. C4.5 is often referred to as a statistical classifier.
SMO
Sequential minimal optimization (SMO) is an algorithm for solving the optimization problem which arises during the training of support vector machines. SMO breaks this problem into a series of smallest possible sub-problems, which are then solved analytically.
Random Forest
Random forests are an ensemble learning method for classification (and regression) that operate by constructing a multitude of decision trees at training time and outputting the class that is the mode of the classes output by individual trees.
Bagging
Bootstrap aggregating (bagging) is a machine learning ensemble meta-algorithm designed to improve the
stability and accuracy of machine learning algorithms used in statistical classification and regression. It also reduces variance and helps to avoid over fitting. Although it is usually applied to decision tree methods, it can be used with any type of method. Bagging is a special case of the model averaging approach.
Ada Boost M1
It is ameta-algorithm, and can be used in conjunction with many other learning algorithms to improve their performance
AdaBoost is adaptive in the sense that subsequent classifiers built are tweaked in favor of those instances misclassified by previous classifiers..
Figure 4: Analysis of various Naive Bayes Classification TP
Rate FP Rate
Precisi on Recall
F-Meas
ure
ROC KS MAE RMSE RAE RRSE Sec
Naïve Bayes 0.97 0.017 0.972 0.97 0.97 0.967 0.9354 0.0469 0.1823 0.1016 0.3796 0
Bayesnet 1 0 1 1 1 1 1 0.0038 0.009 0.0821 0.0188 0.1
Multinominal Bayes 0.68 0.556 0.729 0.68 0.597 0.829 0.152 0.4171 0.4405 0.9042 0.9174 0 0
0.1 0.2 0.3 0.4 0.5 0.6 0.7 0.8 0.9 1
R
an
ge
o
f
Pro
b
a
b
ili
ty
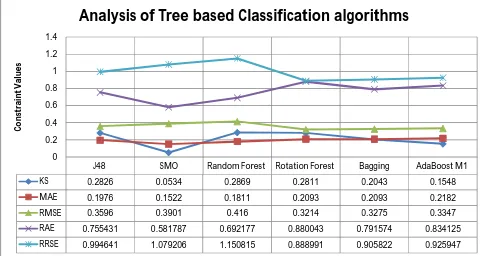
Figure 5: Comparison analysis of Human Interaction dataset by using Tree based classification Algorithms
ACKNOWLEDGMENT
We dedicate this paper to Our HOD Prof. Nitin .P.Chawande, Our Guide Prof.Avinash Sonule and a Special Thank to Mr. Hemant Palivela for giving encouragement to write this paper.
REFERENCES
[1] Ahmed, C.F., Tanbeer, S.K., Jeong, B.-S., Lee, Y.-K.: An
efficient candidate pruning technique for high utility pattern mining. In: PAKDD 2009. LNAI 5476, pp. 749–756. Springer (2009).
[2] Leung, C.K.-S., Mateo, M.A.F., Brajczuk, D.A.: A tree-based
approach for frequent pattern mining from uncertain data. In: PAKDD 2008. LNAI 5012, pp. 653–661. Springer (2008)
[3] Tanbeer, S.K., Ahmed, C.F., Jeong, B.-S., Lee, Y.-K.:
Discovering periodic-frequent patterns in transactional databases. In: PAKDD 2009. LNAI 5476,pp. 242–253. Springer (2009)
[4] W. Geyer, H. Richter, and G.D. Abowd, “Towards a Smarter
Meeting Record—Capture and Access of Meetings Revisited,” Multimedia Tools and Applications, vol. 27, no. 3, pp. 393-410, 2005.
[5] Z. Yu, M. Ozeki, Y. Fujii, and Y. Nakamura, “Towards Smart
Meeting: Enabling Technologies and a Real-World Application,” Proc. Int’l Conf. Multimodal Interfaces (ICMI ’07), pp. 86-93, 2007.
[6] McCowan, L., Gatica-Perez, D., Bengio, S., Lathoud, G.,
Barnard, M., Zhang, D.: Automatic analysis of multimodal group actions in meetings. IEEE TPAMI 27(3), 305–317 (2005).
[7] Otsuka, K., Sawada, H., Yamato, J.: Automatic inference of
cross-modal nonverbal interactions in multiparty conversations: “who responds to whom, when, and how?” from gaze, head gestures, and utterances. In: ICMI 2007, pp. 255–262. ACM (2007)
[8] Waibel, A., Bett, M., Finke, M. Stiefelhagen, R: Meeting browser:
tracking and summarizing meetings. In: DARPA Broadcast News Transcription and Understanding Workshop (1998)
[9] R. Bakeman and J.M. Gottman, Observing Interaction: An
Introduction to Sequential Analysis. Cambridge Univ. Press, (1997.)
[10] A fuzzy AprioriTid mining algorithm with reduced computational
time TP Hong, CS Kuo, SL Wang - Applied Soft Computing, 2004 - Elsevier
[11] Palivela, Hemant, et al. "Novel Approach for Finding Patterns in
Product-Based Enhancement Using Labeling Technique."
Intelligent Computing, Networking, and Informatics. Springer India, 2014. 1249-1256.
[12] Yu, Zhiwen, Zhiyong Yu, Xingshe Zhou, Christian Becker, and
Yuichi Nakamura. "Tree-based mining for discovering patterns of
human interaction in meetings." Knowledge and Data
Engineering, IEEE Transactions on 24, no. 4 (2012): 759-768.
[13] Hemant, Palivela, and Thotadara Pushpavathi. "A novel approach
to predict diabetes by Cascading Clustering and Classification."
Computing Communication & Networking Technologies
(ICCCNT), 2012 Third International Conference on. IEEE, 2012.
[14] Kibriya, Ashraf M., et al. "Multinomial naive bayes for text
categorization revisited." AI 2004: Advances in Artificial Intelligence. Springer Berlin Heidelberg, 2005. 488-499.
J48 SMO Random Forest Rotation Forest Bagging AdaBoost M1
KS 0.2826 0.0534 0.2869 0.2811 0.2043 0.1548
MAE 0.1976 0.1522 0.1811 0.2093 0.2093 0.2182
RMSE 0.3596 0.3901 0.416 0.3214 0.3275 0.3347
RAE 0.755431 0.581787 0.692177 0.880043 0.791574 0.834125
RRSE 0.994641 1.079206 1.150815 0.888991 0.905822 0.925947
0 0.2 0.4 0.6 0.8 1 1.2 1.4
C
o
n
st
ra
in
t V
al
u
e
s