INVESTIGATION
A Novel and Fast Approach for Population Structure
Inference Using Kernel-PCA and Optimization
Andrei-Alin Popescu,* Andrea L. Harper,†Martin Trick,‡Ian Bancroft,†and Katharina T. Huber*,1 *School of Computing Sciences, University of East Anglia, Norwich Research Park, Norwich, Norfolk NR4 7TJ, United Kingdom,
†Centre for Novel Agricultural Products, Department of Biology, University of York, York YO10 5DD, United Kingdom, and‡Department
of Computational and Systems Biology, John Innes Centre, Norwich Research Park, Norwich NR4 7UH, United Kingdom
ABSTRACT Population structure is a confounding factor in genome-wide association studies, increasing the rate of false positive associations. To correct for it, several model-based algorithms such as ADMIXTURE and STRUCTURE have been proposed. These tend to suffer from the fact that they have a considerable computational burden, limiting their applicability when used with large datasets, such as those produced by next generation sequencing techniques. To address this, nonmodel based approaches such as sparse nonnegative matrix factorization (sNMF) and EIGENSTRAT have been proposed, which scale better with larger data. Here we present a novel nonmodel-based approach, population structure inference using kernel-PCA and optimization (PSIKO), which is based on a unique combination of linear kernel-PCA and least-squares optimization and allows for the inference of admixture coefficients, principal components, and number of founder populations of a dataset. PSIKO has been compared against existing leading methods on a variety of simulation scenarios, as well as on real biological data. We found that in addition to producing results of the same quality as other tested methods, PSIKO scales extremely well with dataset size, being considerably (up to 30 times) faster for longer sequences than even state-of-the-art methods such as sNMF. PSIKO and accompanying manual are freely available athttps://www. uea.ac.uk/computing/psiko.
P
OPULATION stratification has been commonly used to investigate the structure of natural populations for some time and is also recognized as a confounding factor in genetic association studies (Knowler et al. 1988; Marchini et al. 2004). As a result, programs for detecting population strat-ification have become a standard tool for genetic analysis. Such approaches generally separate into two classes. Model-based approaches such as STRUCTURE (Pritchardet al.2000) and the closely related ADMIXTURE approach (Alexander et al.2009) are desirable in that they return aQ-matrix, which for each accession of the (marker) dataset indicates the pro-portion of its genotype that came from one ofK$2 assumed founder populations. This biological interpretability ofQ-matrices conveniently lends itself to a subsequent use in associationstudies. On the other hand, such approaches often suffer from long run times, particularly as dataset size increases. This problem is becoming particularly exacerbated with the increased use of next generation sequencing (NGS) and large SNP chips to develop marker datasets (International HapMap Consortium 2007; Kim et al. 2007). Conversely, nonmodel-based approaches such asEIGENSTRAT(Priceet al.
2006), which uses principal component analysis (PCA), tend toward much shorter run times, making them more convenient when analyzing large marker sets. Unfortu-nately, EIGENSTRAT only returns principal components (PCs) of a dataset and not a Q-matrix. Some nonmodel-based approaches such as the recently introduced sparse nonnegative matrix factorization (sNMF) method (Frichot et al. 2014), have made advances regarding these issues and output a Q-matrix for use in association genetic analysis while significantly shortening run times. Like EIGENSTRAT, sNMF can be thought of as a feature extraction approach aimed at reducing the dimensionality of a high dimensional dataset. However, the matrices used by both approaches to achieve this reduction have different mathematical properties (Kim and Park 2007). Even so, sNMF still suffers from longer run times with increased num-ber of markers.
Copyright © 2014 by the Genetics Society of America doi: 10.1534/genetics.114.171314
Manuscript received July 25, 2014; accepted for publication October 11, 2014; published Early Online October 16, 2014.
Available freely online through the author-supported open access option.
Supporting information is available online athttp://www.genetics.org/lookup/suppl/ doi:10.1534/genetics.114.171314/-/DC1.
In this article, we propose the novel PSIKO approach, which is linear-kernel PCA based. Like EIGENSTRAT, PSIKO returns significant principal components of a dataset. Con-trary to EIGENSTRAT, however, it also generates Q-matrices, and these are of comparable quality to those produced by STRUCTURE, ADMIXTURE, and sNMF. In addition, PSIKO’s scaling properties are better than sNMF’s (and thus STRUC-TURE’s and ADMIXTURE’s) when the dataset size increases, making it particularly attractive for large datasets.
We rigorously tested the performance of PSIKO using simulated datasets, designed to evaluate the effects of inbreeding, noise, missing data, and SNP pruning, while enabling us to compare run time and scaling properties in comparison to leading approaches such as STRUCTURE, ADMIXTURE, and sNMF.
Although we simulated a range of biologically motivated scenarios, as a more realistic test, we also assessed the perfor-mance of PSIKO for Q-matrix estimation from two biological datasets. The first of these was a relatively small diversity panel comprising 84Brassica napus lines that had been pre-viously used to perform associative transcriptomics of seed traits (Harperet al.2012). This dataset is of particular interest as it could be considered to have a complex evolutionary his-tory. B. napusis a relatively recently formed species, having arisen from spontaneous hybridization betweenB. rapaandB. oleraceaas little as 10,000 years ago. It exhibits considerable phenotypic variation, includes spring, semi-winter, and winter ecotypes and has been cultivated as both vegetable and oilseed crops. The most intensive breeding occurred over the last 50– 60 years to produce the most commonly used “canola type” oilseed rape cultivars with both low erucic acid and low glu-cosinolate content in the seed. Many of the lines in this bi-ological dataset will have been included in these breeding programs and certain groups (such as the winter oilseed rape lines) may have a complex breeding history. Despite this, the wide diversity of accessions in the panel enabled 101,644 SNP markers to be discovered. Originally the population stratifi ca-tion of this set of accessions was analyzed using STRUCTURE before using the identified Q-matrix in a mixed linear associ-ation model (MLM). We decided to compare the Q-matrices from PSIKO to those of STRUCTURE as well as sNMF and ADMIXTURE, and determine how these Q-matrices affect the results of the MLM for the original seed oil traits.
On its own and in combination with PLINK’s sliding win-dow SNP pruning procedure, we also tested theQ-matrices produced by PSIKO and the three other methods under in-vestigation on a subset of the HapMap Phase 3 project data-set (International HapMap Consortium 2010). This datadata-set should provide a more standard random mating model than the Brassica dataset, while providing an excellent real-life example of the very large marker datasets that will become more common with the advances in sequencing technology.
Materials and Methods
In this section, wefirst provide an outline of PSIKO in terms of a two-step approach and then describe these two steps in
detail. This also includes a brief description of kernel-PCA (Scholkopfet al.1999) as its main underlying technique. We then present details on the simulation experiments and the real biological datasets that we used to assess the perfor-mance of PSIKO, where the former also includes behavior under noise, missing data, inbreeding, large datasets, and SNP pruning. A presentation of PSIKO in terms of pseudo-code may be found in Supporting Information,File S1.
We start with remarking that we follow Engelhardt and Stephens (2010) to infer aSNP matrixfrom a dataset given in terms of a sequence ofd$1 SNPs andn$1 accessions, that is, ad3nmatrix whose entries are 0, 1, and 2. For this, we use a reference sequence and count for each locus of an accession the number of copies of the reference allele found at that locus. Such a reference sequence could, for example, be obtained as in Bancroft et al. (2011) or be one of the accessions present in the dataset.
Method outline
Given a datasetXin the form of ad3nSNP matrix, PSIKO aims to infer the number K of founders of X as well as significant PCs and aQ-matrix. It consists of two main steps: dimensionality reduction (step I) and population structure inference (step II). The purpose of step I is to infer signifi -cant principal components ofXand also obtain an estimate for K. For this we use a combination of the Tracy–Widom test (Pattersonet al.2006) with a powerful PCA-based tech-nique called linear-kernel PCA. Due to the centrality of that technique to PSIKO, we also present an outline of it in that step. The purpose of step II is to quicklyfind good estimates for theancestry coefficients, that is, the entries of theQ-matrix. For this, we exploit the properties of a PCA-reduced dataset to cast the problem of inferring population structure within a least squares optimization framework.
Step I: Dimensionality reduction: PCA is a popular
di-mensionality reduction method that allows one to reduce the number of variables of the input datasetX(given in terms of d), at the same time keeping as much variability in the data as possible. It has proven very useful in population genetics and found in Pattersonet al.(2006) and Ma and Amos (2012) to exhibit desirable properties when applied to datasets contain-ing admixed individuals. However, the inner workcontain-ings of PCA imply that it does not scale well with an increasing number of SNPs. To overcome this problem and thus obtain a method that is applicable to large NGS datasets, we employ a special kind of PCA called kernel-PCA which is known to scale well for large numbers of variables (SNPs in our case) (Murphy 2012). Rather than carrying out a PCA analysis directly on a given dataset, in kernel-PCA that dataset isfirst projected to some new higher dimensional (unknown) feature space, and then classic PCA is applied to the resulting projection of the dataset. To overcome the problem that this projection may be difficult to compute, a technique calledkernel trickis some-times used. Due to its centrality toPSIKO, we next describe it
ForXas above, we start with remarking that if it is cen-tered as described in Price et al. (2006), then performing PCA on it reduces tofinding an eigendecomposition of the d3d-dimensional sample covariance matrixXXT. SupposeW
is the matrix of eigenvectors andLis the diagonal matrix of eigenvalues of such a decomposition. ThenW¼XUL2ð1=2Þ; whereUis the matrix of eigenvectors of then3n-dimensional inner product matrixK =XTXand performing PCA on Xis
equivalent to carrying out an eigendecomposition ofK. SupposeXis projected into a higher dimensional spaceF via a map f, and for all 1 #i#n, putfi :=f(xi). Then
performing PCA on the projection ofXis equivalent to car-rying out an eigendecomposition of the inner product matrix
KF= (hfi,fji)1#i,j#n. Computing these inner products
di-rectly tends to be difficult as the projectionfis unknown. By replacing the inner productshfi,fji ofKFwith the values
k(xi,xj) of a real-valued functionkonX3Xcalled a kernel function, the kernel trick overcomes this problem by allow-ing for computation of said inner products without havallow-ing to directly computef. Informally speaking,kis a proxy for the inner product inF.
To obtain the required lower dimensional dataset, letUF denote the matrix of eigenvectors ofKFin an eigendecom-position ofKF, letLFdenote the associated diagonal matrix of eigenvalues, and letxdenote an accession ofX. Then the kernel-PCA projection ofxiskxUFLF2ð1=2Þ;wherekx= (k(x, x1),k(x,x2),. . .,k(x,xn)). The gain in speed of kernel-PCA over PCA (and thus the ability to cope with large NGS data-sets) is an immediate consequence of the fact that comput-ing KF requires O(n2d) operations and a further O(n3) is required for its eigendecomposition, [as opposed toO(d2n)
and O(d3) for PCA for the corresponding tasks], which
amounts to considerably fewer operations for kernel-PCA whendis much larger thann.
Then for step I we proceed as follows: Wefirst perform a linear kernel-PCA forX, that is, we take the kernel function to be the inner product between accessions ofX. Subsequent to this, we subject the resulting eigenvalues to the Tracy– Widom test to identify significant principal components (see, e.g., Peres-Neto et al.2005) for a survey of attractive alternative approaches). This test has proven very popular in population genetics and relies on the fact that nonzero eigenvalues of a matrix follow a Tracy–Widom distribution. Checking whether an eigenvector is a significant principal component of that matrix or not then reduces to checking whether its associated eigenvalue passes a certain statistical significance test (Pattersonet al.2006).
Step II: Population structure inference:Simulation studies indicate that a PCA-reduced datasetXobtained in step I can be represented in terms of a (K21)-dimensional simplexSK21,
whereK$2 [see,e.g., Figure 2 for examples for the caseK= 3, and Patterson et al. (2006) and Ma and Amos (2012), where this phenomenon has also been observed for general K]. The vertices of such a simplex correspond to the putative foundersof the dataset, that is, its nonadmixed accessions. The
position of an accession relative to these vertices encodes the admixture proportion of that accession in the sense that it can be uniquely expressed as a convex combination of the vertices of that simplex. Put differently, witha1,a2,. . .,aKdenoting the vertices of the simplexSK21representing a datasetXfound in
step I, any of its accessionsxcan be expressed as
x¼XK i¼1
liai;
where, for all 1 #i#K, the quantityli$0 is the genetic
contribution of founder ai to x and PKi¼1li¼1: Thus, the
components of theancestry vectorlx= (ll)1#l#Kofxcan be
thought of as the admixture coefficients ofxand computing them is straight forward using standard arguments from linear algebra if the matrixA= (a1,a2,. . .,aK) of founders is known. If this is not the case then, by viewing the matrix
AQas an approximation of X, the matrix A (and thus the Q-matrix ofX) can be inferred using least squares optimiza-tion. This boils down to minimizing, for a PCA-reduced SNP matrixXfound in step I, the quantity
kX2AQk2F; (1)
with respect to A and Q, where Q = (lx)x2X, and kBkF¼ ffiffiffiffiffiffiffiffiffiffiffiffiffiffiffiffiffiffiffiffiffiffiffiffiffiffiPki¼1
Pt j¼1b2ij q
is the Frobenius norm of a matrix
B= (bij)1#i#k, 1#j#t. A detailed explanation on how
Equa-tion 1 is solved may be found inFile S1.
Simulated datasets and performance measure
In this section, we present an outline of how we generated the various types of datasets underpinning our simulation study for assessing PSIKO’s performance. In addition, we also briefly review the root mean squared error (RMSE) measure, which we use as assessment criterion. We start with providing details concerning our simulation study.
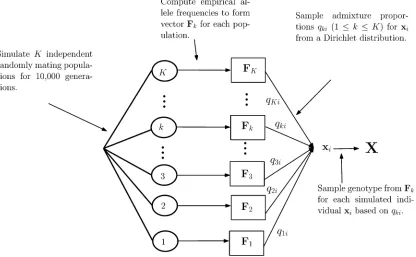
Simulated datasets generation:We used the command
line-based coalescent simulator msms (Ewing and Hermisson 2010) to first simulate founder allele frequencies and then used them to simulate admixture proportions and genotypes of admixed individuals. More precisely, we simulatedK= 3, 4,. . ., 10 independent, randomly mating populations each of which comprised 100 individuals, where by anindividualwe mean a sequence composed ofLloci evolved over a period of 10,000 generations (see File S1 for exact msms commands used). Here, the number of generations is biologically in-spired and the number of individuals and the value K= 3 is based on Alexanderet al.(2009). The values we chose forL were 13,262 [which is as in Alexanderet al.(2009)] and, to shed light on the scalability ofPSIKO, also 100,000, 250,000,
and 2.5 million. We then used these individuals to calculate founder allele frequenciesfk1,fk2,. . .,fkLfor all 1#k#K.
simulated the founderzloflby sampling from a multinomial
distribution with parameter the admixture proportions for individuali. The admixture proportions were sampled from a Dirichlet distribution and represent the contribution of each founder to the dataset. Subsequent to this, we simu-lated the genotype of individualiat locuslby sampling from a multinomial distribution with parameterfzllthe allele
fre-quency of populationzlat locusl(see Figure 1 for a summary
of this two-step process).
We repeated this process 1000 times to obtain an admixed dataset containing 1000 individuals.
Performance measure: To assess the performance of the
four approaches under consideration with regard to their ability to recover the knownQ-matrix underlying a dataset, we used the RMSE between twoQ-matrixQ^ andQ9, given by:
RMSE¼
ffiffiffiffiffiffiffiffiffiffiffiffiffiffiffiffiffiffiffiffiffiffiffiffiffiffiffiffiffiffiffiffiffiffiffiffiffiffiffiffiffiffiffiffiffiffiffi
1 nK
X
i X
k
^ qik2q9ik
2
; s
(2)
wherenrepresents the number of individuals (1000 in our case),Krepresents the number of founders (K= 3, 4,. . ., 10 in our case), and ^qik andq9ik are the elements ofQ^ andQ9
respectively, where 1#i#nand 1#k#K.
Parameter settings: For all our simulation experiments we
used ADMIXTURE and sNMF with their respective default settings, as suggested by their authors. For STRUCTURE, we
used the following settings: We assumed admixed popula-tions with independent allele frequencies. We set the length of the burn-in period to 2000 iterations and ran the program for an additional 2000 iterations after the burn-in period. All remaining parameters were used with default values. To ensure fairness in run time comparison between the above three methods and PSIKO, we only compared their run times for the ground truth value of K, thus ensuring that a single run of PSIKO was timed against a single run of all the other methods.
Biological datasets
To assess the performance of PSIKO with challenging biological datasets, we first performed a comparison of the Q-matrix provided by PSIKO to those estimated using STRUCTURE, ADMIXTURE and sNMF for a set of 84 diverse B. napus accessions as described in Harper et al. (2012). Over half of these accessions are winter oilseed rape (OSR) types (49), but the rest comprise diverse winter fod-der types (5), spring OSR (14), Chinese semi-winter OSR (5), Japanese kale (2), Siberian kale (2), and Swede (7). Q-matrix estimations were compared directly and subse-quently used to perform linear model association mapping following the method outlined in Harper et al. (2012). Briefly, the Q-matrices were used as covariates in general linear models (GLMs), and mixed linear models (MLMs), where a relatedness measure was included as a random ef-fect for two seed oil traits,i.e., erucic acid and glucosinolate content using the program TASSEL (Bradbury et al. 2007).
Figure 1 A summary of how the datasets underpinning our simulation experiments were generated. Each of the 1, 2,. . .,Kencircled values indicates a founder population generated with themsmssoftware. For all 1#k#K, the vectorFkrepresents empirical allele frequencies computed for each of theK
The results of these models were then compared to their P-value expectations. Results were presented as QQ plots showing observed against expected log10P-values for each
of the four stratification methods and each of the seed oil traits and association model types.
To also investigate PSIKOin a human population context,
we applied it to a subset of the HapMap Phase 3 dataset (International HapMap Consortium 2010). That subset com-prised 541 individuals spanning the groupings with the fol-lowing sampling scenarios: African ancestry in Southwest United States (ASW), Yoruban in Ibadan, Nigeria, West Africa (YRI), Utah residents with Northern and Western European ancestry from the Centre d’Etude du Polymorphisme Humain collection (CEU) and Mexican ancestry in Los Angeles, Califor-nia (MEX). Each individual was genotyped over 1,457,897 SNP loci. We remark in passing that the choice of dataset is as in Alexanderet al.(2009) noting, however, that that article used an older version of the dataset and that those sequences had been pruned so that each comprised 13,298 genotyped SNP loci (Alexanderet al.2009). The general understanding of the dataset is that the ASW sample is admixed with ancestries from YRI and CEU and that MEX is admixed with ancestries from CEU and an unsampled founder population (Jakobsson et al.2008; Liet al.2008; Alexanderet al.2009). Therefore the number of founders for this dataset is expected to be three.
Results
Bearing in mind that ADMIXTURE has been shown in Alexanderet al.(2009) to be faster than STRUCTURE, FRAPPE (Tang et al.2005), and INSTRUCT (Gaoet al.2007), and that the recently introduced fastSTRUCTURE approach (Raj et al.2014) has run time comparable to ADMIXTURE (Raj et al.2014), to assesPSIKO’s performance we only compared
it against ADMIXTURE and sNMF and, due to its popularity, STRUCTURE. For this, we used a computing cluster with Intel Sandybridge Dual processor, 8 core E5-2670 2.6 GHz
CPUs and 2 Gb of DDR3 memory at 1066 Mhz, with Intel Hyper-Threading disabled. We simulated different scenarios for how populations might have arisen. These simulation stud-ies are similar in spirit to those performed in Alexanderet al. (2009). Additionally we tested the methods on real biological examples. We start with describing the results of the simula-tion study, which also includes details on the parameters we varied and their ranges. We then present ourfindings for the biological datasets.
Simulated datasets
As outlined above (seeMaterials and Methods) the parame-ters we varied were the number Kof founders and the re-spective Dirichlet distribution parameters for them. Since their choices depend on the values of Kemployed, we will detail them as part of a separate treatment of the casesK= 3 and K $4. Before detailing these cases, though, we re-mark that low values for the Dirichlet distribution pa-rameters correspond to almost admixture-free populations, whereas values close to one correspond to heavily admixed populations. Thus, our simulation study allows us to assess the performances of the methods in question on highly admixed and highly nonadmixed populations. We start our discussion with remarking that the value forKwas correctly recovered by all tested methods for each of the constructed simulated datasets.
For K= 3, and datasets with sequence length 13,262, we chose the same values for the three Dirichlet distribu-tion parameters as in Alexander et al.(2009), resulting in six different simulation scenarios. Three of these scenarios were asymmetric, meaning that in each case at least one Dirichlet distribution parameter was different from the other two and the other three were symmetric, meaning that in each case all Dirichlet distribution parameters were the same. For each of the six scenarios, we generated 100 datasets, resulting in a total of 600 datasets. These we then analyzed with regard to their behavior under PSIKO (see
below), and the average root mean square error for the Q-matrices found by each of the methods considered, where the average is taken over all 100 datasets of a scenario (see Materials and Methods). Furthermore, for each of the three sequence lengths, 100,000, 250,000, and 2.5 million, we generated 10 datasets as before using the symmetric Dir(1, 1, 1) parameter distribution. To assess the effect of SNP pruning, we also generated a further 100 datasets follow-ing a similar protocol (see below for details). Additionally, to test PSIKO’s robustness to deviations from our simula-tion model, we also simulate scenarios with noise, missing data, and inbreeding present.
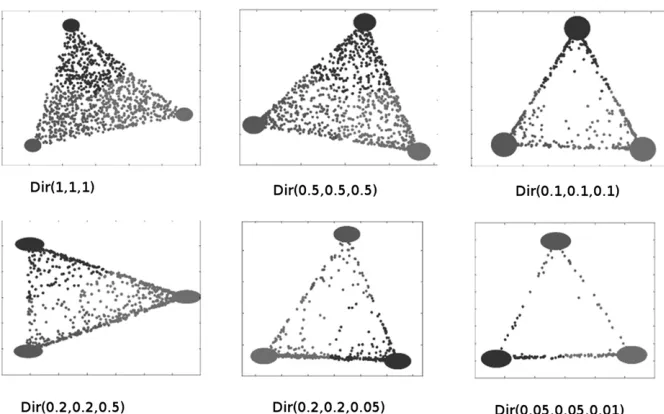
Behavior of a dataset:To investigate the behavior of PSIKO when applied to a dataset generated under each of the six scenarios, we randomly chose one dataset from each. Exploiting the observation that the number of founders of a dataset equals the number of significant principal compo-nents found for that dataset in step I of PSIKO plus one (see, e.g., Pattersonet al.2006), we depict each chosen dataset in terms of a panel containing a two-dimensional coordinate system whose axes are labeled by the two significant principal components found by PSIKO for that dataset (Figure 2). For each coordinate system that makes up that figure, its footer Dir(x,y,z) encodes the simulation scenario used to generate it in terms of the values x,y, and z for the three Dirichlet distribution parameters. For example, the footer Dir(0.2, 0.2, 0.5) of the leftmost coordinate system in the bottom row indicates that two of the three Dirichlet distribution parame-ters had value 0.2 and that the third one had value 0.5.
As expected (see also Pattersonet al.2006), each of the chosen datasets depicted in Figure 2 (after having applied PSIKO to them) corresponds to a 2-simplex with the dots inside the simplex representing the dataset’s accessions. PSIKO infers three founders for each dataset. We indicated them for each dataset in terms of three ellipses. These are clearly very close to the vertices of the simplex representing that dataset and thus the founders of that dataset. Also the figure suggests that the smaller the values for the Dirichlet distribution parameter are, the more the data points get pushed to the simplex’s vertices, which is again as expected. This holds not only for the asymmetric scenarios but also for
the symmetric ones, where the data points get pushed away from the founder with the lowest value. An extreme case in this context is the asymmetric scenario corresponding to Dir(0.05, 0.05, 0.01) as it suggests that one of the founders (i.e., the one corresponding to Dirichlet distribution parame-ter value 0.01) had very little contribution to the represented dataset.
Average root mean square error: We next turn our
attention to assessing the estimated accuracy of PSIKO by measuring the average RMSE between the true and estimated Q-matrices under each one of the six simulation scenarios. For this we used the 600 datasets generated as described above as input to all four methods in question to obtain Q-matrix estimates from each of them. For each method and over all 100 datasets of a scenario, we then computed the average RMSE between the true and estimatedQ-matrices. A summary of our results in terms of these averages is given in Table 1, which consists of six panels each of which corre-sponds to one of our six simulation scenarios. As can be readily observed, all methods seem to be performing similarly well under all simulation scenarios, with negligible differen-ces between their estimates for theQ-matrices.
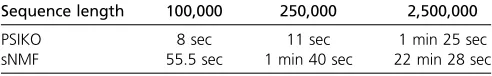
Longer sequences:As can be readily observed from Table 2,
PSIKO is faster than sNMF for each of the three sequence lengths usedi.e., 100,000, 250,000, and 2.5 million (Mate-rials and Methods). [Since it has been shown in Frichotet al. (2014) that ADMIXTURE is slower than sNMF, we only compared PSIKO against sNMF.] In fact, as the length of the sequences grows, so too does the difference in run time between PSIKO and sNMF with that difference being signif-icantly in favor of PSIKO. A possible reason for this might be that PSIKO is based on kernel-PCA, which is known to scale very well with the number of variables of a dataset which, in our case, is the number of SNPs i.e., the sequence length (see also Materials and Methods). This behavior seems to suggest that PSIKO scales better than sNMF with increasing sequence length making it highly attractive for population structure estimation from the very large datasets that are becoming increasingly more common in modern, whole-genome studies.
SNP pruning:A popular way to turn a large SNP dataset into a dataset of more manageable size is to employ linkage disequilibrium (LD) (Purcell et al.2007), which is essentially a measure of how frequently SNPs get transmitted together. This technique, however, has the potential to remove relevant
Table 1 ForK = 3, average RMSEs between true and estimated
Q-matrices for simulated datasets
Asymmetric Dir(0.2, 0.2, 0.5) Dir(0.2, 0.2, 0.05) Dir(0.05, 0.05, 0.01)
PSIKO 0.008 0.007 0.005
ADMIXTURE 0.008 0.005 0.002
sNMF 0.008 0.005 0.002
STRUCTURE 0.053 0.022 0.021
Symmetric Dir(1, 1, 1) Dir(0.5, 0.5, 0.5) Dir(0.1, 0.1, 0.1)
PSIKO 0.011 0.009 0.004
ADMIXTURE 0.018 0.01 0.004
sNMF 0.02 0.013 0.005
STRUCTURE 0.015 0.016 0.03
Table 2 Summarized relative run times of sNMF and PSIKO as averages over all 30 datasets
Sequence length 100,000 250,000 2,500,000
PSIKO 8 sec 11 sec 1 min 25 sec
sNMF 55.5 sec 1 min 40 sec 22 min 28 sec
information thus introducing bias to a dataset. To test the ro-bustness of the three methods with regards to this, we pro-ceeded as follows. ForK= 3 we used msms to simulate 100 datasets each comprising 1000 individuals and 1 million SNPs per individual. From the resulting sequences we then randomly removed 90% of SNPs and then ran PSIKO, ADMIXTURE, and sNMF on the resulting 100 datasets. We found that the average RMSE was below 0.025 for all of PSIKO, sNMF, and ADMIX-TURE, corresponding to at most a 2.5% error in ancestry esti-mates. Once again, all of the tested methods correctly inferred K = 3. The average run times were 3 sec for PSIKO, 7 sec for sNMF, and 30 sec for ADMIXTURE.
Larger values for K: Due to the combinatorial explosion
caused by asymmetric Dirichlet parameter distributions for increasing values ofK, we only considered symmetric Dirich-let distribution parameters for higher values ofK, that is, for Kranging between 4 and 10. For each of these values forK, we chose the same values for the Dirichlet distribution parameters as for the symmetric Dirichlet distribution parameters forK= 3i.e., all 1, all 0.5, and all 0.1.
We found that the performance of each of the methods is comparable for all of the resulting 2100 datasets (see File S1). It is worth noting, however, that the run time of PSIKO is much faster than that of ADMIXTURE (and hence also STRUCTURE), and slightly faster than that of sNMF, with sNMF taking on average 7 sec to complete processing each dataset, PSIKO taking on average 4 sec to complete, and ADMIXTURE taking on average 55 sec to complete.
Noise: Due to the possibility of complex evolutionary
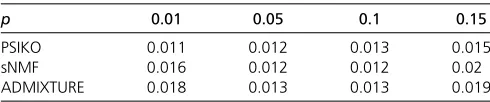
pro-cesses such as hybridization having confounded the co-alescent signal in a dataset, we also tested the robustness of PSIKO for noisy datasets. These we obtained by employing a parameter p that governs the amount of noise that we allowed a dataset’s sequences to contain. More precisely, we started with a dataset obtained for K= 3 and Dirichlet distribution parameters Dir(1, 1, 1) (seeMaterials and Meth-ods for details), and then, for every one of its sequences, flipped on a locus-by-locus basis the allele of that locus with probabilityp. Using this modification process we generated 100 noisy datasets for 1000 accessions at 13,262 loci with noise levelpset to 0.01, 0.05, 0.1, and 0.15, corresponding to 1, 5, 10, and 15% noise, respectively.
As can be readily seen, the difference in the average RMSE between the estimated and true Q-matrix for each approach in question under each of the aforementioned noise levels is marginal (Table 3), suggesting that all
meth-ods are equally robust under the considered simulation sce-narios with the observed differences being marginal.
Missing data: Reflecting the fact that even with current NGS technology, missing data are still a problem (Harper et al. 2012), we also assessed the robustness of PSIKO for this type of data. To obtain such datasets, we proceeded as in the pre-vious data experiment only now instead offlipping a locus allele state with probabilityp, we set it to a missing value character with probability p. More precisely, for K = 3 and Dirichlet distribution parameters Dir(1, 1, 1), we generated 100 datasets for 1000 accessions each of which was 13,262 loci long (Mate-rials and Methods). We set the missing value character proba-bilitypto 0.1 and 0.2, corresponding to 10 and 20% missing data, respectively. Using again the average RMSE as assessment criterion, we present ourfindings in Table 4.
As can be readily seen, even with large proportions of data missing, all three methods perform equally well with only marginal differences, a fact that was also observed for sNMF and ADMIXTURE in Frichotet al.(2014).
Inbreeding:The assumption of random mating is frequently
violated in natural populations. To test the robustness of
PSIKOunder these circumstances, we also simulated datasets
where inbreeding is present. To do this, wefirst simulated K = 3 independently mating populations as in the noise experiment. For each population 1#k#3 and each locus l in such a population, we then computed the empirical allele frequencies fkl (Materials and Methods). Subsequent
to this and following Frichotet al.(2014), we used a preset value for the inbreeding coefficient FIS(i.e.,FIS = 0.25 and
FIS= 1) to compute genotype frequencies gkl at locuslin
population k. Using the Dirichlet distribution parameters Dir(1, 1, 1), we then applied the same simulation protocol as above (see Materials and Methods for details), with gkl
taking the place offkl. For each value ofFIS, we simulated
100 datasets comprising 1000 individuals each with 13,262 genotyped SNP positions.
As can be seen in Table 5, all methods are equally robust to inbreeding being present in the dataset, although PSIKO
seems to be slightly more accurate than sNMF and ADMIX-TURE (see also (Frichot et al.2014) where a similar trend was observed for sNMF and ADMIXTURE).
Biological datasets
To further assess PSIKO, we also subjected it to the test of two biological datasets, one of which is an oilseed rape
Table 3 Average RMSE between true and estimatedQ-matrix for Dir(1, 1, 1) for each approach under each noise levelp
p 0.01 0.05 0.1 0.15
PSIKO 0.011 0.012 0.013 0.015
sNMF 0.016 0.012 0.012 0.02
ADMIXTURE 0.018 0.013 0.013 0.019
Table 4 Average RMSE between true and estimatedQ-matrix for Dir(1, 1, 1) for each approach under each missing value probability characterp
p 0.1 0.2
PSIKO 0.012 0.012
sNMF 0.013 0.012
dataset that was originally studied in Harperet al. (2012) and the other is from the HapMap 3 project (seeMaterials and Methods for a brief description of each). We compared our findings with that of ADMIXTURE and sNMF, again using the average RMSE as an assessment measure.
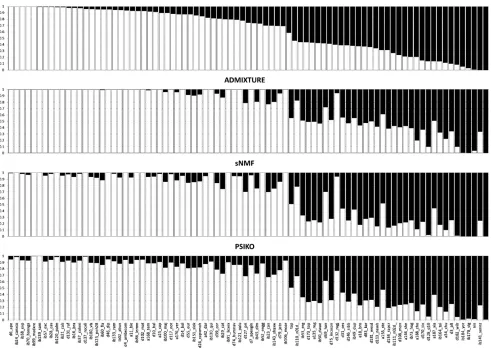
Oilseed rape dataset: Two of the four methods tested
predicted two population clusters (i.e.,K= 2). ADMIXTURE predicted three population clusters, while sNMF predicted five clusters. For the purposes of comparing the four models equally, we elected to use theQ-matrices generated forK= 2 from each of the programs. Similarly and as recommended by their respective authors, we ran all programs with their default parameter values. Additionally, we ran STRUCTURE with a burn-in period of 20,000 iterations, followed by another 20,000 iterations. Direct comparison of the four obtainedQ-matrices (Figure 3) indicates great similarity, par-ticularly between ADMIXTURE, sNMF, and PSIKO.
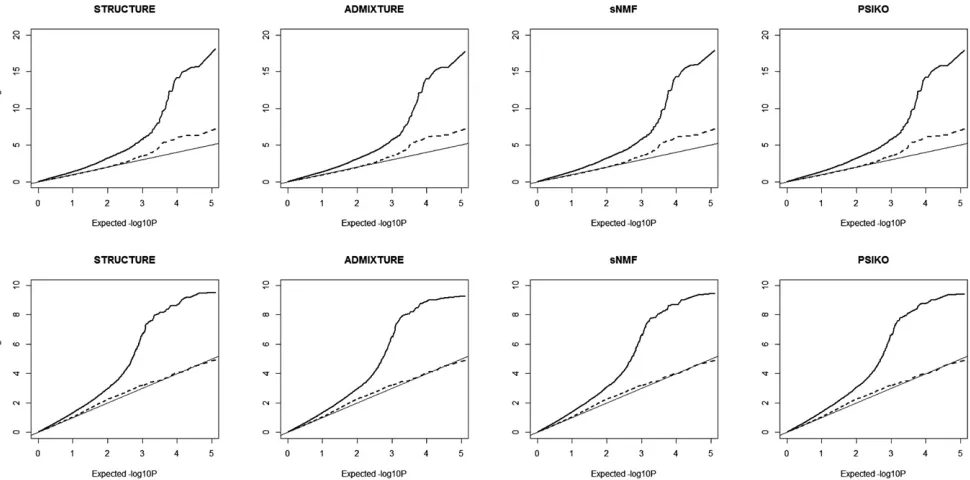
The results of the association mapping using each of the four matrices were very similar (Figure 4). As expected, incorporating the relatedness matrix as a random effect in a MLM reduced the supposed type I error rate. For the erucic acid trait, the residual error was minimized by the MLM/STRUCTURE model, and for the seed glucosinolates trait the residual error was minimized by the MLM/PSIKO model. It is worth noting, however, that the difference between theQ-matrices was not enough to alter iden-tification of markers in close proximity to the major causative loci (see Harperet al.2012 for details).
HapMap 3 dataset:Given the size of the dataset and thus
the prohibitively long run time of STRUCTURE, we only investigated it with ADMIXTURE, sNMF, and PSIKO (again with all parameter values set to default). Since there are no trait data available, we measured the difference between any two of the three returned Q-matrices in terms of their RMSE and theirR2correlation coefficient.
Given the widely accepted fact that the number of founders for this particular dataset is three, all three methods were run with K = 3. They all found strikingly similarQ-matrices. More precisely, the RMSE between any two matrices was never larger than 0.02 (corresponding to an 2% difference) and the R2 correlation coefficient was
always .0.99 (suggesting that they are almost perfectly correlated). However, there was a discrepancy between the methods with regard to estimating the number of found-ers for the dataset with PSIKO and ADMIXTURE returning K = 3, whereas sNMF returned K = 4. The very fast run time of 48 sec for PSIKO (as compared to ADMIXTURE, whose run time was 5212 sec, equating to 1 hr and 27 min and sNMF, whose run time was 17 min and 18 sec) is strikingly apparent with this large-scale dataset.
Since mapping information is available for this dataset, which can be used for LD-based SNP-pruning purposes, we also investigated the performance of PSIKO, sNMF, and ADMIXTURE when the sequences are pruned. More pre-cisely, we used the sliding window-based SNP-pruning
approach implemented in PLINK (Purcellet al.2007) (with default settings) to obtain a pruning of the HapMap 3 data-set. We found that PSIKO, sNMF, and ADMIXTURE all cor-rectly infer the widely accepted number of three founders for that dataset, and that the RMSE between any pair of estimated Q-matrices is never .0.02 (i.e., a 2% disagree-ment), suggesting that all tested methods yield very similar results (data not shown). However, PSIKO took 21 sec to complete. Using K = 3 as input, sNMF took 6 min and ADMIXTURE took 36 min. Additionally, we found that the SNP pruning took 52 min to terminate, resulting in a 52-min overhead in the total running time of each method for this experiment. This is in stark contrast to the 48 sec it took PSIKO to analyze the complete, unpruned dataset.
Discussion
Population structure is a confounding factor in population association studies, hampering our understanding of how, for example, agronomically important traits have been selected for in crop plants or how diseases might have spread throughout a population (Priceet al.2006). It is therefore important to be able to correct for it and this entails gaining insight into a data-set’sQ-matrix as well as the number of its founders. Popular software packages such as STRUCTURE, FRAPPE, INSTRUCT, and ADMIXTURE infer both. Many of them are based on so-phisticated models and rely on assumptions such as satisfying Hardy–Weinberg equilibrium. However, if the dataset in ques-tion violates such assumpques-tions or is very large, as would be the case for NGS datasets, these approaches tend to suffer from long run times. To address the issue, among others, of scalabil-ity, the sNMF approach has been proposed (Frichotet al.2014). Unlike STRUCTURE and ADMIXTURE, it is not model based and uses sophisticated algorithmic techniques to ensure fast run times on large datasets.
Here, we propose the novel and fast PSIKO approach for population structure inference. By combining linear kernel-PCA with a quick-to-solve optimization problem, it couples the fast run time and robustness of PCA with the biological interpretability of Q-matrices obtained from model-based approaches such as STRUCTURE and ADMIXTURE. This allows quick estimation of the Q-matrix underpinning a marker dataset as well as the number of founders of that dataset. Due to PCA’s few underlying assumptions, PSIKO is widely applica-ble and generally has a very low run time, at the same time producing results that are comparable in quality with those obtained by ADMIXTURE, STRUCTURE, and sNMF.
Table 5 Average RMSE between true and estimatedQ-matrix for Dir(1, 1, 1) for each approach under each value for the inbreeding coefficientFIS
FIS 0.25 1
PSIKO 0.016 0.017
sNMF 0.026 0.027
To assess the performance of PSIKO with regard to Q-matrix estimation and inference of founder number, we rigorously tested it on both simulated and real biological datasets. In our simulation studies, we varied the number of founders for a dataset as well as the admixture scenarios for generating a dataset. To help ensure biological relevance, we based our choices for the range of these parameters on those made in Alexanderet al.(2009). Across a wide range of simulation scenarios, we found that PSIKO provides Q-matrix estimates that are very close to the estimates for the respective datasets produced by STRUCTURE, ADMIXTURE, and sNMF where closeness is measured in terms of the root mean squared error between two matrices (Alexanderet al. 2009). Our missing data, noise, and inbreeding experiments suggest that PSIKO as well as ADMIXTURE and sNMF han-dle these types of data extremely well. However for large datasets, PSIKO seems to be superior, even if such a dataset is pruned based on,e.g., linkage disequilibrium.
Thefirst of our biological datasets comprises 84 oilseed rape accessions, representing some seven crop types, genotyped over 101,644 SNP loci. The second comprises 541 human samples from differing geographic regions, genotyped at 1,457,897 SNP
loci. For each dataset, we found that the Q-matrix estimates generated by PSIKO were very close to those produced by ADMIXTURE and sNMF for that dataset, using the same measure of closeness as in our simulation study. However, it is worth pointing out that independent of whether the dataset had been pruned or not, PSIKO’s run time was only a fraction of that of ADMIXTURE, especially on the human dataset, and was also considerably faster than sNMF.
Although great effort has been put into the development of powerful tools for deriving the number K of founders of a population dataset, inferring that number is still a formi-dable statistical and computational problem. For example, finding that number using STRUCTURE can be a very time-consuming task due to the fact that it has to be run on a range of different values for K, each of which might take a long time to complete. Even for newer methods such as ADMIXTURE or sNMF,finding the optimal value of K relies on running the methods for a range of values of K. In PSIKO, we exploit the behavior of the eigenvalues returned by linear-kernel PCA for a dataset to infer K. Due to the algorithmic internals of PCA, this can be done quickly. We are also motivated by a study in Pattersonet al.(2006) as
Figure 3 Q-matrix plots for the 84 lineBrassica napusdataset comparing the performance ofPSIKOto other leading methods. The proportion of alleles
well as numerous simulation studies that indicate that the number of founders of a dataset equals the number of sig-nificant principal components for that dataset plus one. Our simulation studies as well as our two real biological exam-ples suggest that PSIKO holds great promise for this.
The speed of PSIKO is similar to that of sNMF for smaller datasets and is faster than that of ADMIXTURE. While for small datasets the differences in speed between PSIKO and sNMF are negligible, with increasing sequence length PSIKO proves to be significantly faster than sNMF and implicitly also ADMIXTURE. We therefore argue that PSIKO could be a very attractive tool for analyzing the larger datasets that arise from NGS technologies. For smaller datasets (,50 K SNPs), the differences between the three methods are not as clear cut, and the user should choose whichever method would suit their particular dataset best.
In summary we propose a novel, nonmodel-based method for inferring population structure. It exploits the advantages of linear kernel-PCA to quickly and accurately describe a SNP dataset’s population stratification. It is much (up to 300 times) faster than classical, model-based approaches while outputs match those of state-of-the-art methods such as sNMF. Its su-perior speed for large datasets makes it particularly attractive for datasets generated by NGS approaches.
Acknowledgments
The authors thank the referees for their helpful suggestions and comments. A.-A.P. thanks the Norwich Research Park (NRP) for financial support through provision of an NRP studentship. This
work was supported by UK Biotechnology and Biological Sciences Research Council [BBSRC BB/H004351/1 (Integrated Biorefining Research and Technology Club), BB/E017363/1, ERAPG08.008] and UK Department for Environment, Food, and Rural Affairs (Defra IF0144). The research presented in this article was carried out on the High Performance Computing Cluster supported by the Research and Specialist Computing Support service at the University of East Anglia.
Literature Cited
Alexander, D. H., J. Novembre, and K. Lange, 2009 Fast model-based estimation of ancestry in unrelated individuals. Genome Res. 19: 1655–1664.
Bancroft, I., C. Morgan, F. Fraser, J. Higgins, R. Wells et al., 2011 Dissecting the genome of the polyploid crop oilseed rape by transcriptome sequencing. Nat. Biotechnol. 29: 762–766. Bradbury, P. J., Z. Zhang, D. E. Kroon, T. M. Casstevens, Y. Ramdoss
et al., 2007 Tassel: software for association mapping of com-plex traits in diverse samples. Bioinformatics 23: 2633–2635. Engelhardt, B. E., and M. Stephens, 2010 Analysis of population
structure: a unifying framework and novel methods based on sparse factor analysis. PLoS Genet. 6: e1001117.
Ewing, G., and J. Hermisson, 2010 MSMS: a coalescent simula-tion program including recombinasimula-tion, demographic structure and selection at a single locus. Bioinformatics 26: 2064–2065. Frichot, E., F. Mathieu, T. Trouillon, G. Bouchard, and O. François,
2014 Fast inference of admixture coefficients using sparse non-negative matrix factorization algorithms. Genetics 196: 973–983. Gao, H., S. Williamson, and C. D. Bustamante, 2007 A Markov chain Monte Carlo approach for joint inference of population structure and inbreeding rates from multilocus genotype data. Genetics 176: 1635–1651.
Figure 4 QQ plots illustrating population structure corrections using the four methods in genome-wide association studies (GWAS) analysis of two traits in the 84 linesBrassica napuspanel, erucic acid (A) and seed glucosinolate content (B). The expected2log10P(x-axis) are plotted against those observed
Harper, A. L., M. Trick, J. Higgins, F. Fraser, L. Clissold et al., 2012 Associative transcriptomics of traits in the polyploid crop species Brassica napus. Nat. Biotechnol. 30: 798–802.
International HapMap Consortium, 2007 A second generation hu-man haplotype map of over 3.1 million SNPs. Nature 449: 851– 861.
International HapMap Consortium, 2010 Integrating common and rare genetic variation in diverse human populations. Nature 467: 52–58.
Jakobsson, M., S. W. Scholz, P. Scheet, J. R. Gibbs, J. M. VanLiere et al., 2008 Genotype, haplotype and copy-number variation in worldwide human populations. Nature 451: 998–1003. Kim, H., and H. Park, 2007 Sparse non-negative matrix
factoriza-tions via alternating non-negativity-constrained least squares for microarray data analysis. Bioinformatics 319: 1495–1502. Kim, S., V. Plagnol, T. T. Hu, C. Toomajian, R. M. Clark et al.,
2007 Recombination and linkage disequilibrium in Arabidop-sis thaliana. Nat. Genet. 39: 1151–1155.
Knowler, W. C., R. C. Williams, D. J. Pettitt, and A. G. Steinberg, 1988 Gm3;5,13,14 and type 2 diabetes mellitus: an associa-tion in american indians with genetic admixture. Am. J. Hum. Genet. 43: 520526.
Li, J. Z., D. M. Absher, H. Tang, A. M. Southwick, A. M. Castoet al., 2008 Worldwide human relationships inferred from genome-wide patterns of variation. Science 319: 1100–1104.
Ma, J., and C. I. Amos, 2012 Principal components analysis of population admixture. PLoS ONE 7: e40115.
Marchini, J., L. Cardon, M. Phillips, and P. Donnelly, 2004 The effects of human population structure on large genetic associa-tion studies. Nat. Genet. 36: 512–517.
Murphy, K. P., 2012 Machine Learning: A Probabilistic Perspective, MIT Press, Cambridge, MA.
Patterson, N., A. L. Price, and D. Reich, 2006 Population structure and eigenanalysis. PLoS Genet. 2: e190.
Peres-Neto, P. R., D. A. Jackson, and K. M. Somers, 2005 How many principal components? Stopping rules for determining the number of non-trivial axes revisited. Comput. Stat. Data Anal. 49: 974–997.
Price, A. L., N. J. Patterson, R. M. Plenge, E. W. Michael, N. A. Shadick et al., 2006 Principal components analysis corrects for stratification in genome-wide association studies. Nat. Genet. 38: 904–909.
Pritchard, J. K., M. Stephens, and P. Donnelly, 2000 Inference of population structure using multilocus genotype data. Genetics 155: 945–959.
Purcell, S., B. Neale, K. Todd-Brown, L. Thomas, M. A. Ferreira et al., 2007 PLINK: a tool set for whole-genome association and population-based linkage analyses. Am. J. Hum. Genet. 81: 559–575.
Raj, A., M. Stephens, and J. K. Pritchard, 2014 fastSTRUCTURE: variational inference of population structure in large SNP data sets. Genetics 197: 573–589.
Scholkopf, B., A. Smola, and K.-R. Mller, 1999 Kernel principal component analysis, pp. 327–352 inAdvances in Kernel Methods: Support Vector Learning, MIT Press, Cambridge, MA.
Tang, H., J. Peng, P. Wang, and N. J. Risch, 2005 Estimation of individual admixture: analytical and study design considera-tions. Genet. Epidemiol. 28: 289–301.
GENETICS
Supporting Information
http://www.genetics.org/lookup/suppl/doi:10.1534/genetics.114.171314/-/DC1
A Novel and Fast Approach for Population Structure
Inference Using Kernel-PCA and Optimization
Andrei-Alin Popescu, Andrea L. Harper, Martin Trick, Ian Bancroft, and Katharina T. Huber
File S1
Supporting Information for PSIKO
September 26, 2014
This is the supplement for (POPESCU et al., 2014). We begin by complementing
our simulation results for PSIKO for K=3 founders presented in (POPESCU et al.,
2014) with those for larger values of K i. e. K=4. . .10. We then present a
pseudo-code version of PSIKO ( Algorithm 1). Subsequent to this, we present mathematical
details on how equations underpinning PSIKO are solved. We conclude with details on
themsmscommands used to generate our simulated datasets. Unless stated otherwise,
our notation follows that of (POPESCUet al., 2014).
LARGER VALUES FOR K
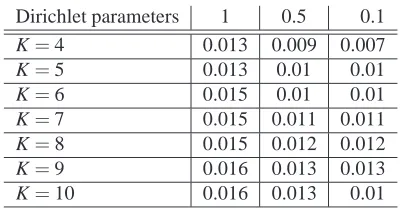
For various Dirichlet distribution parameter settings in a symmetric simulation
sce-nario (see POPESCU et al. (2014) for details), we present in Table S1 the average
Root Mean Squared Error (RMSE) between inferred and true Q-matrices for values
of K=4, . . . ,10. As can be readily observed, the average RMSE over all 100 datasets
for each Dirichlet distribution parameter choice and each value for K is below 1.6%
which suggests that PSIKO performs very well for larger values of K.
Dirichlet parameters 1 0.5 0.1
K=4 0.013 0.009 0.007
K=5 0.013 0.01 0.01
K=6 0.015 0.01 0.01
K=7 0.015 0.011 0.011
K=8 0.015 0.012 0.012
K=9 0.016 0.013 0.013
K=10 0.016 0.013 0.01
Table S1: Denoting the Dirichlet distribution parameter settings of all 1s, all 0.5s and
all 0.1s, by 1, 0.5 and 0.1 respectively and using the latter as column labels, we present the average RMSE between the true and the estimated Q-matrix for PSIKO for the values K=4, . . . ,10.
PSIKO PSEUDO-CODE
A representation of PSIKO in pseudocode is given in Algorithm 1. Let nComp denote
the number of found significant components.
Algorithm 1 PSIKO
Input: A dataset in the form of a SNP matrix X with accession loci encoded as 2’s,
1’s and 0’s.
Output: The number K of founders, the significant principal components (PCs) and a
Q-matrix Q= (qcx)for X, where c is a founder of X and x is a an accession of X.
STEP I (Dimensionality Reduction):
1 : first apply linear kernel-PCA to X to reduce dimensionality of the dataset and then the Tracy-Widom test for non-zero eigenvalues to infer the number nComp of significant principal components. Finally use those components to compute a
nComp dimensional dataset X′
2 : normalize X′to have zero mean and unit variance STEP II (Population Structure Inference):
3 : find the vertices (and thus the number K of founders) of the(nComp−1)-simplex representing X′by minimising Equation (1) below
4 : return K and the matrix Q found in Step 3 and the significant PCs found in line 1
OPTIMISING EQUATIONS UNDERPINNING PSIKO
In this section, we give details on the algorithm used to minimise Equation (2) of
(POPESCUet al., 2014), that is:
L(A,Q) =||X−AQ||2F, (1)
where A= (ai)1≤i≤K and a1,a2, . . .aK are the founders of X represented as column
vectors, Q= (qxi)1≤i≤Kis the matrix of ancestry coefficients for each accession x∈X,
and K is the number of putative founders.
We start by making some observations that are specific to optimising Equation (1),
and then present in Algorithm 2 an efficient algorithm for minimising it. The notation
used follows that of (POPESCUet al., 2014).
Suppose we are given a matrix Q. Finding a matrix A which minimises Equation (1)
can easily be achieved via linear least-squares optimisation. More precisely, we have
that
x=
K
∑
i=1
qxiai, (2)
holds for any accession x in our data set. In the context of optimising Equation (1) we
are interested in finding values for ai, 1≤i≤K such that a given accession x in X is
approximated as closely as possible by Equation (2). This can be achieved by using:
Observation 0.1.
A= (QTQ+ΓΓT)−1QTXT, (3)
where Q and X are as before andΓ=I is a Tikhonov regularisation matrix.
Now consider the converse problem, i. e. that the matrix A is known, and that we
are interested in finding the matrix Q. For this we once again use Equation (2) above.
More precisely, utilising the fact that∑Ki=1qxi=1 holds for all x∈X, we obtain:
Observation 0.2. Let B :=
1 1 . . . 1
a1 a2 . . . ak
, qx:=
qx1
qx2
. . .
qxK
and x′:=
1
x
.
Then Bqx=x′or, equivalently,
qx=B−1x′ (4)
We note that the above solution for qxcan produce entries which are outside the
interval[0,1]. To address this we followed the strategy employed in sNMF (FRICHO
et al., 2014), and first set for all x∈X all entries of qxthat are negative to zero. We then divide each entry of qxby the sum of entries of qx. This ensures that the values of
qxlie in the interval[0,1]and that they also sum to one.
Using Observations 0.1 and 0.2, we can optimise Equation (1) iteratively (see
Al-gorithm 2, withεset to 10−5). We found that that algorithm returns accurate estimates
of the Q matrix across all simulation scenarios as well as for the two biological datasets
under investigation in (POPESCUet al., 2014).
Algorithm 2 Algorithm used to optimise Equation (1) Input: A data matrix X as returned by Step I of PSIKO
Output: A matrix A of founders for X as well as Q-matrix Q for X, minimising
Equa-tion (1).
Initialise A and Q randomly.
prev=0
cur=L(A,Q)
setεto a small number, say 10−5
while|prev−cur|<εdo
estimate Q given A using Equation (4) estimate A given Q using Equation (3)
prev=cur cur=L(A,Q)
end while
return A,Q
MSMS
COMMANDS USED
In order to simulate K>1 independent, randomly mating populations, we used the
msmscoalescent simulator (EWINGand HERMISSON, 2010). We simulate K
indepen-dent demes (populations) with no migration between them over a period of 10,000
generations. Each deme is represented by 100 simulated individuals. After 10,000
generations, all K demes are merged and the coalescent process is allowed to
termi-nate. We simulate a fixed number of segregating sites (SNPs in our case) in each case.
Specifically, for K=3 and 13,626 segregating sites, we used the followingmsms
com-mand:
msms.jar 300 1 -s 13626 -N 1000 -I 3 100 100 100 -ej 2.5 1 2 -ej
2.5 2 3
By modifying the -I flag and adding more -ej flags, this command can be used to
simulate an arbitrary number of independent populations. The user is referred to the
msmsmanual for more details.
LITERATURE CITED
EWING, G., and J. HERMISSON, 2010 MSMS: a coalescent simulation program
in-cluding recombination, demographic structure and selection at a single locus.
Bioin-formatics 26: 2064–2065.
FRICHO, E., F. MATHIEU, T. TROUILLON, G. BOUCHARD, and O. FRANOIS, 2014
Fast inference of admixture coefficients using sparse non-negative matrix
factoriza-tion algorithms. Genetics Early online access, 10.1534/genetics.113.160572.
POPESCU, A.-A., L. A. HARPER, M. TRICK, I. BANCROFT, and T. K. HUBER, 2014
A Novel and Fast Approach for Population Structure Inference using Kernel-PCA
and optimisation (PSIKO) .