THE, APPLICATION O F THE “METHOD OF MAXIMUM LIKELIHOOD” TO THE ESTIMATION O F LINKAGE
J. B. HUTCHINSON
Empire Cotton Growing Corporation Cotton Research Station, Trinidad
and
. . Rothamsled Expwiment Station, Earpenden, England
Received October 4, 1928
TABLE OF CONTENTS PAGE
INTRODUCTION . . . 519 A case involving complementary factors.. . . . 519 A case involving duplicate factors. . . . 527
Consideration of theory when complementary or duplicate factors are themselves linked.. 533
SUMMARY.. . . . 536 Acknowledgments. . . . 536 LITERATURE CITED.. . . . 536
INTRODUCTION
The “Method of Maximum Likelihood” is given by FISHER (1928) and is illustrated by a simple case of linkage between two factors. The method consists of multiplying each class frequency by the natural logarithm of its corresponding probability, summing, and determining the value for which the sum is a maximum. The linkage is expressed in terms of
p
wherep
is the proportion of gametes carrying both dominants plus the proportion of gametes carrying both recessives. The method is quite general, and may be applied to any type of ratio from which it is desired to estimate alinkage.
A CASE INVOLVING COMPLEMENTARY FACTORS
BRUNSON (1) has studied maize families in which a factor for pale green seedling is linked with one of two complementary factors for aleurone colour, and he gives a formula, derived from EMERSON’S formula, for the estimation of the linkage.
The F2 is classified as under, where C and
R
are complementary factors for aleurone colour, andP,,
is a factor for pale green seedling:TABLE 1
Frequencies observed in an F2 segregating for aleurone colour and pale green seedling
(BRUNSON’S deta).
C R Cr+cR+cr SEEDLINO TOTAL
Po,
n = 3946 1739
2207 Aleurone total
986 686
300
P O I
2960 1053
1907
Then, considering only the factor
P,,
and the aleurone factor linked with it, the probabilities of the four classes in Fz will be:P,IA
P*
,A Pala P o l =i(2+ppl):f(l- pp'):t(l -pp'):fppl
where A is either C or
R,
andp
is the proportion of(P,,A
+Potu) gametes in male gametogenesis, andp1
is the proportion of(PJ
+p,,u) gametes in female gametogenesis. The effect of the linkage is then entirely expressed in the termpp',
and if crossing over is equal in male and female, the cross- over percentage will be (1-dp$)
X 100 in the coupling phase, and(42)
X 100 in the repulsion phase. For simplicity, B will be written forp p 1 ,
and since the data provide no evidence on the matter, it will be as- sumed that crossing over is equal in male and female. (See FISHER (1928)). Then, bringing in the complementary factor for aleurone colour, we get the probabilities in the four classes:CRPo, CRpo, [C~+cR+cr]Pg, [C~+cR+c~]pg,
3 3 3 16 16 16
-(2+e) -(1-e) " ( 2 4 )
Then the logarithm of the likelihood will be :
+686 log :(1+36). 16
And the maximum likelihood value of B will be that for which the first differential of equation 1, with respect to B, is zero:
1907 300 1053 2058
- + - = O . (2)
2+e 1-e 2-e 1+3e Which becomes on multiplying out:
1 1 8 3 ~ 8 - 1 2 8 0 2 ~ - 11376e+8740=0.
An equation of the third degree, which may be solved by HORNER'S
method (BURNSIDE and PANTON 1886), or by the method of successive trials developed on page 532.
In the present case the solution is
ESTIMATION OF LINKAGE 521 Then, assuming equal crossing over in male and female
or 23.18 percent crossing over, with coupling.
The variance of this estimate of 8 may be obtained by differentiating equation 2 again with respect to 8, substituting the expected values for the class frequencies, and equating to
-
l/V(8)or
Then, since the variance of 8 is the mean square deviation of all 8's from the mean of 8, and the variance of
p
is the mean square deviation of the p's from the mean ofp ,
and since 8 equalsp z ,
we can calculate the variance ofp
from the variance of 8 .v(@
= (2p)Z.u p >
and
( 2 + p 2 > ( 1 - ~ 2 ) ( 2 - p z ) ( 1 + 3 ~ 2 >
v(p)=
3np2(5+2p2-4p4) Substituting forp
we getV ( p ) = 0.0001240
.(p)
= O . O l lBRUNSON'S formula may be reduced to 16
pB2="n.(a--b--C+3d)
where a, b, c, and d are the observed frequencies in the four dasses,
CRP,,,
CRP,,, [Cr+cR+cr]P,,, and [Cr+cR+cr]p,, respectively.BRUNSON finds
p ~ = 0 . 7 6 7 .
The variance of this estimate may be found from the general equation given by FISHER (1928).
where T is any function of the frequencies, and
p
is the probability of thecorresponding class a, b , c, d. For convenience T B may be used in place of
P B ~ ,
and the variance of p B found from that of T B as above.Then
16
18n
T ~ = - ( a - b - c + 3 d ) .
Taking the components of
s{p(2>’
l
d T 16
da 18n
d T 16
db 1812’ dT 16
dc 18n
d T 48
dd 1%
’
_“
-
.
”=”.
-.=-
.
and
S{
P ( $ ) ) }
= (Pa+Pb+pc+9pdF”--64 81n2
ESTIMATION OF LINKAGE S23
Then since
as before, and
32+32p2-27p4
V ( P B ) 1081zp2
Substituting the most likely value of
p
we getV ( ~ B ) =O. 000165 ~ ( p ~ ) = 0 . 0 1 3 .
The efficiency of
BRUNSON'S
formula may be estimkted by dividing the variance of the Maximum Likelihood equation by the variance of BRUN-SON'S formula.
( 2 + ~ 2 ) ( 1 - f i 2 ) ( 2 - ~ 2 ) ( 1 + 3 ~ 2 ) 32+32p2-27p4
E = -
- 36(23-+')(1-~2)(2-p2)(1+3p2)
3%p2(5+2P2-4p4) 108npZ
-
(5+2p2-4fi4)(32+32p2-27p4)
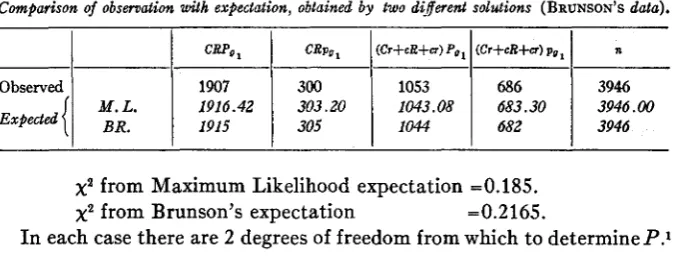
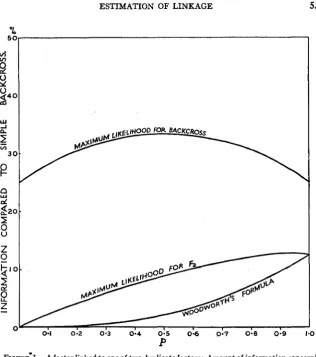
For the distribution of E for values of
p
from 0 to 1, see figure 1. The formula is about 90 percent efficiency throughout the repulsion phase, but compares badly with the Maximum Likelihood equation for high coupling. Nowhere does it give complete efficiency.The expected frequencies may be found by substituting the most likely value of 0 in the probabilities and multiplying by n =3496.
TABLE 2
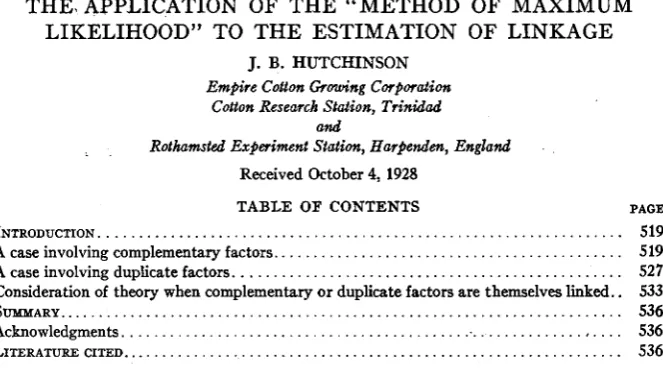
Comparison of observation with expectation, obtained by two di,fereent solutions (BRUNSON'S data).
CRPo
M. L.
n
(Cr+eR+u) pol (Cr+cR+cr) Pol
CRpUl
1907 300 1053
3946 682
1044 305 1915
3946.00 683.30
1043.08 303.20
1916.42
39%
686
BR.
x2
from Maximum Likelihood expectation =0.185.x2
from Brunson's expectation =0.2165.I n each case there are 2 degrees of freedom from which to determine P.1
1 FISHER (1922, 1923 and 1924) has shown that when a population, with which a sample is to
be compared, has itself been reconstructed from the sample, the distribution of x* is not known
simply from the number of frequency classes, When using ELDERTON'S tables, the table must be
entered with n1 equal to one more than the number of degrees of freedom in which the sample may
Any number of formulae for the estimation of
p
may be invented. SeeFISHER (1928, in press).
The amount of information per plant obtained from the
FS
and its corre- sponding backcross may be compared with the amount of information obtainable from a simple backcross, that is, one in which complete classifi-0
FIGURE 1.-Efficiency of BRUNSON’S method of estimating linkage in an F2 involving a factor linked to one of two complementary factors.
For a simple backcross:
ESTIMATION OF LINKAGE 525
Therefore the amount of information concerning
p
available per plant isI(P> 1
"
".
n
P O - P )
I n a backcross between an F1 of the type under consideration and its triple recessive, the probabilities of the four classes will be:
CRP,,, CRp,,, (Cr+cR+cr)Pol (Cr+cR+cr)pOl
-
P
-
1 - P 2-P - 1 + P4 4 4 4
-
And the maximum likelihood value of
p
is that for whicha b C d p 1 - p 2 - p +-=O 1 + p
and the variance of
-=-(
p
1 n 1 1
W ) 4
-+-+-+-
P
1 - P 2 - P l+P 2P(1-PP)(2-PP)(1+P)l
' >
U P )
=n ( l + 2 p - 2 p 2 )
Then the amount of information concerning
p
available per plant is the reciprocal of the variance, divided by nI(P> 1 + 2 p - 2 p 2
"
12 2 P ( l - P ) ( 2 - P ) ( l + P )
-
The amount of information available per plant relative to that obtainable from a simple backcross is
1 + 2 p - 2 p 2 1 1 + 2 p - 2 p 2
2 P ( l - P ) ( 2 - - P ) ( l + P )
.
P ( 1 - p )
2 ( 2 - - P ) ( l + p )A similar procedure may be applied to the Maximum Likelihood solution for the F2 and to BRUNSON'S formula. The amount of information con- cerning
p
made available per F2 plant by the Maximum Likelihood equa- tion is I(P) 3p2(5+2p2-4p4)n (2+P2)(1+P)(1-P)(2-P2)(1+3P2)
-=
Dividing by l / p ( l
- p )
we get the amount of information per Fa plant relative to that supplied by a simple backcross3p'(5+2p2-4p4)
The amount of information concerning
p
made available per F2 plant byBRUNSON'S
formula isI ( P B ) 1 0 8 p
"
-
n 32+32p2-27p4
Dividing by 1/p(1
- p ) ,
we get the amount of information per F2 plant relative to that supplied by a simple backcross108P'(l"p) 32+32pa-27f'
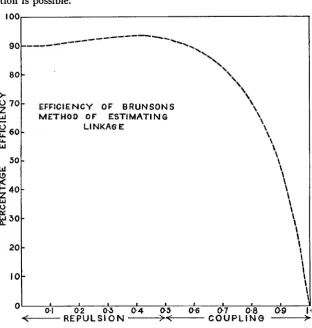
These amounts of information are plotted as percentages for values of
p
from 0 to 1 in figure 2. It will be seen that for values of
p
from 0.7 to 1.0-m 2 4 0 -
FOR BACKCROSS
Q
g 2 0 -
oi
I
00
P
FIGURE 2."A factor linked to one of two complementary factors: Amount of information
concerning linkage supplied per plant by a backcross to a triple recessive, and by an F2 using
ESTIMATION OF LINKAGE 527
that is, 30 percent or less crossing over with coupling-an
Fz
gives a better estimate of linkage than a backcross to the triple recessive. A simple backcross can, of course, be obtained by backcrossing to a double reces- sive, which is homozygous dominant for the independent complementary factor. In the present instance, backcrossing is impossible, because one of the linked factors is lethal in the recessive phase. I n any case, i t is not known which of the complementary factors is independent.The amount of information supplied by the backcross is never more than 1/3 of what would be available if the classification could be completed.
F2s give very little information concerning linkage in the repulsion phase, and at best, in the coupling phase, give 40 percent of the information that would be supplied by a simple backcross of the same size.
A CASE INVOLVING DUPLICATE FACTORS
WOODWORTH (1921) has studied a case in soy beans in which one of two duplicate factors, I and D , for cotyledon colour is linked with a factor V for seed coat colour, and gives the figures given in table 3 for his F2, after correcting his data to 15 : 1 for cotyledon colour. This correction is made necessary because seeds borne on the
F1
plants were classified for cotyledon colour, while seeds borne on F2 plants were classified for seed coat colour.TABLE 3
F1 distribution for cotyledon colour (corrected lo 15:l nearest whole number) and seed coat colour
(WOODWORTH’S data).
I
ZD+Zd+iDI
id1
COAT COWWV
n=228
14 214
Cotyledon colour
64
0
64
V
164 14 150
The probabilities of the four classes are given in table 4, where 0 ex- presses the effect of the linkage, and, as before, is equal to
p2
if crossing over is the same in male and female.TABLE 4
Proba.bi1itie.s ofthe four classes where B exfwesses the linkage between either I 01 D, and V.
I
ZD+Zd+iDI
id1
COAT COWWV
V
3
4 1
4
-
-
Cotyledon colour - 15 1
16
1
n = lThen the most likely value of 8 is that for which the first differential of the likelihood equation is 0,
150 64 14 0
u + e
4-e 1-e +“O.e
Then, clearly, the most likely value of 8 is 0,-that is, complete linkage with repulsion.
The variance of this estimate is obtained, as before, by differentiating again, substituting the probabilities for the observed frequencies, and equating to - l/V(O)
1
4 - e 1-e
e
+-+-+-
4(11+e)(4-e>(l-e)e
n(l1+28-4@)
v(e)
=Then, since 6
= p z
we can derive the variance ofp
as before.(11+P”~4-P2)(1-P2)
U P )
=n(11+2p2-4p4)
Substituting 8 = O we get
44
11 X 228
~(P)=---=O0.Ol754
u(P)=0.132.
The
Fz
evidence indicates, therefore, 0 percent crossing over, with a standard deviation of 13.2 percent. WOODWORTH (1921 and 1923) givesequations2 for the estimation of linkage, which may be reduced to:
a+b-lSc+d
n p w 2 = e w =
On applying this to the corrected data, WOODWORTH gets 13.25 percent crossing over. This, however, he shows to be due to the fact that the correction is to the nearest whole number, only, and when the exact cor- rected figures are taken, there is no evidence of crossing over.
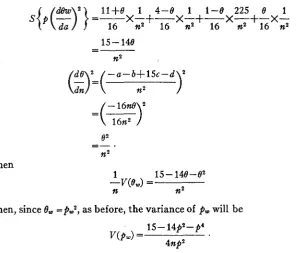
The variance of Ow may be obtained by applying equation 6 as before.
WOODWOXTE (1921) gives: r=.25d/a+b+d+lSc.
ESTIMATION OF LINKAGE 529
l l + e 1 4 - e 1 1-e 225
e
1x-+-x-+-x-+-x-
16 n2 16 n2 16 n2 16 n2 1s - 148
=-
n2
e 2
".
-
n2
Then
1 15--14e-e2
f i n2
--v(e,>
=Then, since 0,
=pW2,
as before, the variance ofpm
will be15-14p2-p4 V(PW> =
4np2
Then, since
p
=0, in this case the variance of WOODWORTH'S estimate isinfinitely large.
The expected numbers are obtained by substituting 0 = O in the prob- abilities, and multiplying by n =228. Having corrected the ratio for cotyledon colour, and fitted an estimate of
p ,
only 1 degree of freedom remains, andP
=about 0.28. (See footnote to page 523.)TABLE 5
Observed and expected frequencies for cotyledon colour and seed coat colour in soy beans. 2=1.1548.
[ZD+Zd+iD]V [ZD+Zd+iD]a i d V id* n
Observed
0 -0.25
+7.0
"6.75
Deviations
228 0.00
14.25 57.00
155.75 Expected
228 0
14 64
150
The probabilities of the classes in a backcross involving duplicate genes, one of which is linked to a third gene, will be
[ I D + I d + i D ] V : [ I D + I d + i D ] v : idV :idv
l + P 2 - p - l - p
p
4 4 4 4
"
and the variance of
p
will be2P(l-P)(2--P)(l+P) 4 1 + 2 P - 2 P Z ) V(P> =
the same as for complementary factors.
pared to a simple backcross are calculated as before and give
The amounts of information concerning
p
available per plant, com-Maximum Likelihood equation for Fz
P(11+2P7-4P4)
4(11+P2)(4-P2)fi+P)
WOODWORTH’S formula for Fz
4P3(1
-P>
15-14P2”p4Maximum Likelihood equation for backcross
(1+2P”P2)
2(2”P)(l+P)
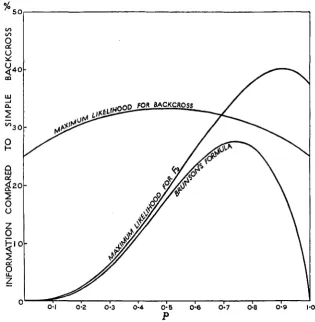
These amounts of information are plotted as percentages of that obtainable from a simple backcross in figure 3. It is quite clear that very little infor- mation concerning linkage can be obtained from an Fz involving duplicate factors under any circumstances, and such Fzs should always be carried on to Fa. A backcross to the triple recessive gives from 1/4 to 1/3 of the information per plant that would be obtained from a simple backcross.
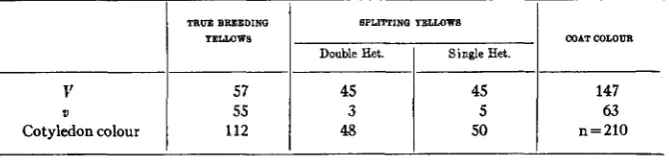
TABLE 6
Soy bean F2 segregating for seed coat colour and cotyledon colour: yellow cotyledon plants only included and these analysed according to Fa behaviwr (WOODWORTH’S data).
TRUE BBEIDINQ BPLIITINQ YloLWW8
Double Het.
I
Single Het.COAT COLOLTFI
v
63 5
3 55
V
147 45
45 57
Cotyledon colour 112 48 5 0 n=210
ESTIMATION OF LINKAGE 531
L
P
F1cmv3.-A factor linked to one of two duplicate factors: Amount of information concerning linkage supplied per plant by a backcross to a triple recessive, and by an Fz, using (a) Maximum Likelihood solution, (b) Woodworth’s solution. Amount of information per plant expressed as a percentage oflthat supplied by a simple backcross.
TABLE 7
Probabilities of the classes involved i n the soy bean segregation tabulated in table 6.
TRUB BREEDING SPLITMNO TELLOWS COAT C O L O W Double Het. I Single Het.
v
1 %
15Cotyledon colour 4 n = 1
Then the garitholm of the likelihood will be 3 4 2
15 15 15
L-57 log-(1+2p-p2)+45 log-(1"P+p2)+45 log-(2-p)
+S5 log 4-6p+3p2 +3 log-(1-p)+5log- 4P 2P 15 15
15
And the most likely value of
p
will be that for which114(1-p) 45(1-2p) 45 330(1"p) 8 3 14-2P-p' 1-p+p2 2-9 4-6p+3p2 p 1-p
- -"
This equation may be multiplied up and solved by HORNER'S method, but an easier method is to obtain the value of
p
by successive trials. This method has the advantage that it avoids all algebraic manipulation, and provides not only an estimate of the linkage, but also an estimate of its standard error. A good guess for the first trial can usually be made after inspecting the data. I n this example the F2 indicated no crossing over, while the data in table 6 show that repulsion is not complete. A fair first trial is thereforep
=0.1. Since the amount of information [ = l / V ( p ) ] isthe rate of change of x relative to
p ,
the two final approximations, if worked out to sufficient accuracy, will give an estimate of the variance ofp .
The two final approximations used werep
=0.144 andp
=0.115.When
p=0.114 x= + O . 26904
p = o .
115 ~ = - 0 . 5 4 5 0 3 .Therefore
p
is approximately 0.1143, or 11.43 percent crossing over. And for a change of 0;OOl inp ,
x changes 0.81407, and the rate of changeV(p) = 0.001228
U(*) = 0.03504.
This may be checked by differentiating the likelihood equation a second time, equating to - l/V(p) and substituting
p
=0.11433of
p
=l/V(p)
=814.071 114(3-2P+p2) 45(1+2p-2p2) 45 330(2-66p+3p2)
"
-
V P > -
(1+2P-P2)2 (l-p+p2)2+-
( 2 - ~ ) ~ + (4-6p+3p2)2 8 3+-+816.05 p=
P2
(1-PI2 V(@) =0.001225ESTIMATION OF LINKAGE 533 The two estimates of the variance differ by less than 0.5 percent.
tion of 3.5 percent.
We have, therefore, 11.43 percent crossing over with a standard devia-
CONSIDERATION OF THEORY WHEN COMPLEMENTARY OR DUPLICATE
FACTORS A R E THEMSELVES LINKED
These cases are rare, but may be considered for the sake of completeness.
(a) Complementary Factors
The probabilities of the two classes will be
2+e 2 - e
”
-4 4
where, as before, 0
= p 2
if crossing over is the same in male and female. The most likely value of 0 will be that for whicha b
””- 0
2+e 2 - 8
or
And
2(a-b)
n
p 2 = 6 , - .
1 n
-+-
( 2 + e ) ( 2 - e )
v(e)
=12
And since 0
=p2,
we calculate the variance ofp
as before( 2 + P 2 ) ( 2 ” P 2 ) V(P> =
4p2n
And the amount of information per plant compared to a (theoretical) simple backcross will be the reciprocal of this divided by n / p ( l
- p )
4P3U
- P >
4-p4
(b) Duplicate Factors
The probabilities of the two classes will be
4-e
e
4 ‘4“-
.
The most likely value of 8 will be that for which
or
b a
e
4 - e""-0
.
4b
n
p z = e = - .
And differentiating again, substituting probabilities for a and b and equating to
-
I/v<e>
we get~-
1 n
4-82 V ( # ) =-
4n
And the amount of information per plant compared with a simple back- cross will be
The probabilities of the classes in the two backcrosses will be
P
2 - P2 2
Complementary - [ A B ] :-[Ab+aB+ab]
Duplicate
3
[AB+Ab+aB] :-ab.P
2 2
And the most likely values of
p
will be of those for whichand
a b
""- 0 for Complementary Factors.
P
2 - Pb a
P
2 - P""- 0 for Duplicate Factors.
The variance of
p
is the same in each case:1 n
n =-
ESTIMATION OF LINKAGE 535
P ( 2 -
P )
W ) =
-
n
Then the amount of information per plant relative to a simple backcross will be the reciprocal of the variance divided by n / p ( l
- p )
- 1 - P
".
2 - P
These amounts of information are plotted as percentages of the amount of information supplied by a simple backcross for values of
p
from 0 to 1. See figure 4.Very little information concerning linkage can be obtained from an'
Fs
involving linked complementary factors. Where there is a considerable
0
I 51
4
d
S
Y
i4'U1 -I
a
2
P
9
d
2,8
G'
v)31
d
I
z
0
-
I
9
z
d
FIGURE 4.-Complernentary factors themselves linked, and duplicate factors themselves
linked. Amount of information concerning linkage supplied per plant by a backcross to a double
recessive, and by F2 using Maximum Likelihood solution. Amount of information per plant
expressed as a percentage of that supplied by a simple backcross.
amount of crossing over-that is, where
p
is near 0.5-an Ft involving linked duplicate factors will give about 1/4 of the information that would be given by a simple backcross of the same size. The backcrosses give up to 1 / 2 of the information obtainable from a simple backcross with high linkage in the repulsion phase, but become less efficient than the corre- sponding F2s with high coupling.SUMMARY
1. The“Method of Maximum Likelihood” developed by DOCTOR R. A.
FISHER is applied to the problem of estimating linkage in cases involving complementary and duplicate factors.
2. Variances are calculated for existing formulae, and their efficiencies
are determined to show that the “Method of Maximum Likelihood” is in
all cases superior to any other method of estimation.
3. The amount of information supplied per plant by Maximum Like- lihood formulae for F2s and backcrosses, and by other formulae for F2s is
calculated and compared with the amount of information supplied per plant by a simple-that is, completely classified-backcross. (See figures 2, 3 and 4.) From these curves it is possible to estimate the size of family necessary to give any required degree of accuracy.
ACKNOWLEDGMENTS
The investigation here presented was carried out at ROTHAMSTED Ex-
PERIMENTAL STATION under the guidance of DOCTOR R. A. FISHER, during a period of study leave from the Genetics Department of the COTTON RESEARCH STATION, Trinidad, B. W. I. The author is indebted to the
EMPIRE COTTON GROWING CORPORATION for granting the leave, and to DOCTOR R. A. FISHER for suggesting the problem, and for the care and patience with which he supervised both its general development, and its
detailed application.
Since the above was written a paper on the calculation of linkage in- tensities by F. V. OWEN has come under notice. FISHER’S Method of Maximum Likelihood is considered, but its particular virtue, namely, that, in the theory of large samples, no statistic can have a smaller sampling variance, is overlooked; see FISHER (1928).
LITERATURE CITED
BRUNSON, A. M., 1924 The inheritance of a lethal pale green seedling character in maize.
Cornel1 Univer. Agric. Exp. Sta. Memoir 72: 1924. Cornel1 Univ. Press, Ithaca, N. Y.
ESTIMATION OF LIKKAGE 537
FISHER, R. A., 1922 On the interpretation of X* from contingency tables and the calculation of P
1923 Statistical tests of agreement between observation and hypothesis. Economica 3:
1924 The conditions under which xa measures the discrepancy between observation and
1928 Statistical methods for research workers. 2nd Edition, Oliver and Boyd.
1928 (In Press) On a property connecting the xa measure of discrepancy with the method of
maximum likelihood. Bologna: International Congress of Mathematics.
WOODWORTR, C. M., 1921 Inheritance of cotyledon, seed-coat, hilum, and pubescence colors in soy beans. Genetics 6 : 487-553.
1923 The calculation of linkage intensities where duplicate factors are concerned. Genetics
8: 106115.
OWEN, F. V., 1928 Calculation of linkage intensities by product moment correlation. Genetics
13: 8GllO.
Jour. of the Royal Statistical Soc. 85: Part 1,88-94. 139-147.
hypothesis. Jour. of the Royal Statistical Soc. 87: Part 3.