Scholarship@Western
Scholarship@Western
Electronic Thesis and Dissertation Repository
9-27-2017 2:00 PM
Generic Numerical Tornado Model for Common Interpretation of
Generic Numerical Tornado Model for Common Interpretation of
Existing Experimental Simulators
Existing Experimental Simulators
Anant GairolaThe University of Western Ontario
Supervisor
Bitsuamlak, Girma
The University of Western Ontario
Graduate Program in Civil and Environmental Engineering
A thesis submitted in partial fulfillment of the requirements for the degree in Master of Engineering Science
© Anant Gairola 2017
Follow this and additional works at: https://ir.lib.uwo.ca/etd Part of the Civil and Environmental Engineering Commons
Recommended Citation Recommended Citation
Gairola, Anant, "Generic Numerical Tornado Model for Common Interpretation of Existing Experimental Simulators" (2017). Electronic Thesis and Dissertation Repository. 4916.
https://ir.lib.uwo.ca/etd/4916
This Dissertation/Thesis is brought to you for free and open access by Scholarship@Western. It has been accepted for inclusion in Electronic Thesis and Dissertation Repository by an authorized administrator of
ii
There are difficulties in making a common interpretation of results of similar experiments done
in different experimental tornado simulation facilities. This is primarily because of the
differences in vortex generation mechanisms utilized as well as geometric differences in these
facilities. Therefore, in an attempt to facilitate a universal interpretation of results, a generic
numerical tornado model, representing the three major existing experimental tornado
simulators, is developed in this study. The three experimental simulators in consideration are
VorTECH at Texas Tech University, Tornado Simulator at Iowa State University and
WindEEE Dome at Western University as representatives of “Ward” type, “top-down” type and “3-D wind chamber” type facilities, respectively.
First, the three experimental facilities and their corresponding flow-fields are replicated using
CFD simulations and then the differences and similarities in their flow-fields are identified. It
is demonstrated that it is possible to link different experimental facilites through a generic
numerical model by characterizing a tornado-like vortex using parameters strictly obtained
from the flow-field, as opposed to the common practice of using geometric dimensions of the
experimental facilities to extract these parameters. This part of the study requires an extensive
parametrization to characterize these vortices, hence computationally effective and reasonably
accurate Reynolds Stress Model (RSM) is used. Further, the potential application of this
generic numerical model to bluff-body aerodynamics and wind load evaluation is demonstrated
by using a more accurate Large Eddy Simulation technique. While the results show some minor
but explainable discrepancy with experimentally obtained data, the proposed generic numerical
model displays a promise towards its application for preliminary tornadic aerodynamic data
generation.
Keywords
Tornado-like vortices, numerical tornado simulation, flow-field charaterization, experimental
iii
Co-Authorship Statement
Chapter two will be submitted for publication under the co-authorship of Gairola, A. and
Bitsuamlak, G.T.
Chapter three will be submitted for publication under the co-authorship of Gairola, A. and
iv
Acknowledgments
I want to begin by expressing my utmost gratitude to Dr. Girma Bitsuamlak for his excellent
supervision and feedback during the last two years. He gave me the time, resources and
freedom to grow as a researcher. This work would not have been possible without his pricless
guidance.
I would also like to extend my heartfelt gratitude to my research colleagues (Zoheb, Ahmed,
Tibebu, Meseret, Anwar, Matiyas, Abiy, Bariello, Kim, Chris and Tsniuel) who have been
extremely helpful and friendly.
A big thank you to the technical staff working back stage to facilitate my research. This
includes Dr. Ge Baolai and Dr. Tyson Whitehead from SHARCNET and Mr. Gerald Dafoe
and Mr. Andrew Mathers at WindEEE for all their help and patience in dealing with my
queries.
My officemates (Rahul, Emilio, Arif, Sarah and Aaron) have been so amazing and have kept
me such great company that I almost never realized that our small office with oddly green
colored walls has no windows. Cheers to all the fun times and great memories we shared in
and outside the office. It has also been a pleasure knowing the other research students
(particularly in wind and structural engineering groups) who have been very friendly to me. I
would also like to thank my other friends here in London and back in New York who have
always believed in me.
I am also grateful to Dr. Partha Sarkar from Iowa State University for giving me a chance to
work in his wind tunnel as an under-graduate intern back in the summer of 2014. I picked up
a career in wind engineering largely because of my experience working with him.
Special thanks Matiyas (“ambesaw”) and Tibebu (“aleka”) for their valuable input throughout.
I would also like to thank Dr. Zoheb Nasir for his expert feedback and comments on my work.
I would also like to thank my examiners, Dr. Horia Hangan, Dr. Han-Ping Hong and Dr. Eric
Savory, for taking the time out of their busy schedules and helping me improve my thesis with
v
At last but not the least, I would like to thank my family, especially my parents (Ajay and
vi
Table of Contents
Abstract ... ii
Co-Authorship Statement... iii
Acknowledgments... iv
Table of Contents ... vi
List of Tables ... viii
List of Figures ... ix
List of Nomenclature ... xiii
Chapter 1 ... 1
1 Introduction ... 1
1.1 Background ... 2
1.2 Motivation and objective ... 9
1.3 Thesis layout ... 10
Chapter 2 ... 18
2 Generic numerical tornado model for common interpretation of existing experimental simulators ... 18
2.1 Tornado-like vortices ... 19
2.1.1 Tornado-like wind field description ... 21
2.1.2 Simplification strategy for numerical simulation of tornado-like vortices 23 2.2 Experimental tornado simulators ... 27
2.2.1 VorTECH at Texas Tech University ... 27
2.2.2 Tornado Simulator at Iowa State University ... 28
2.2.3 WindEEE Dome at Western University ... 29
2.3 Numerical simulation of tornado-like vortices ... 30
2.3.1 RANS (steady) simulations... 30
vii
2.3.3 Large eddy simulations (LES) ... 41
2.4 Results and discussion ... 43
2.4.1 VorTECH (TTU) ... 43
2.4.2 Tornado Simulator (ISU) ... 55
2.4.3 WindEEE ... 60
2.5 Comparison of flow structures ... 64
2.6 Conclusions ... 68
Chapter 3 ... 72
3 Application of the generic numerical tornado model to bluff-body aerodynamics and wind load evaluation ... 72
3.1 Mid-rise building (validation of WindEEE model) ... 73
3.1.1 Experimental set-up (I) ... 73
3.1.2 Numerical simulation set-up (I) ... 77
3.1.3 Results and discussion (I) ... 78
3.2 High-rise building (validation of ISU Tornado Simulator model) ... 82
3.2.1 Experimental set up (II) ... 82
3.2.2 Numerical simulation set-up (II) ... 84
3.2.3 Results and discussion (II) ... 85
3.3 Conclusions ... 91
Chapter 4 ... 94
4 Conclusions and future research direction ... 94
4.1 Conclusion ... 94
4.2 Future research direction... 95
viii
List of Tables
Table 2-1 Summary of configurations considered. ... 27
Table 2-2 Grid resolution. ... 36
Table 2-3 Parameters for simplified numerical model (TTU VorTECH). ... 54
Table 2-4 Parameters for simplified numerical model (ISU Tornado Simulator). ... 60
Table 2-5 Parameters for simplified WindEEE numerical model. ... 64
Table 3-1 Building model dimensions. ... 73
Table 3-2 Parameter for simplified WindEEE numerical model. ... 77
Table 3-3 Comparison of base loads obtained from numerical and experimental simulation.82 Table 3-4 Building locations with respect to the vortex-centre (𝒓𝒄 is the core radius). ... 84
ix
List of Figures
Figure 2-1 Tornado flow structure as shown depicted in Davies-Jones (1981) ... 19
Figure 2-2 Simplification strategy. ... 24
Figure 2-3 Illustration of difference between bounded and unbounded flow. ... 25
Figure 2-4 Unification of experimental facilities. ... 26
Figure 2-5 VorTECH at Texas Tech University schematic adapted from Zhou et al. (2016). 28 Figure 2-6 Tornado Simuator at Iowa State University schematic adapted from Haan et. al (2008). ... 29
Figure 2-7 WindEEE Dome at Western University schematic. ... 30
Figure 2-8 Flow fields from (a)RSM, (b) 𝒌 − 𝜺 , (c) 𝒌 − 𝝎 turbulence models. ... 33
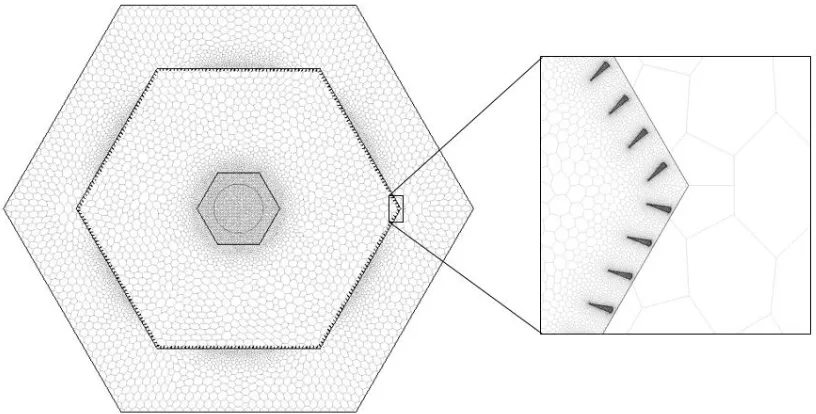
Figure 2-9 Meshing strategy. ... 35
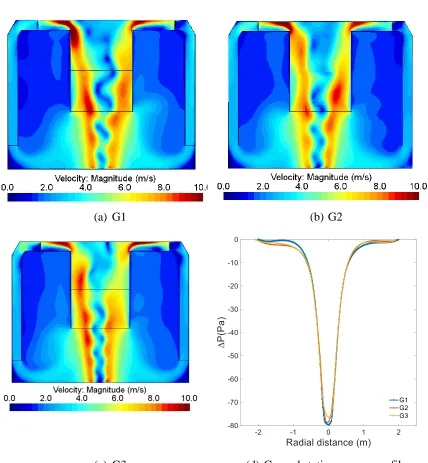
Figure 2-10 Grid independence test. ... 36
Figure 2-11 Tornado Simulator at Iowa State University CFD model. ... 37
Figure 2-12 VorTECH at Texas Tech University CFD model. ... 38
Figure 2-13 WindEEE Dome at Western University CFD model. ... 38
Figure 2-14 Numerically obtained radial profile of tangential velocity (ISU, floor3). ... 39
Figure 2-15 Demonstration of vortex wandering by monitoring the ground static pressure obtained using Large Eddy Simulations. ... 42
Figure 2-16 Velocity magnitude color map shown on Q criterion isosurface for a typical TTU VorTECH configuration. ... 43
x
Figure 2-18 Vertical profiles of radial and tangential velocities at the inlet for TTU 20-degree
configuration. ... 45
Figure 2-19 TTU VorTECH 20-degree configuration CFD model. ... 46
Figure 2-20 20-degree simplified numerical model... 47
Figure 2-21 VorTECH plan view. ... 48
Figure 2-22 Calibrated simplified numerical model. ... 50
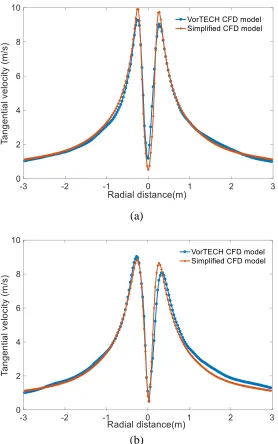
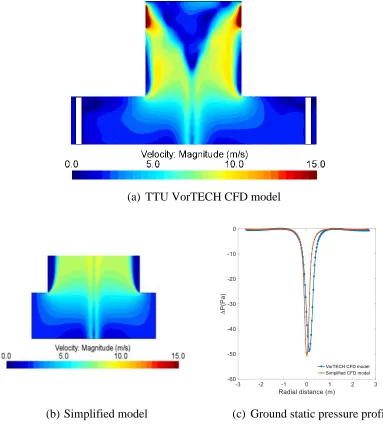
Figure 2-23 Radial profile of tangential velocity (20-degree guide vane configuration) for TTU VorTECH CFD model and simplified CFD model at (a) 0.2 m height, (b) 0.5 m height. ... 51
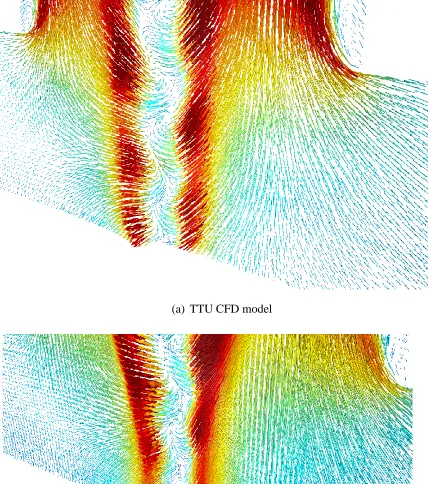
Figure 2-24 A visual comparison of flow fields from full TTU CFD model and simplified TTU model for 20-degree guide vane configuration. ... 52
Figure 2-25 TTU 10-degree guide vane configuration velocity scene for full TTU and simplified CFD models. ... 53
Figure 2-26 Velocity magnitude color map shown on Q criterion isosurface for a typical ISU Tornado Simulator configuration. ... 55
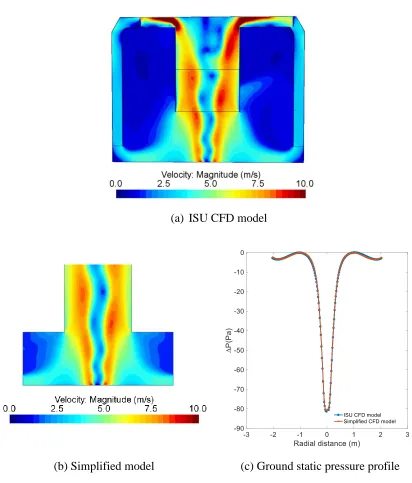
Figure 2-27 Vane 2 configuration (a) ISU Tornado Simulator (b) simplified numerical model (c) comparison of ground static pressure ... 56
Figure 2-28 A typical configuration from ISU tornado simulator showing recirculation zone above the inflow (secondary). ... 57
Figure 2-29 Demonstration of reduction in effective bell mouth size. ... 58
Figure 2-30 Floor 3 configuration ISU Tornado Simulator CFD model. ... 59
xi
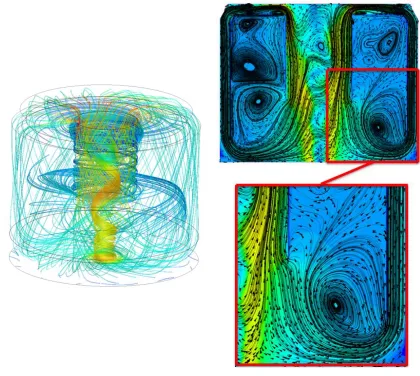
Figure 2-32 Velocity magnitude color map shown on Q criterion isosurface for a typical
WindEEE configuration. ... 60
Figure 2-33 WindEEE CFD model (a) shown with dome (b) shown without dome. ... 61
Figure 2-34 WindEEE plan view. ... 62
Figure 2-35 Radial profile of tangential velocity at 0.17 m height for WindEEE CFD model
and simplified numerical model... 63
Figure 2-36 (a) WindEEE simplified numerical model, (b) ground static pressure
comparison. ... 63
Figure 2-37 (a) TTU VorTECH S=0.43, (b) ISU Tornado Simulator S=0.5, (c) WindEEE
S=0.5. ... 67
Figure 3-1 Building model locations. ... 74
Figure 3-2 Sign convention for forces and moments. ... 75
Figure 3-3 Building model placed at core centre location with a pitot tube to measure the
mean maximum tangential velocity at building height (a) far view (b) close-up view ... 76
Figure 3-4 Generic numerical model schematic. ... 77
Figure 3-5 Mesh strategy. ... 78
Figure 3-6 Surface pressure coefficient distribution for core centre location obtained from (a)
generic numerical model (b) WindEEE experiment. ... 80
Figure 3-7 Surface pressure coefficient distribution for core radius location obtained from (a)
generic numerical model (b) WindEEE experiment. ... 80
Figure 3-8 Mitigation of wandering in simplified numerical simulations. ... 81
xii
Figure 3-10 Radial profile of tangential velocity at 70 mm height obtained through numerical
model using LES (time averaged values presented here). ... 85
Figure 3-11 (a) Velocity field at time instant t1, (b) Velocity field at time instant t2, (c)
Velocity field at time instant t3, (d) Velocity field at time instant t4, (e) Velocity field at time
instant t5, (f) Time-averaged LES. ... 87
Figure 3-12 (a) Time averaged velocity field from PIV (Yang et al. 2011)) (b) Time averaged
velocity field from LES, (c) velocity field from steady RANS. ... 88
Figure 3-13 Comparison of force (Fx) coefficient obtained from numerical and experimental
simulations. ... 89
Figure 3-14 Comparison of force (Fy) coefficient obtained from numerical and experimental
simulations. ... 90
Figure 3-15 Comparison of moment (torsion) coefficient obtained from numerical and
xiii
List of Nomenclature
a Aspect ratio
Cp Pressure coefficient
ℎ𝑢 Height of updraft hole, m
ℎ0 Inflow height, m
P Static pressure, Pa
𝑃0 Reference static pressure, Pa
P Far field static pressure, Pa
Q Volumetric flow rate per unit axial length, m2/s
𝑄′ Volumetric flow rate, m3/s
𝑅𝑒𝑟 Radial Reynolds Number
𝑟𝑢 Radius of updraft hole, m
𝑟0 Radius of updraft, m
𝑟𝑐 Core radius, m
𝑆 Swirl ratio
𝑣𝑟 Radial velocity, m/s
𝑣𝑡 Tangential velocity, m/s
𝑣𝑧 Axial velocity, m/s
z Height above the ground, m
xiv
𝛤∞ Maximum circulation, m2/s
ρ Fluid (air) density, kg/m3
𝜃 Vane angle, degrees
Ω Rotation rate, rad/s
LES Large Eddy Simulation
NS Naiver-Stokes
RANS Reynolds-Averaged Naiver-Stokes
ISU Iowa State University
TTU Texas Tech University
WU Western University
Chapter 1
1
Introduction
Analyzing the effects of extreme weather phenomena, like tornadoes, on structures (bluff
bodies) has received an increased attention in the past few decades. This is largely because
greater socio-economic losses would occur in the event of such a catastrophic weather
phenomenon now, more than ever before, due to recently increased urbanization and
economic development. Wind Hazard Reduction Coalition statistics reveal that, on an
average, about 800-1000 tornadoes annually strike US alone, causing 80 deaths, 1500
injuries and $850 million in damage. In 2011, according to National Oceanic and
Atmospheric Administration (NOAA), tornadoes killed 553 people and amassed $10
billion dollars in damage in the United States. NOAA also reported at least 5 tornadoes in
US in 2015 to have caused over a billion dollars in damage each, with a preliminary tornado
count for the year to be around 1200. While US is ranked first in terms of annual tornado
occurrences, Canada is ranked second. However, unlike US, tornadoes in Canada were not
well documented before 1980s, the reason for a relatively weak database of past tornadic
events. Newark (1984), using newspaper clips, photographs and damage survey reports,
developed a database for tornadoes in Canada from 1950 to 1979. It was reported that there
had been over 700 confirmed tornadoes near Ontario region since the 1950s, making it a
tornado prone region in Canada. A qualitative assessment of the database for tornado
hazard carried out by Newark (1984) revealed that, on an average, there is an F3 tornado
every five years in southern Ontario. Etkin (1999) reported that occurrence of tornadoes in
southern Ontario is higher than any other part of the province and there could be major
economic losses due to high intensity tornadoes because of concentration of population
and industries in this area. Banik et al. (2008) assessed the tornado hazard for spatially
distributed systems in southern Ontario and reported that while tornado hazard for a point
structure might be low, it is significantly higher for a group of structures. A quantitative
assessment of outbreak (occurrence of multiple tornadoes in a brief period in a region)
hazard for an idealized southern Ontario city showed that for a region of interest greater
than 100 km sq. the hazard assessment was less by an order of magnitude when an outbreak
Plainfield, Chicago (1990) tornado had struck in the year 2000 instead, 8629 more people
and 3058 more houses would have been affected (compared to the 1990 scenario), implying
a 50% hike in the property damage value, due to increased concentration of population. It
is inferred from the above discussion that while tornadoes might be considered rare, but
due to extreme consequences, especially for well populated and industrialized regions, the
associated risk (or vulnerability) is considerably high. This calls for an urgent need to study
tornadoes and understand their interaction with the built environment to develop a more
tornado resilient society.
The current study is aimed at investigating tornado-like flow field and its interaction with
bluff bodies using numerical and experimental methods. First, a generic numerical tornado
model is developed that represents the three-major existing experimental tornado
simulators. The generic numerical tornado model is then used to study the interaction of
tornado-like vortices with building model and the numerical results are compared (and
validated) with experimentally obtained data from WindEEE and then with previously
conducted study (Yang et al. (2011)) .
1.1
Background
Tornado awareness and preparedness began in the early 1950s, prompting researchers
around the world to learn more about this relatively rare, yet extreme weather phenomenon.
Based on the available resources and technology, the trend in studying tornadoes has been
evolving and can be broadly classified into 4 eras, as following:
1950s-1960s
At the advent of this period, very little was known about tornado wind field and its
interaction with terrestrial structures, therefore, several attempts were made to study real
tornadoes by gathering field data. However, due to poor storm predictions, limited
technological resources and violent nature of tornadoes, it was rather very difficult to
record any such field measurements. As a result, researchers often resorted to inferior
quality motion pictures and photogrammetric techniques to estimate tornado wind speeds
and qualitatively assess the damage patterns to gain insight into tornado wind field. A
captured, allowing researchers, for the first time, to examine the evolution of a tornado
vortex. The 1957 tornadoes of Dallas, Texas and Fargo, North Dakota were extensively
studied by Hoecker (1960) and Fujita (1960), respectively, using mostly photogrammetric
tools. Hoecker (1960) compared the estimated wind field of the Dallas tornado with
existing wind field models for tornado-like vortices (Dinwiddie (1952) and Hoecker
(1957)) and confirmed the existence of a radial convergent layer in the lower part and the
exhibition of Rankine type behaviour by analyzing the radial and vertical profiles of radial
and tangential velocities. However, the study was limited to only one tornado and was
therefore not entirely conclusive. It was suspected that other tornadoes can have some
degree of differences in their behavior. Benjamin (1962) proposed a theory for vortex
breakdown phenomenon (commonly observed in tornadoes) while studying vortices
formed at the leading edge of a delta wing and demonstrated that the phenomenon is not a
manifestation of instability and instead, is a transition between two dynamically conjugate
states of an axisymmetric flow, analogous to hydraulic jump. Bossel (1969) illustrated that
the phenomenon of vortex breakdown is neither due to hydrodynamic instability nor is it
analogous to hydraulic jump, but instead it is a common feature of the solution of equations
of motion under those conditions. An adverse pressure gradient develops along the central
axis of the core as the pressure deficit near the ground increases (while the pressure deficit
in upper part of the vortex core is not as high), leading to secondary flow within the core
(known as vortex breakdown). Yin and Chang (1969) made one of the earliest attempts of
understanding tornadoes by studying mechanically driven vortices, produced in laboratory
with the help of a rotating screen to impart swirl and an exhaust fan to drive the flow. They
reported a “reversed S” shaped vertical profile of radial velocity (convergent layer) and
identified the outer flow region as potential vortex. However, due to limitations in
instrumentation technology during that era, they could not make flow measurements near
the core region (because of interference error). Lilly (1969), using a hydrostatic core model,
proposed a thermodynamic speed limit of 65m/s in tornadoes by cyclostrophically relating
the wind speeds to pressure deficit in the core. A fallacy in this theory would later be
explained by a group of researchers from MIT and NCAR in 1986 (Fiedler and Rutono
1970s-1980s
This era began with the introduction of Fujita scale (F-scale) by Fujita (1971), which is a
forensic scale to categorize tornadoes based on their intensities. Damage indicators
investigated during post storm surveys are linked to a wind speed and the tornado is
classified into one of the six levels of the F scale (F0-F5, F0 being the weakest and F5
being the strongest tornado). The first remarkable attempt of experimentally studying
tornadoes was made by Neil B. Ward in 1972 at the National Severe Storm Laboratory,
Oklahoma, where he built, what we now call as the “Ward Type” tornado simulator. Ward
(1972) studied tornado-like vortices under the assumption that real tornadoes are low
aspect ratio (less than unity) phenomena and proposed that the radial momentum flux,
possessed by the outer convergent layer, was one of the key parameters in sustaining these
vortices. Davies-Jones (1973) reinterpreted Ward’s results and suggested that increasing
radial momentum flux is counter balanced by increasing outward pressure thrust (due to
counter acting centrifugal forces) and, therefore, the volume flow rate (and not radial
momentum flux) is a crucial factor in the formation of tornado-like vortices. Jischke and
Parang (1973) proposed that viscous torque exerted on the vortex by the boundary layer
region causes transition from a single to double vortex configuration. Harlow and Stein
(1974) conducted a numerical investigation of the flow structure of tornado-like vortices
and reported several previously experimentally obtained results like the dependence of
flow structure on swirl ratio (inflow angles) and formation of multiple vortices at higher
swirl ratios. Church et al. (1977) built a tornado simulator at Purdue University by
improvising the original design by Ward. The wandering of vortex reported in the previous
versions of such tornado simulators was mitigated in this design, primarily by the
introduction of anti-turbulence screen at the inlet that removed unwanted inflow
turbulence. They conducted some preliminary studies, mostly qualitatively in nature, to
verify the previously reported observations like the occurrence of vortex break down,
followed by the formation of multiple vortices, along with reporting the radial and axial
profiles of the velocity components. Rotunno (1978) conducted a numerical study to
explore the evolution of tornado like-vortices with change in swirl ratio and, complying
with previous studies, reported the observation of vortex breakdown at moderate swirl
ratios. Baker and Church (1979) conducted experiments to predict core radii and peak
velocities for modelled vortices of various swirl ratios. Church et al. (1979) concluded that
at sufficiently high Reynold’s number, vortex flow structure is nearly independent of Reynold’s number and is only a function of swirl ratio. They also highlighted that the flow
structure is weakly dependent of aspect ratio and therefore swirl ratio is the governing
parameter. Fiedler and Rutono (1986) put forward a theory for maximum wind speeds
associated with tornadoes and suggested that the fallacy in theory of maximum wind speed
proposed by Lilly (1969) was the assumption of a hydrostatic core. A tornado core can
sustain a greater pressure deficit because of the central downdraft (that begins after vortex
breakdown) and thus leads to wind speed higher than what a hydrostatic core model would
predict. Lugt (1989) studied the vortex breakdown phenomenon and the associated
instabilities, the various critical conditions for single and multicell structures and
differences in the conditions for helically intertwined vortices and multiple vortices.
During this period, a significant contribution was made by researchers towards
understanding the flow structure of tornado-like vortices, mostly using experimental and
analytical methods. However, the interaction of tornadoes with bluff bodies, the effect of
ground roughness and translation on tornado flow field were still to be explored. Wen
(1975) was one of the rare (if not the only) studies during this period where the effect of
dynamic tornadic winds on a structure (tall building) were investigated analytically. The
limitation of experimental tornado simulators at that time was that they did not facilitate
translation and were relatively small so a building model of a reasonable size could not be
used to study the interaction with bluff bodies.
1990s-2005
This was a period of growing computational resources and therefore, given the limitations
of experimental facilities at that time, researchers turned their focus towards using
numerical techniques to study tornado-like vortices and their interaction with ground
surface. During this period, almost all major studies were either numerical or analytical or
both. Lewellen and Lewellen (1995) used LES to simulate tornado’s interaction with
ground and the effect of translation. They showed that the maximum mean tangential
(effectively increasing peak velocities) and induces a tilt that makes the flow asymmetric.
Nolan and Farrell (1999) used numerical simulations to study tornado dynamics and
suggested that vortex Re (𝑅𝑒𝑣 = 𝛺𝐿2
𝜈 ; ratio of far field circulation to eddy viscosity) could
be more effective than swirl ratio to characterize tornado structure. However, researchers
(particularly experimentalists) continue to use swirl ratio, which is easily measurable in an
experimental set up as opposed to vortex Re (since eddy viscosity is not an easily
measurable quantity and is a byproduct of turbulence modelling). Lewellen and Lewellen
(1998) used LES to study “corner flow” dynamics by using appropriate boundary
conditions and suggested the concept of coherent turbulence structures that could
potentially cause greater damage. Selvam and Millet (2003) used Large Eddy Simulation
(LES) (utilizing finite difference scheme to solve the governing equations as opposed to
present day practice of using finite volume formulation) to model tornadic loads on a cubic
building model and concluded that wind loads on a building due to a translating tornado
were higher than those caused by quasi-steady wind. They also observed that the localized
suction pressure spots on the building were higher and occurred in multiple locations. Lee
and Samaras (2004) analyzed the results of HITPU deployed in the path of Manchester,
South Dakota tornado (2003). Nolan (2004) proposed a scaling technique for axisymmetric
flows with the introduction of additional parameters and emphasized the role of vortex
Reynolds number in controlling the flow structure. They concluded that a cyclostrophic
momentum balance yielded reasonable estimates of maximum tangential velocity and core
radius. Lewellen and Lewellen (2006) extended their previous work on tornado ground
interaction and proposed “near ground intensification” using LES.
2006-present
This period saw the rise of experimental simulation of tornado-like vortices and their
interaction with scaled building models with the construction of the first large scale
translating tornado simulator at Iowa State University. With advancements in
instrumentation technology, an increased use of Particle Image Velocimetry (PIV) method
was commonly observed in experimental studies conducted during this period. Haan et al.
(2006) discusses the design, construction and performance of this tornado simulator at Iowa
various geometric parameters and surface roughness on tornadic wind field. Hangan and
Kim (2008) first attempted to link swirl ratio to EF scale but the investigation was limited
to only one case study. They also reported 𝑟𝑐 𝑚𝑎𝑥 to increase and 𝑧𝑚𝑎𝑥 to decrease with
increasing swirl ratio. Sengupta et al. (2008) used LES to study transient loading on
buildings due to tornadoes and downbursts and found that the peak loads exceed the ASCE
7-05 provisions for ABL wind load by 1.5 times for F2 scale tornadoes. Mishra et al. (2008)
analyzed the flow field and pressure profiles produced in TTU-VSII and obtained a length
scale of 1: 3500 (for TTU-VSII produced vortices) by using cyclostrophic momentum
balance. They proposed the construction of a larger simulator called VorTECH at TTU
since the length of TTU-VSII was found to be an order of magnitude smaller than typical
wind engineering length scales. Mishra et al. (2008) analyzed the forces and pressure
coefficients on a cubic building model placed in TTU-VSII in various locations with
respect to the vortex centre and demonstrated the inadequateness of scaling up straight line
wind Cp for evaluating tornadic loads. They also emphasized on the need to construct a
larger testing facility (VorTECH) to host building models of reasonable sized. Xu and
Hangan (2009) analytically modelled inviscid tornado-like vortex using a free narrow jet
solution combined with a modified Rankine vortex and the analytically obtained velocity
components showed good agreement with experimental and numerical results. They also
highlighted that experimental inputs could improve the robustness of their analytical
model. Tamura (2009) discusses the influence of inflow conditions and swirl ratio on
tornado-like vortices but was unable to confirm the appearance of multiple vortices at
higher swirl ratio (expanded core only) in the experimental tornado simulator in Japan.
Sabareesh et al. (2009) compared the surface pressure distribution on a cubic building
under ABL and tornadic wind loading and found significant differences in statistical values
of Cp. Haan et al. (2010) tested low-rise buildings under tornadic loading and reported
peak loads up to 50% higher than ABL wind load provisions in ASCE-7-05. Hashemi et
al. (2010) conducted PIV measurements to analyze the flow field of laboratory produced
tornado-like vortices at a wide range of swirl ratios. They demonstrated the occurrence of
maximum tangential and radial velocities close to the ground surface and reported an
increase in shear stresses with an increase in swirl ratio due to the turbulent nature of the
typical low-rise gable roof structure and progressively modeled the damage using finite
element analysis. They reported a significant reduction in wind loads due to tornadoes once
the roof was blown off for such structures. Yang et al. (2011) conducted PIV and force
measurements on a high-rise building model and discussed the structure of highly turbulent
wake around the building, along with variations in forces and moments with respect to
building position. Zhang and Sarkar (2012) conducted experiments in a 1:3 scaled model
version of the tornado simulator at ISU and quantified the extent of underestimation of
tangential velocity and core radius due to wandering effects. Natarajan and Hangan (2012)
used LES to study translational and roughness effects, reported reduction in max mean
tangential velocity at lower swirl ratio and increase at higher swirl ratio. While Sabareesh
et al. (2013) investigated the effect of openings in a building on peak roof loads under
tornado-like wind, Sabareesh et al. (2013) studied the effect of ground roughness on
internal pressure characteristics of a building subjected to tornado-like wind field. Case et
al. (2014) experimentally studied the effect of low rise building geometry on tornado
induced loads and found the peak loads to vary with eave height, pitch, aspect ratio etc.
They highlighted the importance of adequate design of roof to wall connections for tornado
resistant (up to EF3) design of low rise building. Refan et al. (2014) used a model of
WindEEE as a proof of concept for WindEEE dome and developed a unique scaling
technique to link laboratory produced vortices to real tornadoes. Refan (2014) conducted
extensive PIV measurements to analyze tornado flow field in model WindEEE (1:11 scale
replica of WindEEE Dome). Hangan (2014) discusses the design of the Wind Engineering
Engery and Environment (WindEEE) Dome that was built at Western University and is a
hexagonal shaped 3-D wind chamber capable of producing both synoptic and non-synoptic
wind fields. Refan and Hangan (2016) showed the independence of flow structure and
radial Reynolds number (above a threshold value) and its dependence of swirl ratio, for
vortices produced in model WindEEE. Hanagn et al. (2016) discussed the application of
the Wind Engineering Energy and Environment (WindEEE) Dome towards simulation of
a large variety of wind systems (synoptic and non-synoptic).
More recently, Refan et al. (2017) demonstrated the independence of pressure distribution
on a building model and radial Reynold’s number. Karami et al. (2017) proposed Proper
pressure field, enabling the reconstruction of large scale fluctuating pressure field. Nasir
and Bitsuamlak (2016) used CFD (numerical methods) to study the effects of topographical
changes on tornadic wind field and developed FSUR (fractional speed up ratio) for
tornadoes analogous to straight-line ABL wind. Nasir and Bitsuamlak (2016) also
computationally evaluated the effects of tornadic loads on a tall building. Nasir (2017)
investigated the effect of tornado-like wind on typical flat roof mid-rise building and
high-rise building and discussed the resulting surface pressure distribution and forces with
respect to building location and orientation. Nasir (2017) also showed that for a building
with opening(s), the external surface pressure distribution is sensitive to opening
configuration, internal pressure, building location (for stationary vortex), building
orientation and tornado translation. Kopp and Wu (2017) proposed the use of quasi-steady
models to develop a framework to assess wind loads due to tornadoes while examining the
differences in tornado and atmospheric boundary layer flow structures. They discussed the
similarities and differences in wind loads predicted using quasi-steady theory and
demonstrated the promise QS displayed for such purpose. Vickery et al. (2017) highlighted
the problem in directly comparing external surface pressure coefficients due to tornadoes
and ABL wind due to differences in normalizing velocity and due to local atmospheric
pressure change experienced during tornadoes. They also compared their tornado load
model, which accounts for debris and varying internal pressure, with damage observed
during the Joplin tornado.
1.2
Motivation and objective
It is a common practice in experimental studies to use the geometric dimensions and
configuration of physical elements (like guide vane angle, ceiling height, etc.) of the
experimental simulators to characterize the generated vortices. However, the inherent
differences in geometric dimensions and vortex generation mechanism of the existing
experimental tornado simulators makes vortex characterization very specific to an
individual facility and hinders direct comparison and validation of results.
In this research, it is envisioned to develop a simple, generic numerical model that would
fit the flow structure of a tornado-like vortex and account for the geometric and mechanical
accurately as possible. To achieve this, the parameters used to characterize a tornado-like
vortex (inflow depth, radius of updraft, etc.) are strictly extracted from the numerically
produced flow-field inside the tornado simulators (as opposed to using physical dimensions
of the simulators) during the development of the generic numerical tornado model. The
developed generic numerical tornado model can then be used to directly compare results
from different experimental simulators and facilitate a universal/common interpretation.
The utility of this numerical model for bluff-body aerodynamics applications and
wind-load evaluation is further demonstrated.
1.3
Thesis layout
This thesis is written in the integrated article format. Chapter 1 presents a brief introduction
to tornado research. Chapter 2 is focused on developing a generic numerical tornado model.
Chapter 3 discusses the application of this generic numerical tornado model to bluff-body
aerodynamics and wind load evaluation. Chapter 4 presents the conclusions made from this
References
[1] Baker G.L., and Church C.R. "Measurements of core radii and peak velocities in
modeled atmospheric vortices." Journal of the Atmospheric Sciences 36.12 (1979):
2413-2424.
[2] Banik S. S., Hong H. P., and Kopp G.A. "Assessment of tornado hazard for spatially
distributed systems in southern Ontario." Journal of Wind Engineering and Industrial
Aerodynamics 96.8 (2008): 1376-1389.
[3] Banik S. S., Hong H. P., and Kopp G.A. "Assessment of the wind hazard due to
tornado outbreaks in southern Ontario." Journal of Wind Engineering and Industrial
Aerodynamics 107 (2012): 28-35.
[4] Benjamin T.B. "Theory of the vortex breakdown phenomenon." Journal of Fluid
Mechanics 14.4 (1962): 593-629.
[5] Bossel H. H. "Vortex breakdown flow field." The Physics of Fluids 12.3 (1969):
498-508.
[6] Case J, Sarkar P, and Sritharan S. "Effect of low-rise building geometry on
tornado-induced loads." Journal of Wind Engineering and Industrial Aerodynamics 133 (2014):
124-134.
[7] Church C. R., Snow J. T, and Agee E.M. "Tornado vortex simulation at Purdue
University." Bulletin of the American Meteorological Society 58.9 (1977): 900-908.
[8] Church C. R., Snow J. T, and Agee E.M. "Characteristics of tornado-like vortices as
a function of swirl ratio: A laboratory investigation." Journal of the Atmospheric Sciences
36.9 (1979): 1755-1776.
[9] Davies-Jones R.P. "The dependence of core radius on swirl ratio in a tornado
[10] Dinwiddie F.B., “Waterspout-Tornado Structure and Behavior at Nags Head, N.C.,
August 12, 1952,” Monthly Weather Review, Vol. 87, No. 7, July 1959, pp. 239-250.
[11] Etkin D. A. "Extreme events and natural disasters in an era of increasing
environmental change." Report of Workshop on Emerging Environmental Issues in
Ontario. Environmental Monograph. Vol. 15. 1999.
[12] Fiedler B.H., and Rotunno R. "A theory for the maximum windspeeds in
tornado-like vortices." Journal of the Atmospheric Sciences 43.21 (1986): 2328-2340.
[13] Fujita T.T. “A detailed analysis of the Fargo tornadoes of June 20, 1957.” Vol. 30.
US Government Printing Office, 1960.
[14] Fujita T.T. "Proposed characterization of tornadoes and hurricanes by area and
intensity." (1971).
[15] Haan Jr, F L., Sarkar P.P, and Gallus W.A. "Design, construction and performance
of a large tornado simulator for wind engineering applications." Engineering
Structures 30.4 (2008): 1146-1159.
[16] Haan Jr, F. L., Balaramudu V.K, and Sarkar P. P. "Tornado-induced wind loads on a
low-rise building." Journal of Structural Engineering136.1 (2009): 106-116.
[17] Hall S.G., and Ashley W.S. "Effects of urban sprawl on the vulnerability to a
significant tornado impact in northeastern Illinois." Natural Hazards Review 9.4 (2008):
209-219.
[18] Hangan H., and Kim J. D. "Swirl ratio effects on tornado vortices in relation to the
Fujita scale." Wind and Structures 11.4 (2008): 291-302.
[19] Harlow F.H., and Stein L.R. "Structural analysis of tornado-like vortices." Journal of
the Atmospheric Sciences 31.8 (1974): 2081-2098.
[20] Hangan H., “The Wind Engineering Energy and Environment (WindEEE) Dome at
[21] Hangan H., Refan M., Jubayer C., Parvu G., ““Big Data from Big Experiments. The
WindEEE Dome”, Springer Verlag, 2016.
[22] Hashemi T.P., Gurka R., and Hangan H. "Experimental investigation of tornado-like
vortex dynamics with swirl ratio: the mean and turbulent flow fields." Journal of Wind
Engineering and Industrial Aerodynamics 98.12 (2010): 936-944.
[23] Hoecker Jr, W.H., “The Dimensional and Rotational Characteristics of the
Tornadoes and Their Cloud System,” pp. 53- 113 of “The Tornadoes at Dallas, Tex., April 2, 1957,” Research Paper No. 41, U.S. Weather Bureau, Washington, D.C., 180 pp.
(in press).
[24] Hoecker Jr, W. H. "Wind speed and air flow patterns in the Dallas tornado of April
2, 1957." Monthly Weather Review 88.5 (1960): 167-180.
[25] Jischke M. C., and Parang M. "Properties of simulated tornado-like
vortices." Journal of the Atmospheric Sciences 31.2 (1974): 506-512.
[26] Karami M., Romanic D., Maryam R., and Hangan H. "Modelling of tornado-like
vortices." 100 Islands Fluid Mechanics Meeting, Ontario, Canada. 2017.
[27] Kopp G.A and Wu C.H. "A framework for the aerodynamics of low-rise buildings in
tornadoes: Can boundary layer wind tunnels give us everything we need?" 13th Americas
Conference on Wind Engineering, Florida, USA. 2017.
[28] Kuai Le, et al. "CFD simulations of the flow field of a laboratory-simulated tornado
for parameter sensitivity studies and comparison with field measurements." Wind and
Structures 11.2 (2008): 75-96.
[29] Lee J.J., Samaras T., and Young C. R. "Pressure measurements at the ground in an
F-4 tornado." Preprints, 22nd Conf. on Severe Local Storms, Hyannis, MA, Amer.
[30] Lewellen W. S., Lewellen D. C., and Sykes R. I. "Large-eddy simulation of a
tornado’s interaction with the surface." Journal of the Atmospheric Sciences54.5 (1997):
581-605.
[31] Lewellen D. C., Lewellen W. S., and Xia J. "The influence of a local swirl ratio on
tornado intensification near the surface." Journal of the Atmospheric Sciences 57.4
(2000): 527-544.
[32] Lewellen D. C., and Lewellen W. S. "Near-surface intensification of tornado
vortices." Journal of the Atmospheric Sciences 64.7 (2007): 2176-2194.
[33] Lilly K. "Tornado dynamics." (1969). National Center for Atmospheric Research
Manuscript 69-117.
[34] Lugt H. J. "Vortex breakdown in atmospheric columnar vortices." Bulletin of the
American Meteorological Society 70.12 (1989): 1526-1537.
[35] Matsui M, and Tamura Y. "Influence of swirl ratio and incident flow conditions on
generation of tornado-like vortex." Proc. 5th European-African Conferences on Wind
Engineering, Florence, Italy. 2009.
[36] Mishra A., R., Darryl L.J, and. Letchford C.W. "Physical simulation of a
single-celled tornado-like vortex, part A: flow field characterization." Journal of Wind
Engineering and Industrial Aerodynamics 96.8 (2008): 1243-1257.
[37] Mishra A. R., James D. L., and Letchford C. W. "Physical simulation of a
single-celled tornado-like vortex, Part B: Wind loading on a cubical model." Journal of Wind
Engineering and Industrial Aerodynamics 96.8 (2008): 1258-1273.
[38] Nasir Z., and Bitsuamlak G.T. "NDM-558: Computational modeling of Tornadic
Load on a Tall Building." CSCE Annual Conference, London Convention Center,
[39] Nasir Z., and Bitsuamlak G.T. "NDM-557: Computational Modeling of Hill Effects
on Tornado-like Vortex." CSCE Annual Conference, London Convention Center,
London, Ontario, Camada 2016.
[40] Nasir Z., “Numerical modeling of tornado-like vortex and its interaction with
bluff-bodies." PhD Thesis. Western University, Canada (2017).
[41] Natarajan D., and Hangan H. "Large eddy simulations of translation and surface
roughness effects on tornado-like vortices." Journal of Wind Engineering and Industrial
Aerodynamics 104 (2012): 577-584.
[42] Newark M. J. "Canadian tornadoes, 1950–1979." Atmosphere-Ocean22.3 (1984):
343-353.
[43] Nolan D.S., and Farrell B.F. "The structure and dynamics of tornado-like
vortices." Journal of the Atmospheric Sciences 56.16 (1999): 2908-2936.
[44] Nolan D. S. "A new scaling for tornado-like vortices." Journal of the atmospheric
sciences 62.7 (2005): 2639-2645
[45] Rajasekharan S.G., Matsui M., and Tamura Y. "Characteristics of internal pressures
and net local roof wind forces on a building exposed to a tornado-like vortex." Journal of
Wind Engineering and Industrial Aerodynamics 112 (2013): 52-57.
[46] Refan M., Hangan H., and Wurman J. "Reproducing tornadoes in laboratory using
proper scaling." Journal of Wind Engineering and Industrial Aerodynamics 135 (2014):
136-148.
[47] Refan M. "Physical simulation of tornado-like vortices." PhD Thesis. Western
University, Canada (2014).
[48] Refan M., and Hangan H. "Characterization of tornado-like flow fields in a new
model scale wind testing chamber." Journal of Wind Engineering and Industrial
[49] Refan M and Hangan H. "Surface pressures dependency on Reynolds number and
swirl ratio in tornado-like vortices." 13th Americas Conference on Wind Engineering,
Florida, USA. 2017.
[50] Rotunno R. "A study in tornado-like vortex dynamics." Journal of the Atmospheric
Sciences 36.1 (1979): 140-155.
[51] Sabareesh G. R., et al. "Pressure acting on a cubic model in boundary-layer and
tornado-like flow fields." Proceedings of the 11th American Conference on Wind
Engineering, Puerto Rico, USA. 2009.
[52] Sabareesh G.R, Matsui M., and Tamura Y. "Ground roughness effects on internal
pressure characteristics for buildings exposed to tornado-like flow." Journal of Wind
Engineering and Industrial Aerodynamics 122 (2013): 113-117.
[53] Selvam R. P, and Millett P.C. "Computer modeling of tornado forces on a cubic
building using large eddy simulation." Journal of the Arkansas Academy of Science 57.1
(2003): 140-146.
[54] Sengupta A., Haan Jr F.L., Sarkar P., and Balaramudu V. "Transient loads on
buildings in microburst and tornado winds." Journal of Wind Engineering and Industrial
Aerodynamics 96.10 (2008): 2173-2187.
[55] Thampi H., Dayal V., and Sarkar P. "Finite element analysis of interaction of
tornados with a low-rise timber building." Journal of Wind Engineering and Industrial
Aerodynamics 99.4 (2011): 369-377.
[56] Vickery J.P, Banik S, Twisdale Jr. L., and Long P. Tornado damage modelling:
Understanding the role of local atmospheric change, wind directionality, and transient
wind field intensity" 13th Americas Conference on Wind Engineering, Florida, USA.
2017.
[57] Ward N. B. "The exploration of certain features of tornado dynamics using a
[58] Wen Y.K. "Dynamic tornadic wind loads on tall buildings." ASCE Journal of the
Structural Division 101.1 (1975): 169-185.
[59]Xu Z. and Hangan H. “An Inviscid Solution for Modeling of Tornado-like
Vortices.” ASME Journal of Mechanics,DOI 101115/1.3063632, Vol. 76, 031011 (5pp),
2009.
[60] Yang Z., Sarkar S., and Hu H. "An experimental study of a high-rise building model
in tornado-like winds." Journal of Fluids and Structures 27.4 (2011): 471-486
[61] Ying S. J., and Chang C. C. "Exploratory model study of tornado-like vortex
dynamics." Journal of the Atmospheric Sciences 27.1 (1970): 3-14.
[62] Zhang W., and Sarkar P. "Near-ground tornado-like vortex structure resolved by
Chapter 2
2
Generic numerical tornado model for common
interpretation of existing experimental simulators
The current state of the art in studying tornado-like vortices at engineering scale (which is
to be differentiated from meteorological scale, for example Orf et al. (2014), Orf et al.
(2016)) dictates the use of mechanically driven vortices in experimental simulators.
However, the differences in mechanisms utilized to produce these vortices coupled with
the physical limitations of measuring various characterizing parameters of a tornado-like
vortex (aspect ratio, swirl ratio etc.) in an experimental set up and geometric differences in
various facilities, often lead to misinterpretation of results and makes these results very
specific to the experimental set-up in consideration. The present study develops a generic
numerical simulator that unifies the existing experimental simulators and facilitates a
universal interpretation. For this purpose, VorTECH at Texas Tech University (TTU),
Tornado Simulator at Iowa State University (ISU) and WindEEE Dome at Western
University (WU), are chosen as representatives of “Ward” type, “top-down” type and “3D
wind chamber” type simulators, respectively. In the first stage, each experimental
simulator is numerically modelled without any simplification (or modification) and placed
in a bigger computational domain to simulate its placement in a lab environment with
closed-circuit flow. Then, the relevant boundary conditions and flow parameters are
extracted for different configurations of each physical simulator to allow simplification of
the original models during the second stage of the study. The simplification of the original
models is primarily based on the geometric and kinematic parameters used to characterize
these vortices, obtained from the numerical results of the first stage and the type of flow in
the original models (bounded or unbounded). The parameters (geometric and kinematic)
used to characterize a vortex (inflow depth, radius of updraft, swirl, etc) are strictly
obtained from the flow-field as opposed to the commonly observed practice of directly
using the geometric dimensions and configuration of physical elements (like guide vane
angle, ceiling height, etc) of the experimental simulators. Although the flow structure of
tornado-like vortices is seen to be independent of the radial 𝑅𝑒𝑟 (above 𝑅𝑒𝑟~104), which
magnitude (𝑅𝑒𝑟 or volume flow rate) is conducted, as and when required, to maintain
similar magnitudes of velocities and pressures in the flow field apart from preserving the
original flow structure. The analysis of the velocity and pressure profiles obtained from the
original models leads to a generic simplified numerical tornado model, which can still be
linked to the experimental simulators using a unique calibration scheme developed during
this study. Thus, a numerical tornado model is obtained that could (i) aid in linking the
interpretation of results between the various experimental simulators, and (ii) produce
preliminary tornado design parameters numerically.
2.1
Tornado-like vortices
Experimentally and numerically produced vortices are most commonly characterized by
three non-dimensional parameters, aspect ratio (geometric), swirl ratio (kinematic) and
radial Reynolds number (dynamic), which are defined below.
Aspect ratio (𝑎): 𝑎 =ℎ0
𝑟0 , here ℎ0 is the inflow depth and 𝑟0 is the radius of updraft ( 𝑣𝑧 ≈
0 approximation should hold good at 𝑟 = 𝑟0). It is widely believed that tornadoes are low
aspect ratio (less than or around unity) phenomena in nature (Ward (1972), Davies-Jones
(1973), etc).
Swirl ratio (𝑆): 𝑆 = ( 𝑣𝑡
𝑣𝑟.2𝑎)𝑟=𝑟0 = (
𝑟0𝛤∞
2𝑄𝑧)𝑟=𝑟𝑐
Here, 𝑣𝑡 is tangential velocity, 𝑣𝑟 is radial velocity, 𝑎 is aspect ratio, 𝑟0 is the radius of
updraft, 𝑟𝑐 is the core radius, 𝑄 is the volume flow rate per unit axial length and 𝑧 is the
axial location, 𝛤∞ is the maximum circulation, which is further defined as following
(integral below is evaluated along the circumference of the core).
𝛤∞= ∮ 𝑣𝑡𝑑𝑟
Swirl ratio is a function of position, i.e. 𝑆(𝑟, 𝑧). Thus, swirl ratio definition would yield
different values at various locations in the wind field. Although, no clear guidelines were
found in previous studies regarding the location of calculating swirl ratio, Refan (2014)
demonstrated that the angle based definition applied at the radius of updraft yields values
close to those obtained by applying the circulation based definition at the core radius.
Therefore, care must be taken while calculating swirl ratio, to avoid any discrepancy in
results. Due to uncertainties associated with core radius measurements (because of vortex
wandering) needed for circulation based definition, the inflow angle based definition
(applied at the radius of updraft) is used throughout the analysis in the present study.
Radial Reynolds Number (𝑅𝑒𝑟): 𝑅𝑒𝑟 = 𝑄
2𝜈, 𝑄 is the volume flow rate per unit axial length
and 𝜈 is the kinematic viscosity. Church (1979) showed the independence of flow structure
from radial Reynolds number (provided 𝑅𝑒𝑟 is above ~104).
It should be noted that the above parameters are not identifiable for real tornadoes and
therefore linking simulated (experimentally and numerically) vortices to real tornadoes
remains one of the biggest challenges. In this regard, Refan et al. (2014) proposed a unique
scaling technique to link simulated vortices to real tornadoes using a common length scale
(axial and radial), developed during a matching process. Therefore, a simulated vortex at a
specific swirl ratio could replicate the aerodynamic effects of a real tornado (or a target
tornado) at a certain length scale, provided the flow structure of the simulated vortex bears
2.1.1
Tornado-like wind field description
Mathematically, a two-dimensional sink vortex (in r- θ plane) can be characterized as
(𝑣𝑡+ 𝑣𝑟)𝑟 = 𝐶 Equation 2-1
Where 𝑣𝑡 and 𝑣𝑟 are the tangential and radial components of the velocity and 𝐶 is a
constant. The equation above can be further decomposed as following,
𝑣𝑡𝑟 = 𝑐1 Equation 2-2
𝑣𝑟𝑟 = 𝑐2 Equation 2-3
Here, 𝑐1 and 𝑐2 are constants. Equation 2-2 arises from conservation of angular momentum
while Equation 2-3 arises from conservation of mass in the r- θ plane for 2-dimensional
flow.
However, tornado-like wind field is 3-dimensional in nature with significant axial velocity
(𝑣𝑧). Due to the three dimensionality of a tornado-like wind field, the constraint imposed
by Equation 2-3 is removed.
𝑣𝑟𝑟 ≠ 𝑐2 Equation 2-4
The flow is now free to expand along the r-z plane as it approaches the core region and the
loss of radial momentum is seen in the form of increasing axial flux. The flow field
(depicted by streamlines), outside core region is spiral with significant radial velocity.
However, there is a constant trade-off between axial and radial velocities as the flow
approaches the core, resulting in loss of radial momentum. Tangential velocity, on the other
hand, constantly increases towards core region, due to conservation of angular momentum
(Equation 2-2). The core, also seen as the limit of radial convergence, is that region in
tornado-like wind field where the converging force (possessed by radial momentum) is
counter balanced by the centrifugal force (possessed by angular momentum). As a result
body under its shear, thereby forming the core. The flow in the core region has negligible
radial velocity and is dictated only by tangential velocity, so the streamlines inside the core
are ideally expected to be concentric circles. This solid body rotation of core results in a
linearly decreasing tangential velocity towards the centre, as shown below.
𝑣𝑡 = 𝜔𝑟 Equation 2-5
Similar behaviour of tangential velocity along the radial direction is also seen in the
modified Rankine vortex model (shown in Equation 2-6) , which is one of the most
commonly adopted model for describing the radial profile of tangential velocity in
tornado-like wind field.
𝑣𝑡(r)= 𝑟𝛤∞
𝜋(𝑟2+𝑟
𝑐2) Equation 2-6
It should be noted that the above description of tornado wind field is idealized and the wind
field of real (and experimental) tornadoes can have deviations from this description due to
interaction with ground and translational effects. The description of flow field within the
core fits better for a hydrostatic core model and thus tends to deviate at higher swirl ratio
due to vortex breakdown. Further, even for low swirl ratios, the idealized description of
the vortex may not fit exactly due to instabilities associated with low swirl vortex cores. A
detailed explanation of these deviations is, however, beyond the scope of the present work.
This description of tornado wind field, none the less, forms the basis of numerical
modelling of tornadoes. It is expected that the ease of simplification process and the
accuracy of the generic model proposed in this study would also depend (to some extent)
on how closely the experimentally produced wind field matches the idealized mathematical
2.1.2
Simplification strategy for numerical simulation of
tornado-like vortices
The simplification of experimental tornado simulators into one numerical model is based
on identifying the characterizing parameters for various configurations of each
experimental facility and then utilizing them for a generic model. These parameters like
radius of updraft, inflow depth, etc, are strictly obtained from the flow-field inside the
experimental simulators (generated numerically), as opposed to directly using the physical
dimensions of the experimental facilities to obtain the same. First the geometric parameters
of the flow structure are identified, i.e. inflow depth (ℎ0) and radius of updraft (𝑟0). An
important characteristic of the flow at the radius of updraft is that 𝑣𝑧≈ 0 approximation
should hold good (negligible updraft). Then, the geometric parameters of the physical
simulator are identified, i.e. height of location of updraft hole (or bell mouth of the exhaust
region) (ℎ𝑢), and the radius of the updraft of hole (or bell mouth) (𝑟𝑢). It will be seen in
the sections to follow that the effective radius of updraft hole may or may not be equal to
the actual radius of the physical updraft hole in an experimental set-up. Thus, for each
configuration, the flow geometric parameters (ℎ0 and 𝑟0) and simulator geometric
parameters (ℎ𝑢 and 𝑟𝑢) dictate the dimensions of the simplified computational domain,
while the kinematic parameter (swirl ratio or ratio of 𝑣𝑡 and 𝑣𝑟 at inlet) governs the inflow
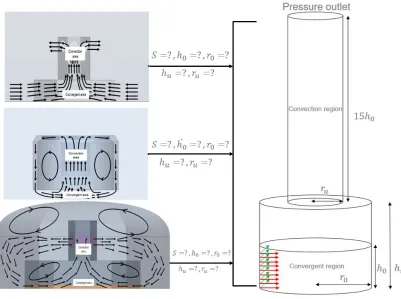
boundary condition. This has been illustrated in Figure 2-2. The height of the convection
region is kept 15 times ℎ𝑢 (“far enough”) to allow the top of the cylindrical domain to be
treated as “pressure outlet” boundary. In the initial phase of this study, different heights of
the convection region were simulated (25 times ℎ𝑢 , 20 times ℎ𝑢, etc). It was found that
while in an experimental set-up, the height of convection region could affect the flow
structre (due to the location of honeycomb section to decouple the fan vorticity), but in a
simplified numerical model, this height of convection region was found to be independent
of flow structure, at least upto 15 times ℎ𝑢. Further reduction in the height of the convection
region might be possible, but that would require an independent parametric study. For the
present research, we will use 15 ℎ𝑢, as the height of convection region). A crucial
difference between bounded systems like VorTECH and unbounded systems like ISU
Tornado Simulator and WindEEE is that the for bounded system ℎ0 = ℎ𝑢 (inflow in
At last, the inflow velocities 𝑣𝑡 and 𝑣𝑟 are identified (no 𝑣𝑧 since 𝑣𝑧 ≈ 0 at 𝑟0). The idea is
to use “double concentric” cyclinders as shown in Figure 2-2 that would require only
uniform tangential and radial velocities (the inflow velocity profiles at the radius of updraft
were observed to be uniform, and will be shown in the following sections) as the inflow
boundary condition, but could still replicate the laboratory produced flow field as
accurately as possisble.
Figure 2-2 Simplification strategy.
During this study, the ground static pressure profile, radial profile of tangential velocity at
various heights and qualitative appearance of the vortex flow structure are used to compare
the flow-fields obtained from full CFD models (of each experimental facility) with those
obtained from generic numemrical model. Further, for comparing ground static pressure
profiles, all pressures are referenced to the ground static pressure at the radius of updraft
(i.e. with conditions upstream of the flow), previously done by Nasir (2017) for numerical
(a) VorTECH at Texas Tech University (bounded flow)
(b) Tornado Simulator at Iowa State University (unbouned flow)
(c) WindEEE Dome at Western University (unbounded flow)
Figure 2-3 Illustration of difference between bounded and unbounded flow.
The idea behind this study is that while various experimental facilities might have their
differences (geometric dimensions and vortex generation mechanism), they can still be
unified with a generic numerical model, if the characterizing parameters are extracted from
the flow field inside the experimental simulators, as opposed to using geometric
(a) VorTECH at TTU (b) Tornado Simulator at ISU
(c) WindEEE Dome at WU
(d) Tornado-like vortex flow structure
Figure 2-4 Unification of experimental facilities.
The configurations for each facility considered in the present study have been summarized
in Table 2-1. The details of configurations for TTU VorTECH and ISU Tornado Simulator
VorTECH (TTU) Tornado Simulator (ISU) WindEEE Dome (Western) 10- degree (vane angle)
20- degree (vane angle)
30- degree (vane angle)
40- degree (vane angle)
50- degree (vane angle)
60- degree (vane angle)
70- degree (vane angle)
Vane 1 Vane 2 Vane 3 Vane 4 Vane 5
Fan 1 Fan2 Fan3
Floor 1 Floor 2 Floor3
15-degree (vane angle)
Table 2-1 Summary of configurations considered.
It should be noted that due to unavailability of documentation of other configurations of
WindEEE and time constrain posed during this study, only one WindEEE configuration
was considered. It would be desirable to simulate more WindEEE configurations for future
studies.
2.2
Experimental tornado simulators
A brief description of the three experimental tornado simulation facilities in consideration
has been presented in this section.
2.2.1
VorTECH at Texas Tech University
VorTECH at Texas Tech University, inspired by the original design built by Ward (1972),
is an octagonal shaped experimental tornado simulator that is driven by 8 exhaust fans,
installed in a 4-m wide upper chamber. The lower chamber (10.2-m wide) consists of 64
guide vanes at the inlet that can be set to various angles to impart desired swirl to the flow.
The schematic of this simulator, adapted from Zhou et al. (2016), is shown in Figure 2-5
This simulator can generate tornado like vortices with aspect ratios ranging from 0.5 to1,
swirl ratios ranging from 0 to 2.2 and Re 𝑟of the order of 105 (Zhou et al. (2016)). The
aspect ratio is changed by altering the ceiling height of the lower chamber with the help of