Performance Evaluation of Micro Rain Radar over Sumatra through
Comparison with Disdrometer and Wind Profiler
Marzuki1, *, Hiroyuki Hashiguchi2, Toyoshi Shimomai3, Indah Rahayu1, Mutya Vonnisa1, and Afdal1
Abstract—Micro Rain Radar (MRR) is a vertical pointing microwave profiler to measure hydrometeors and related parameters in high resolution. However, it is known that the MRR suffers from certain
limitations due to several factors. This paper evaluates the performance of the MRR installed at
Kototabang, west Sumatra, Indonesia (0.20◦S, 100.32◦E, 864 m above sea level). The DSD and rainfall
rate from the MRR standard processing method had been evaluated by using collocated measurements of MRR, Parsivel disdrometer and Optical Rain Gauge (ORG) during 2014. Furthermore, 1.3 GHz wind profiler (BLR) observation was used to examine the vertical profiles of radar reflectivity and Doppler velocity. It was found that there were noticeable differences between the MRR and Parsivel in the small
and large size ends of the DSD. At small sized drop (<1 mm), the DSD spectra of MRR was higher than
that obtained by the Parsivel otherwise it was smaller for large sized drop (>2 mm). Underestimation
of large sized drops in the MRR could be responsible for the underestimation of surface rainfall rate and daily rainfall. The source of differences in the DSD seems the measurement shortcomings such as attenuation correction and vertical wind effects, particularly during heavy rain. The shortcomings were observed from the comparison of mean Doppler velocity profiles between the MRR and the BLR. While the melting layer height of the two instruments was the same, the mean Doppler velocities of MRR shown downward increasing (DI) pattern through all rainfall intensities. On the other hand, for the
BLR, the DI was only observed for heavy rain (>10 mm/h), while downward decreasing was observed
for light rain (<5 mm/h). Similar pattern was also observed for the vertical profile of radar reflectivity. Thus, some corrections are needed for heavy rain, nevertheless, the MRR installed at Kototabang can be utilized for light rain. Comparisons indicated that the mean Doppler velocity and the DSD for the
light rain as well asZ-Rrelation were in reasonable agreement with the reference of BLR, Parsivel and
previous studies using the MRR.
1. INTRODUCTION
Measurements of raindrop size distribution (DSD) have a broad list of applications in telecommunication, meteorology, hydrology, and related sciences. The performance of communication links in frequencies above 5 GHz are affected by rain attenuation so the attenuation is one of the most crucial factors to be considered in the link budget estimation [1, 2]. The rain attenuation is a function of raindrop, and consequently can be predicted when the DSD data are available [1, 3–5]. In addition, weather radar
operation also requires the information on the DSD. The radar only provides the radar reflectivity (Z)
and we need to convert it to rainfall rate (R) by using an equation which is commonly known as theZ-R
relation. The equation relates the measured Z and the estimated R and can be derived traditionally
Received 28 July 2016, Accepted 7 September 2016, Scheduled 14 September 2016 * Corresponding author: Marzuki ([email protected]).
from long-term observations of DSD [6, 7]. Finally, knowledge of the DSD is also important in cloud physics [8, 9], soil erosion study [10], and harvesting energy from raindrop [11].
While the DSD has a broad list of application, study on the DSD in Indonesia is still limited to few locations. A pioneering study on the DSD was conducted at Bogor, west Jawa, Indonesia, by using a raindrop camera [12]. The number of study particularly at Kototabang, west Sumatra increases after Equatorial Atmosphere Radar (EAR) facilities were completed in this area [1, 9, 13–18]. Furthermore, regional variability of DSD along the equatorial Indonesia has been also observed through a network of Parsivel disdrometer observation at Kototabang, Pontianak, Manado and Biak [19]. The aforementioned studies mostly deal with the surface DSD. The evolution of rain drops before reaching the ground surface may have a significant effect on the DSD application. For example, the radar reflectivity is an inherent property of the DSD which is proportional to the 6th power of the drop sizes. Thus, the variation in the raindrop during their fall may partly lead to the variation of vertical profile of reflectivity (VPR) that influences the accuracy of quantitative precipitation estimation based on the weather radar.
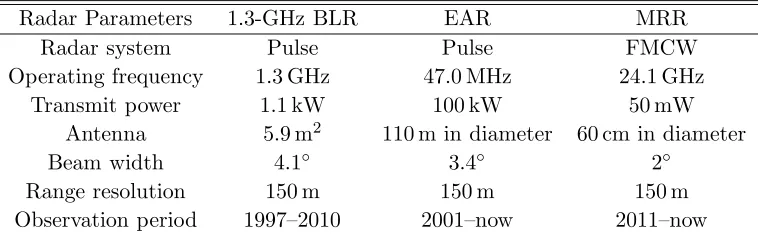
Radar provides a unique tool to estimate the vertical profile of DSD. The EAR observatory has several radars which are operated at different frequencies (Table 1) that can be used to study such profile. The first instrument is the EAR operating at 47 MHz. The ability of EAR to estimate the DSD has been described by several papers [13, 15]. However, the VHF profiler like EAR is unable to
resolve small drops (< 1 mm) [20]. The second instrument is L-Band Boundary Layer Radar (BLR)
operating at UHF frequency (1.3 GHz) [21]. The BLR is primarily sensitive to the precipitation echoes and capable of resolving small drops. However, the precipitation echo completely suppresses the echo due to Bragg scatter in moderate to heavy rains at heights above about 1.5 km. In such case, dual-frequency wind profiler DSD retrievals (EAR/BLR) is better than single-dual-frequency [22]. The third instrument is Micro Rain Radar (MRR) operating at 24.1 GHz. The MRR is a frequency-modulated
continuous-wave (FM-CW) radar pointed vertically with a 0.6 m offset antenna (2◦ beamwidth) [23, 24].
It is capable of resolving small drops and successful investigations using this radar have been reported in many literatures [25–29]. However, the accuracy of MRR has been questioned due to several problems such as strong rain attenuation at the frequency of 24.1 GHz [30] and the vertical wind that affects the fall speed of the drops [26], particularly in heavy rain. Thus, some correction techniques have been proposed to improve the MRR standard processing method [28, 31]. The MRR installed at Kototabang has been overhauled by Meteorologische Messtechnik GmbH (Metek) and the firmware and software were replaced to the newest ones at that time. Thus, new attenuation correction scheme [30] may have been adopted to our instrument. The instrument is reinstalled in September 2011 and few results are published in a literature [9]. However, the performance of our MRR has not yet been investigated in detail. Thus, this paper evaluates the performance by using the collocated measurement of MRR, Parsivel disdrometer and Optical Rain Gauge (ORG) during January-December 2014. Furthermore, the BLR observation was used to examine the accuracy of the vertical radar reflectivity and Doppler velocity retrieval from the MRR. This study can be additional reference for ongoing effort to improve the MRR performance.
Table 1. Radar specifications.
Radar Parameters 1.3-GHz BLR EAR MRR
Radar system Pulse Pulse FMCW
Operating frequency 1.3 GHz 47.0 MHz 24.1 GHz
Transmit power 1.1 kW 100 kW 50 mW
Antenna 5.9 m2 110 m in diameter 60 cm in diameter
Beam width 4.1◦ 3.4◦ 2◦
Range resolution 150 m 150 m 150 m
2. DATA AND METHODOLOGY
2.1. Micro Rain Radar System Description
The Micro Rain Radar (MRR) is FMCW Doppler radar so it has a range resolution competitive to pulse radars when the same signal bandwidth is used. Unlike the pulse radar that detects the time delay of the returned pulse, the range measurement of most FMCW radars is based upon the difference in instantaneous frequency between received and transmitted signals [32]. The MRR records spectra at 32 range gates that leads to an observable height range between 0.15 and 4.65 km when a resolution of 150
m is used. If smaller resolution (e.g.,<100 m) is used, the first and the second range gates are normally
omitted from processing, because they may be affected by near-field concept [6, 28]. Furthermore, the last range gate is usually excluded from analysis, since it is too noisy. In this work, a 150 m resolution was employed and the first range gate (0.15 km) was included in the analysis as in a previous study [29]. The MRR measures the fall velocities of the precipitation particles and deduces DSD, rainfall rate, and other parameters from their fall velocity spectra [23, 24]. The DSD of MRR is related to the Doppler spectra as,
N(D, h) = η(D, h)
σ(D) (1)
where η(D, h) is the spectral volume scattering cross section at height h, and σ(D) is Mie scattering
cross section of single particle with the diameter of D. The η(D, h) value can be obtained from the
Doppler velocity as
η(D, h) =η(v, h)∂D(v, h)
∂v (2)
whereD(v, h) is diameter of falling drops at heighth and derived from [33]
v(D) =
9.65−10.3e(−0.6D)
δ(h), (3)
whereδ(h) is air density correction, and the MRR applies the correction proposed by [34].
Radar reflectivity factorZ (mm6 m−3) is commonly expressed by Rayleigh approximation as
Z =
∞
0
D6N(D)dD. (4)
In case of MRR, the equivalent radar reflectivity factor (Ze) is used instead of Z and given by
Ze= λ 4
π5 1 |K|2
∞
0
η(f)df. (5)
The liquid water content (LW C) is proportional to the 3rd moment of the DSD as
LW C= π·10 −3
6
∞
0
D3N(D)dD. (6)
In similar fashion, rainfall rateR (mm/h) is expressed in terms of the DSD as
R= 6π·10−4
∞
0
D3v(D)N(D)dD, (7)
wherev(D) is the raindrop fall speed. The mean falling velocity of MRR is calculated directly from the
first moment of the Doppler spectra [23, 24].
2.2. Parsivel and Rain Gauge System Description
The Parsivel is a ground-based optical disdrometer which can measure the fall speed and size of precipitation particles up to about 26 mm at 32 bin sizes. The bin size is not uniform and ranges from 0.125 to 3 mm (increase as raindrop sizes increase). The first and the second bins are normally omitted from processing due to low signal to noise ratio [35, 19]. Therefore, the range of particle sizes that can be analyzed spans from 0.3 to 26 mm in diameter. In this study, we used one-minute interval
of DSD during 2014 with the raindrop diameter ranging from 0.3 mm to 10 mm andR >0.1 mm/h.
Another instrument which is used to evaluate the performance of MRR is an Optical Rain Gauge (ORG). It has been installed at KT since 2002 [36]. The ORG data are used to evaluate daily rainfall and rainfall rate obtained by the MRR.
(a)
(b)
(c)
(d)
(e)
(f)
(g)
(h)
2.3. 1.3 GHz Boundary Layer Radar
The Boundary Layer Radar (BLR) was installed about 300 m away from the MRR and had been operated since 1997. The data used in the present study span from 2004 to 2009 with range and time resolutions of 150 m and 2 minute, respectively and the vertical domain extended from 0.3 to 4.65 km above ground level (AGL). To avoid ground clutter contamination, we only analyzed data from 0.75 km height measurement. The BLR was taken as a reference to evaluate the vertical profile of reflectivity and mean Doppler velocity of the MRR. Using an L-band frequency, hence the BLR is almost unaffected by attenuation and able to provide reflectivity factor measurements in the Rayleigh scattering
regime. The radar echoes were assumed as precipitation only if surface rain rate was larger than
0.1 mm/h. Furthermore, to ensure that both instruments are simultaneously observing rain, only the
10-2 10-1 100 101 102 103 104 105 N(D) 10-2 10-1 100 101 102 103 104 105 N(D) 10-2 10-1 100 101 102 103 104 105 N(D)
0 1 2 3 4 5 6
10-2 10-1 100 101 102 103 104 105 N(D)
Raindrop diameter (mm)
10-2 10-1 100 101 102 103 104 105 10-2 10-1 100 101 102 103 104 105 10-2 10-1 100 101 102 103 104 105
0 1 2 3 4 5 6
10-2 10-1 100 101 102 103 104 105
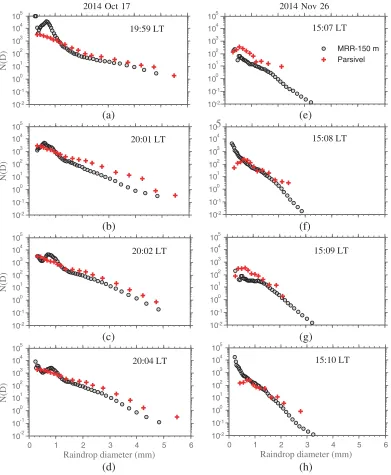
Raindrop diameter (mm) MRR-150 m Parsivel 2014 Nov 26
2014 Oct 17
19:59 LT 20:01 LT 20:02 LT 20:04 LT 15:07 LT 15:08 LT 15:09 LT 15:10 LT (a) (b) (c) (d) (e) (f) (g) (h)
echoes having the radar reflectivity and Doppler velocities greater than 18 dBz and 3 m/s, respectively, were analyzed [21, 15, 9].
3. RESULTS
3.1. Comparison of MRR with Parsivel and Rain Gauge
Figure 1(a) shows the vertical profile of equivalent radar reflectivity for rain event on 17 October and 26 November 2014. The rain event on 26 November 2014 is a typical stratiform rain indicated by a bright band signature while the rain event on 17 October is a typical convective rain. The equation of raindrop falling velocity (Eq. (3)) is only valid forv <9.36 m/s corresponding to diameter<5.8 mm and is applied only to the range limits of 0.246 and 5.8 mm for the MRR. As a consequence, the estimated DSDs are truncated, particularly at heavy rain (Fig. 1(b)). A striking contrast between the DSD
estimated by the MRR and the Parsivel is that the concentration of small-sized drops (<1 mm) from
the MRR is much larger than that estimated by the Parsivel. On the other hand, the concentration of
large-sized drops (>1 mm) from the MRR is much smaller than that estimated by the Parsivel. To see
the performance of MRR on retrieving the DSD in more detail, in Fig. 2, we plot the DSDs of MRR and Parsivel for several minutes during 17 October and 26 November 2014. In general, the DSD of MRR has a similar trend with that of Parsivel, and some agreements can be observed. The deficit of large size drop in the DSD spectra of MRR results in the underestimation of rainfall rate (Figs. 1(d) and (h)).
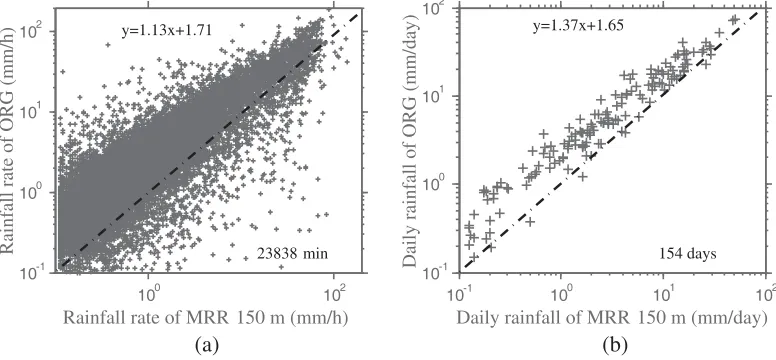
Medium and large-size drops are the main contributors to the rainfall rate (Eq. (7)). A comparison of rainfall rate and daily rainfall for each rain event during 2014 was made between the MRR and the ORG. Fig. 3 shows a scatter diagram of the MRR-retrieved rainfall rate and daily rainfall at 0.15 km (the lowest range gates of MRR) and corresponding rain gauge values. Also shown in the figure is the one-to-one line where all the points would line up if the ORG and MRR measurements agreed perfectly. It can be seen that the MRR generally underestimates rainfall rate dan daily rainfall in comparison with the ORG in most events and overestimates in others. The linear regression results show that the slope of the bestfit line is somewhat larger than unity (1.13 for rainfall rate and 1.37 for daily rainfall). The underestimation of rain rate in the MRR may be due to the considerable rain attenuation at high rain rates. The truncation of large sized drops may also result in the underestimation of rainfall.
10-1 100 101 102
10-1 100 101 102
Daily rainfall of ORG (mm/day)
Daily rainfall of MRR 150 m (mm/day)
100 102
10-1 100 101 102
Rainfall rate of ORG (mm/h)
Rainfall rate of MRR 150 m (mm/h)
(b)
y=1.13x+1.71
154 days y=1.37x+1.65
(a)
23838 min
3.2. Comparison of MRR with BLR
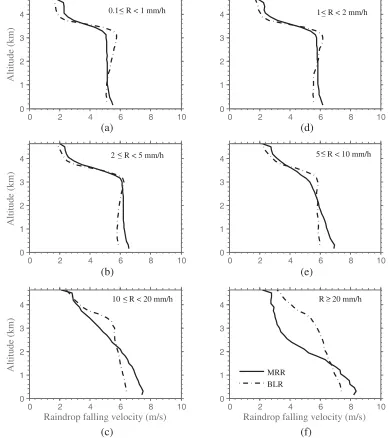
In contrast to other integral rain parameters (IRPs), the mean Doppler velocity which indicates the falling velocity, is not susceptible to attenuation or radar calibration. Therefore, to further evaluate the performance of the MRR, the mean fall velocity profiles were compared with those obtained by the BLR. The two instruments provide the same melting layer height (Figs. 4 (a)–(c)). While the average fractional error (AFE) of Doppler velocity between the MRR and the BLR is relatively small (10%) except extreme rain (31%), there are a significant differences in the vertical distribution. The fall velocity profile shows a steep downward increasing (DI) above melting layer height in light rain (Figs. 4(a)–(c)) indicating the presence of slow moving ice crystals. The vertical profile of velocity gradient (VPVG) for the MRR and the BLR are summarized in Table 2. The gradients of MRR are slightly different from those of BLR.
0 2 4 6 8 10
0 1 2 3 4
Altitude (km)
0 2 4 6 8 10
0 1 2 3 4
0 2 4 6 8 10
0 1 2 3 4
Altitude (km)
0 2 4 6 8 10
0 1 2 3 4
0 2 4 6 8 10
0 1 2 3 4
Altitude (km)
Raindrop falling velocity (m/s)
0 2 4 6 8 10
0 1 2 3 4
Raindrop falling velocity (m/s)
MRR BLR 10 R < 20 mm/h
5 R < 10 mm/h 2 R < 5 mm/h
0.1 R < 1 mm/h 1 R < 2 mm/h
R 20 mm/h _
< _<
_
< <_
_
< _<
(a) (d)
(c)
(b) (e)
(f)
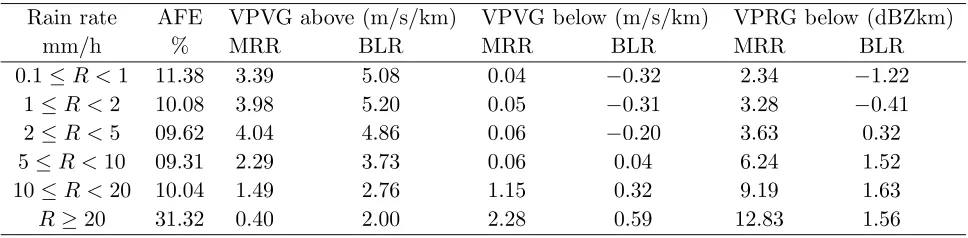
Table 2. Average fractional error (AFE) of Doppler velocity, vertical profile of velocity gradient above (VPVG above) and below (VPVG below) the melting layer for the MRR and the BLR as well as vertical profile of radar reflectivity gradient below the melting layer (VPRG below), for several rain classes.
Rain rate AFE VPVG above (m/s/km) VPVG below (m/s/km) VPRG below (dBZkm)
mm/h % MRR BLR MRR BLR MRR BLR
0.1≤R <1 11.38 3.39 5.08 0.04 −0.32 2.34 −1.22 1≤R <2 10.08 3.98 5.20 0.05 −0.31 3.28 −0.41
2≤R <5 09.62 4.04 4.86 0.06 −0.20 3.63 0.32
5≤R <10 09.31 2.29 3.73 0.06 0.04 6.24 1.52
10≤R <20 10.04 1.49 2.76 1.15 0.32 9.19 1.63
R≥20 31.32 0.40 2.00 2.28 0.59 12.83 1.56
The mean fall velocities for rain region (below the melting layer) where the IRPs are retrieved, indicates a DI pattern. While the two instruments show almost uniform fall velocities of the hydrometeor up to melting layer height for light rain (Figs. 4(a)–(c)), small DI is observed for the MRR whereas small DD is observed for the BLR (Table 2). Linear decrease in mean fall velocity with decreasing height from the BLR, is nearly coincident with the increase in the atmospheric density [39] and indicates that the particles are not undergoing size changes during their fall. On the other hand, the MRR suggests that the particles are undergoing slightly size changes over the 2.3 km height range, indicated by DI of mean falling velocity. The heavy rain or convective cases (Figs. 4(e)–(f)) have the highest DI of fall velocities, which are also supported by the observations from other regions [40, 23, 24]. Such DI values were also observed for the BLR but the gradient is smaller than the MRR. Large VPVG particularly for the heavy rain could be due to the effect of vertical wind and turbulence on the MRR standard processing method [26].
The DSDs of MRR are estimated from the Doppler spectra which reflects the fall velocity distribution of hydrometeors. While there was not a perfect agreement in derived rain parameters between the MRR and the ORG, the MRR and the BLR show almost the same fall velocities of the hydrometeor up to melting layer height for light rain. Thus, the DSD for light rain may be accurate enough. This can be also observed from the instantaneous DSD (Fig. 5).
3.3. Vertical DSD Profile and Z-R Relationships from MRR
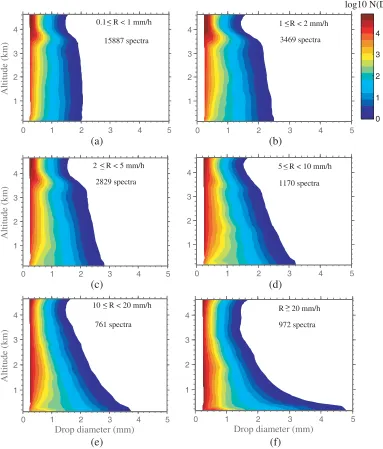
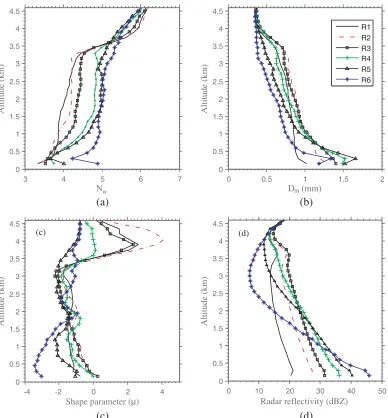
Figure 5 shows the mean vertical DSD profile of several rain classes during 2014. The DSD was
parameterized by the normalized gamma distribution [9] and the profile of parameters was given in Fig. 6. The profiles are valid only below the melting layer height (in the rain region) and our discussion is limited to that region only.
Significant changes of DSD are observed with increasing rainfall rate. The lowest rain class
(Fig. 5(a)) shows a slightly decrease in smaller drops (< 1 mm) and slightly increase in larger drops
(> 1 mm) with decreasing height in rain column. Thus, the particles are undergoing slightly size
changes over the 3.0 km height range, as also observed from the Doppler velocity plot (Fig. 4(a)) and
mass-weighted mean diameter (Dm) (Fig. 6(b)). This indicates the occurrence of drop coalescence
mechanism in the tropical precipitation even for very light rain. Beside the coalescence, the evaporation of smaller drops could be also the possible reason for such pattern. The total raindrop concentration
(Nw) shows a slight decrease with height (Fig. 6(a)), consistent with a significant decrease of small
sized drop concentration. On the other hand, the shape parameter (μ) shows a slight increase with
height (Fig. 6(c)). The value of about −1 indicates that the DSD of very light rain from the MRR
are somewhat broader and larger concentration of small size drops than expected from an exponential distribution (μ= 0).
Altitude (km)
0 1 2 3 4 5
1 2 3 4
0 1 2 3 4 5
1 2 3 4
log10 N(D)
0 1 2 3 4
Altitude (km)
0 1 2 3 4 5
1 2 3 4
0 1 2 3 4 5
1 2 3 4
Drop diameter (mm)
Altitude (km)
0 1 2 3 4 5
1 2 3 4
Drop diameter (mm)
0 1 2 3 4 5
1 2 3 4
0.1 R < 1 mm/h 1 R < 2 mm/h
2 R < 5 mm/h 5 R < 10 mm/h
10 R < 20 mm/h R 20 mm/h 15887 spectra 3469 spectra
2829 spectra 1170 spectra
761 spectra 972 spectra
_ <
_ <
_ <
_ < _ <
<
_
(a) (b)
(c) (d)
(e) (f)
Figure 5. Average vertical DSD profiles for several rain classes from the MRR during 2014.
gradient (VPRG) for these mean values in the range of 0.75–3.0 km was summarized in Table 2. The gradient was calculated by using linear least square fitting of dBZ as function of height. The VPRG for all rain classes show DI and the magnitude of slopes increases with increasing rain rates, consistent with the DSD characteristics (Fig. 5). Large VPRG of MRR was also observed from the observation in India [29]. Such steep VPRGs particularly for heavy rain can be due to significant growth of raindrop at Kototabang. However, such strong VPRGs were not obtained by the BLR though the VPRG of BLR is consistent with several previous studies [40, 39]. Moreover, the BLR operates in L-band frequency, hence it is almost unaffected by attenuation. Thus, another possible reason for such steep gradient is due to inadequate retrieval of radar reflectivity in the MRR at heavy rain due to significant rain attenuation in addition to the influence of vertical wind on the DSD estimates.
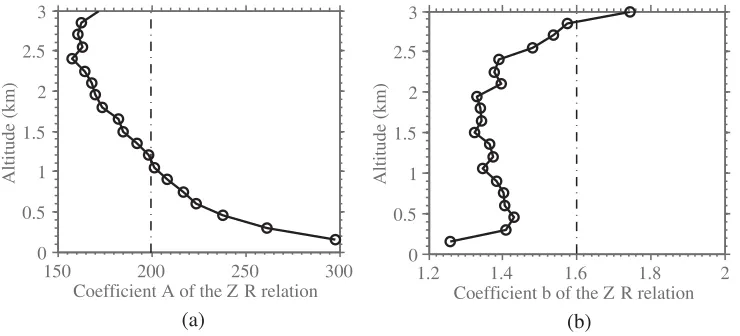
In order to explore more fully the differences in Z-R parameterizations by altitude, Z-R
relationships (Z = ARb) were determined for each altitude in the 0.15–3.0 km height. The relation
3 4 5 6 7 0
0.5 1 1.5 2 2.5 3 3.5 4 4.5
Altitude (km)
Nw
0 0.5 1 1.5 2
0 0.5 1 1.5 2 2.5 3 3.5 4 4.5
Altitude (km)
Dm (mm)
-4 -2 0 2 4
0 0.5 1 1.5 2 2.5 3 3.5 4 4.5
Altitude (km)
Shape parameter (µ)
0 10 20 30 40 50
0 0.5 1 1.5 2 2.5 3 3.5 4 4.5
Altitude (km)
Radar reflectivity (dBZ)
R1 R2 R3 R4 R5 R6
(c) (d)
(a) (b)
(c) (d)
Figure 6. Vertical distribution of normalized gamma distribution parameters of average vertical DSD devoted in Fig. 5, i.e., (a) Nw, (b) Dm, (c) μand (d) radar reflectivity.
spurious variability on DSD, a group of ten DSDs samples of sequential R was averaged [37]. Plots of
the vertical structure of the coefficient A and exponent bparameters along with the value of Marshall
and Palmer model (Z = 200R1.60) are shown in Fig. 7. The profiles of coefficient A and exponent b
at Kototabang show variability in vertical structure, as a result of the variability in the DSD. There
is a small reversal of the trend for A to decrease downward slightly in the layer of 3.0–2.4 km. In
this same layer, exponent b also decreases significantly. The combined effect (decrease in A and b) is
expected from breakup and evaporation process [38]. In the layer of 2.4–0.15 km, the value ofAincreases
significantly with decreasing height. The exponent b also increases slightly until 0.45 km and tend to
decrease downward in the layer of 0.45–0.15 km. The increase in A and b) with decreasing height is
expected from coalescence and evaporation process [38]. The Z profile in Fig. 6(d) indicates that Z
is not constant with height, for all rain classes. Same pattern is also observed for R and liquid water
content (figure not shown). These suggest that the evaporation at Kototabang is not balanced by the coalescence; the coalescence is more dominant than the evaporation process.
While the aforementioned comparison indicated that the DSD and rain parameters were not in a
150 200 250 300 0
0.5 1 1.5 2 2.5 3
Altitude (km)
Coefficient A of the Z R relation 1.2 1.4 1.6 1.8 2 0
0.5 1 1.5 2 2.5 3
Coefficient b of the Z R relation
Altitude (km)
(a) (b)
Figure 7. Vertical distribution of coefficient (a) Aand (b) bofZ-R relationship. Dashed line denotes
the coefficient of Marshall and Palmer model (Z = 200R1.6).
parameters calculated in this study is the same as that found by the previous study using the MRR in
Virginia [6]. TheZ-Rrelations derived based on the linear least squares fit method from such study are
Z = 323R1.49 for 0.15 km, Z = 294R1.57 for 0.3 km and Z = 282R1.62 for 0.45 km. The Z-R relations from the current work for same height are Z= 298R1.26,Z = 261R1.41 and Z = 238R1.43, respectively.
Despite the limitation of our instrument, the increase inA and the decrease inbwith decreasing height
found in this study is consistent with the result found in Virginia. Furthermore, the values ofA at the
lowest height (0.15 km) are in good agreement with the corresponding ground-based ParsivelAvalues of
300 and b value of 1.40 derived using 1-min-averaged data [19]. The agreement between the MRR and
Parsivel measurements is encouraging, especially when considering the difference in height (0.15 km).
Note, however, that the exponent b values are somewhat higher in the disdrometer study (1.40 versus
1.26 in this study). Thus, some correction are needed, nevertheless, the MRR installed at Kototabang can be still utilized particularly for light rain.
4. CONCLUSIONS AND FUTURE WORKS
The result shows that the MRR installed at Kototabang still has shortcomings, particularly for heavy rain observation. While the melting layer height of the MRR and the BLR was the same, mean Doppler velocities of MRR increased with decreasing hight through all rainfall intensities. On the other hand,
for the BLR, the downward increasing was only observed at heavy rain (>10 mm/h), while downward
decreasing was observed at light rain (< 5 mm/h). The MRR standard processing method converts
the Doppler spectra which reflects the fall velocity distribution of hydrometeors into the DSD under the assumption of no vertical wind. This assumption is only valid for light rain. Tropical precipitation particularly during convection is associated with turbulence so the mean Doppler velocity is composed of not only the hydrometeor fall speed but also the air velocity. Therefore, the retrieved DSD can be biased during heavy rain. There were noticeable differences between the MRR and Parsivel in the small and large size ends of the drop size spectrum. The underestimation of large sized drops in the MRR may be responsible for the underestimation of surface rainfall rate and daily rainfall. The second measurement shortcoming could be attenuation correction which can be inferred from the comparison of radar reflectivity between the MRR and the BLR. The vertical profile of reflectivity gradient of MRR was much larger than the one estimated from the BLR which is almost unaffected by attenuation. Thus, some correction are still needed for heavy rain, nevertheless, the MRR installed at Kototabang can be utilized for light rain. Comparisons indicated that mean Doppler velocity and the DSD for the light rain
as well asZ-R relation were in reasonable agreement with the reference of BLR, Parsivel and previous
ACKNOWLEDGMENT
Micro Rain Radar, Optical Rain Gauge (ORG), Parsivel and other EAR facilities at Kototabang were supported by Grant-Aid for Scientific Research on Priority Areas funded by the Ministry of Education, Culture, Sports, Science, and Technology (MEXT) of Japan.
REFERENCES
1. Marzuki, T. Kozu, T. Shimomai, W. L. Randeu, H. Hashiguchi, and Y. Shibagaki, “Diurnal variation of rain attenuation obtained from measurement of raindrop size distribution in equatorial
Indonesia,”IEEE Trans. Antennas Propag., Vol. 57, No. 4, 1191–1196, 2009.
2. Abdulrahman, A, Y., T. A. Rahman, S. K. B. A. Rahim, and M. Rafi Ul Islam, “A new rain
attenuation conversion technique for tropical regions,” Progress In Electromagnetics Research B,
Vol. 26, 53–67, 2010.
3. Das, S., A. Maitra, and A. K. Shukla, “Rain attenuation modeling in the 10–100 GHz
frequency using drop size distributions for different climatic zones in tropical India,” Progress
In Electromagnetics Research B, Vol. 25, 211–224, 2010, doi:10.2528/PIERB10072707.
4. Afullo, T. J. O., “Raindrop size distribution modeling for radio ink design along the eastern coast
of South Africa,” Progress In Electromagnetic Research B, Vol. 34, 345–366, 2011.
5. Owolawi, P. A., “Raindrop size distribution model for the prediction of rain attenuation in Durban,”
PIERS Online, Vol. 7, No. 6, 516–523, 2011.
6. Tokay, A., P. Hartmann, A. Battaglia, K. S. Gage, W. L. Clark, and C. R. Williams, “A field study
of reflectivity and Z-R relations using vertically pointing radars and disdrometers,” J. Atmos.
Oceanic Technol., Vol. 26, No. 6, 1120–1134, 2009, doi:10.1175/2008JTECHA1163.1.
7. Kumar, L. S., Y. H. Lee, J. X. Yeo, and J. T. Ong, “Tropical rain classification and estimation
of rain from Z-R (reflectivity-rain rate) relationships,” Progress In Electromagnetics Research B,
Vol. 32, 107–127, 2011, doi:10.2528/PIERB11040402.
8. Tokay, A. and D. A. Short, “Evidence from tropical raindrop spectra of the origin of rain from
stratiform versus convective clouds,” J. Appl. Meteorol., Vol. 35, No. 3, 355–371, 1996.
9. Marzuki, H. Hashiguchi, T. Kozu, T. Shimomai, Y. Shibagaki, and Y. Takahashi, “Precipitation
microstructure in different Madden-Julian Oscillation phases over Sumatra,”Atmos. Res., Vol. 168,
121–138, 2016.
10. Caracciolo, C., M. Napoli, F. Porc, F. Prodi, S. Dietrich, C. Zanchi, and S. Orlandini, “Raindrop
size distribution and soil rosion,”J. Irrig. Drain. Eng., 461–469, 2012,
doi:10.1061/(ASCE)IR.1943-4774.0000412.
11. Ilyas, M. A. and J. Swingler, “Piezoelectric energy harvesting from raindrop impacts,” Energy,
Vol. 90, 796–806, 2015.
12. Stout, G. E. and E. A. Mueller, “Survey of relationships between rainfall rate and radar reflectivity
in the measurement of precipitation,” J. Appl. Meteorol., Vol. 7, No. 3, 465–474, 1968.
13. Kozu, T., T. Shimomai, Z. Akramin, Marzuki, Y. Shibagaki, and H. Hashiguchi, “Intraseasonal
variation of raindrop size distribution at Koto Tabang, West Sumatra, Indonesia,” Geophys. Res.
Lett., Vol. 32, L07803, 2005, doi:10.1029/2004GL022340.
14. Kozu, T., K. K. Reddy, S. Mori, M. Thurai, J. T. Ong, D. N. Rao, and T. Shimomai, “Seasonal and
diurnal variations of raindrop size distribution in Asian monsoon region,” J. Meteor. Soc. Japan.
Ser. II, Vol. 84A, 195–209, 2006.
15. Marzuki, T. Kozu, T. Shimomai, W. L. Randeu, H. Hashiguchi, and M. Vonnisa, “Raindrop size
distributions of convective rain over equatorial Indonesia during the first CPEA campaign,”Atmos.
Res., Vol. 96, 645–655, 2010.
16. Marzuki, W. L. Randeu, M. Sch¨onhuber, V. N. Bringi, T. Kozu, and T. Shimomai, “Raindrop size
distribution parameters of distrometer data with different bin sizes,”IEEE Trans. Geosci. Remote
17. Marzuki, W. L. Randeu, T. Kozu, T. Shimomai, M. Sch¨onhuber, and H. Hashiguchi, “Estimation of raindrop size distribution parameters by maximum likelihood and L-moment methods: Effect of
discretization,” Atmos. Res., Vol. 112, 1–11, 2012.
18. Marzuki, W. L. Randeu, T. Kozu, T. Shimomai, H. Hashiguchi, and M. Sch¨onhuber, “Raindrop axis
ratios, fall velocities and size distribution over Sumatra from 2D-Video Disdrometer measurement,
in: Michaelides, S. (Eds.) Advances in Precipitation Science,”Atmos. Res., Vol. 119, 23–37, 2013.
19. Marzuki, H. Hashiguchi, M. K. Yamamoto, S. Mori, and M. D. Yamanaka, “Regional
variability of raindrop size distribution over Indonesia,” Ann. Geophys., Vol. 31, 1941–1948, 2013,
doi:10.5194/angeo-31-1941-2013.
20. Rajopadhyaya, D. K., P. T. May, and R. A. Vincent, “A general approach to the retrieval of rain
dropsize distributions from wind profiler Doppler spectra: Modeling results,” J. Atmos. Oceanic
Technol., Vol. 10, 710–717, 1993.
21. Renggono, F., H. Hashiguchi, S. Fukao, M. D. Yamanaka, S.-Y. Ogino, N. Okamoto, F. Murata, B. P. Sitorus, M. Kudsy, M. Kartasasmita, and G. Ibrahim, “Precipitating clouds observed by
1.3-GHz boundary layer radars in equatorial Indonesia,” Ann. Geophys., Vol. 19, 889–897, 2001,
doi:10.5194/angeo-19-889-2001.
22. Vonnisa, M., T. Kozu, and T. Shimomai, “Development of dual-frequency method to observe the
vertical structure of raindrop size distribution at Kototabang,” J. Ilmu Fisika (in Indonesian),
Vol. 6, No. 2, 52–58, 2014.
23. Peters, G., B. Fischer, and T. Andersson, “Rain observations with a vertically looking Micro Rain
Radar (MRR),” Boreal Environ. Res., Vol. 7, 353–362, 2002.
24. Peters, G., B. Fischer, H. Mnster, M. Clemens, and A. Wagner, “Profiles of raindrop size
distributions as retrieved by micro rain radars,” J. Appl. Meteorol., Vol. 44, 1930–1949, 2005.
25. Cha, J.-W., S. Y. Seong, K.-H. Chang, and N. O. Sung, “Estimation of the melting layer from a Micro Rain Radar (MRR) data at the Cloud Physics Observation System (CPOS) site at
Daegwallyeong Weather Station,” Asia-Pacific. J. Atmos. Sci., Vol. 43, No. 1, 77–85, 2007.
26. Tridon, F., J. V. Baelen, and Y. Pointin, “Aliasing in Micro Rain Radar data due to strong vertical
winds,”Geophys. Res. Lett., Vol. 38, L02804, 2011, doi:201110.1029/2010GL046018.
27. Kneifel, S., M. Maahn, G. Peters, and C. Simmer, “Observation of snowfall with a low-power
FM-CW K-band radar (Micro Rain Radar),” Meteorol. Atmos. Phys., Vol. 113, 75–87, 2011,
doi:10.1007/s00703-011-0142-z.
28. Maahn, M. and P. Kollias, “Improved micro rain radar snow measurements using Doppler spectra
post-processing,” Atmos. Meas. Tech., Vol. 5, 2661–2673, 2012.
29. Das, S. and A. Maitra, “Vertical profile of rain: Ka band radar observations at tropical locations,”
J. Hydrol., Vol. 534, 31–41, 2016.
30. Peters, G., B. Fischer, and M. Clemens, “Rain attenuation of radar echoes considering finite-range
resolution and using drop size distributions,”J. Atmos. Ocean. Technol., Vol. 27, 829–842, 2010.
31. Adirosi, E., L. Baldini, N. Roberto, P. Gatlin, and A. Tokay, “Improvement of vertical profiles of raindrop size distribution from micro rain radar using 2D video disdrometer measurements,”
Atmos. Res., Vol. 169, Part B, 404–415, 2016.
32. Axelsson, S. R. J., “Area target response of triangularly frequency-modulated continuous-wave
radars,”IEEE Trans. Aerosp. Electron. Syst., Vol. 14, 266–277, 1978.
33. Atlas, D., R. C. Srivastava, and R. S. Sekhon, “Doppler radar characteristics of precipitation at
vertical incidence,” Rev. Geophys. Space Phys., Vol. 11, 1–35, 1973.
34. Foote, G. B. and P. S. Du Toit, “Terminal velocity of raindrops aloft,” J. Appl. Meteorol., Vol. 8,
No. 249, 253, 1969.
35. Battaglia, A., E. Rustemeier, A. Tokay, U. Blahak, and C. Simmer, “PARSIVEL snow observations:
A critical assessment,” J. Atmos. Oceanic Technol., Vol. 27, 333–344, 2010.
36. Marzuki, H. Hashiguchi, T. Shimomai, and W. L. Randeu, “Cumulative distributions of rainfall
37. Lee, G. and I. Zawadzki, “Variability of drop size distributions: Noise and noise filtering in
disdrometric data,” J. Appl. Meteorol., Vol. 44, 634–652, 2005.
38. Rosenfeld, D. and C. W. Ulbrich, “Cloud microphysical properties, processes, and rainfall estimation opportunities. Radar and Atmospheric Science: A collection of Essays in Honor of
David Atlas,”Meteorol. Monogr., Vol. 52, 237–258, 2003.
39. Cifelli, R., C. R. Williams, D. K. Rajopadhyaya, S. K. Avery, K. S. Gage, and P. T. May, “Drop-size
distribution characteristics in tropical mesoscale convective systems,” J. Appl. Meteorol., Vol. 39,
760–77, 2000.
40. Thurai, M., T. Iguchi, T. Kozu, J. D. Eastment, C. L. Wilson, and J. T. Ong, “Radar observation
in Singapore and their implications for the TRMM precipitation radar retrievel algorithms,”Radio