Artificial Neural Network Model for Soil Moisture Estimation
at Microwave Frequency
Raman Rajesh Mohan1, *, Shanta Mridula1, and Pezholil Mohanan2
Abstract—This paper reports a neural-network-based methodology to estimate the amount of moisture content in soil at L, S and C frequency bands. A multilayered artificial neural network, using the Levenberg-Marquardt algorithm, is used as the ANN model. The input training data comprise the measured values of dielectric constant of soil in the dry and moist states. Dielectric constant is measured using microwave free-space transmission technique. Measurement has been performed using Vector Network Analyzer (VNA), microstrip patch antenna and soil sample holder. One great advantage with this method is that there is no need to test the pH value of the soil sample, and hence all the associated pre-processing steps, such as drying, pulverizing, can be avoided.
1. INTRODUCTION
Soil is an unconsolidated material on the immediate surface of the earth, which serves as a natural medium for the growth of land plants. It has been subjected to and influenced by genetic and environmental factors of parent material, climate (including moisture and temperature effects), macro and micro organisms and topography, all acting over a period of time and producing a product that differs from the material from which it has derived all the properties and characteristics [1].
Soil system is fundamental to the growth of living things, and water is one of the most important components of plant growth. Moisture in soil serves as a solvent and carrier of food nutrients for plant growth and helps in the chemical and biological activities of soil. In short, the yield of crop is more often determined by the amount of water available rather than the deficiency of other food nutrients. Soil moisture depends very much on the nature of the soil itself. In general, clay, silty and sandy soils all have different capacities to retain soil moisture. Clays have the highest moisture retention capacity, while sandy soils have the least. The presence of adequate organic matter greatly improves the soil’s moisture retention capacity. Particularly in semi-arid areas, the use of compost or organic manure makes all the difference and can effectively reduce the need for irrigation. Surface soil moisture is the water in the upper 10 cm of soil. After sea-surface temperature, soil moisture is the second most important forcing function [2]. Therefore the systematic study about the estimation of soil moisture content has evolved as a major need of the hour.
From a farmer’s perspective, the pH of soil is the most important quantifiable parameter. pH refers to how acidic or alkaline the soil is. A simple numerical scale is used to express pH. The scale goes from 0 to 14, with 0 being most acidic, and 14 being most alkaline. The value 7 is neutral — i.e., neither acidic nor alkaline. Soil pH is important because it influences several soil factors affecting plant growth, such as soil bacteria, nutrient leaching, nutrient availability, toxic elements and soil structure.
A soil test for pH determination informs the farmer whether his soil will produce good plant growth or whether he needs to treat his soil to adjust the pH level. For most plants, the optimum pH range
Received 5 July 2015, Accepted 15 September 2015, Scheduled 16 September 2015
* Corresponding author: Raman Menon Rajesh Mohan ([email protected]).
1 Division of Electronics Engineering, School of Engineering, CUSAT, Kochi 682022, India. 2 Department of Electronics, CUSAT,
How much is the soil’s pH value and what is required to be added to improve his soil’s fertility based on the pH are the only relevant suggestions given by the Soil Testing Laboratory to a farmer. This paper is an attempt to assist the farmers even better by predicting the soil moisture content, using electromagnetic principles, so that crop growth and productivity can be further improved.
Dielectric materials, including soil, behave differently in the presence of an electromagnetic field. When microwaves are directed towards a material, energy gets reflected or transmitted through the surface or absorbed by it. The proportions of above energy vary with the material properties. Permittivity ε and permeability μ are the key parameters describing the interaction of materials with electromagnetic fields [3].
Dielectric profiles of materials are investigated in different parts of the frequency spectrum. Since recent research applications are concentrated at microwave frequencies, the work focuses in this range. At microwave frequencies, various non-resonant and resonant techniques are available for the measurement of dielectric constant of materials, which include transmission line, free-space, coaxial probe and cavity techniques [4, 5].
The effect of moisture content on soil has been extensively studied. Experimental results carried out on 62 different samples (31 samples acidic and 31 alkaline, with varying Total Soluble Salt (TSS) and organic contents) of 20 ml each of soil under two different cases — (i) all dry samples and (ii) all samples individually mixed with 5 ml, 6 ml and 8 ml of water to study the effect of extra-added moisture in soil [6]. This paper reports the method to estimate the moisture content present in a sample of soil, using a trained ANN model and microwave free-space transmission technique.
Soil moisture estimation techniques are discussed in Section 2; the experimental setup and methodology are explained in Section 3 and the neural-network model is described in Section 4. Results are discussed in Section 5, followed by conclusion in Section 6.
2. TECHNIQUES FOR SOIL MOISTURE ESTIMATION
Methods available for the estimation of soil moisture content have been classified into two categories : (a) In-situ methods and (b) Remote Sensing. The in-situ methods are the Gravimetric Method, Nuclear Techniques, Electromagnetic Techniques, Tensiometric Techniques and Hygrometric Techniques. Remote sensing method uses visible & near infra-red, thermal infra-red and microwave techniques (both passive and active systems). Among these the microwave technique — either the in-situ or remote sensing — is the most popular [7]. The technique is based on the fact that the electromagnetic (EM) properties of soil vary with moisture content. The EM properties of soils have been of interest to various research areas for many years. These properties are not only frequency dependent but also dependent on density and water content. Two types of equations have been proposed to estimate the amount of moisture content in soil. The first category is empirical in nature. The second category is classified as volumetric mixing models, which are derived from discrete capacitor network theory [8]. The Topp’s Equation connecting dielectric constant of soil with Volumetric Water Content (VWC) is given as [9].
θv = 4.3×10⁻⁶×εr3−5.5×10⁻⁴×εr2+ 2.92×10⁻²×εr−5.3×10⁻² (1) whereθv, the VWC, is defined as θv = Water Volume (m3)/Total Volume (m3) and εr is the dielectric constant.
3. THE EXPERIMENTAL SETUP AND METHODOLOGY
The experimental setup used for the present study is shown in Figure 1.
Figure 1. Setup of free-space transmission method.
W
L
p s
p
W
Ls
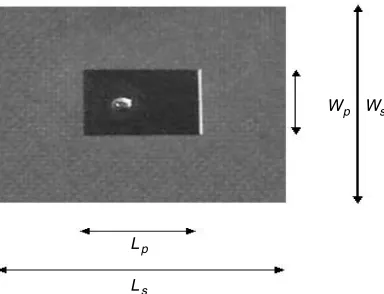
Figure 2. Probe-fed MPA.
L, S and C bands. Rohde & Schwarz ZVB8 Vector Network Analyzer (VNA) is used for measurement. The antennas are connected to the VNA. The VNA is calibrated in transmission mode (response-type calibration) with a bandwidth of 300 MHz, centred on the respective resonant frequency, with the empty sample holder between the two antennas. The sample holder is a rectangular box made of acrylic (εr = 4.2 at 2.45 GHz) having dimensions 10 cm×10 cm×0.3 cm. After calibrating the VNA, each soil sample is inserted into the sample holder. Measurements of magnitude and phase of transmission coefficient (|S21| and Φ, give the attenuation A and phase shift Φ according to Equations (2) and (3),
wheren is an integer [10].
A = 20 log|S21|dB (2)
Φ = Φo−2πnrad (3)
The dielectric constant of each sample is computed using Equation (4).
εr= [(Φc/2πdf) + 1]2 (4)
where c is the velocity of light (m/s), f the frequency (Hz), and d the thickness of the layer of the soil (m). Dielectric constant of some common materials such as free-space, FR4, acrylic and water is measured to validate the proposed method.
Typical antenna geometry is shown in Figure 2; dimensions of the antenna for the three frequencies are given in Table 1.
Table 1. Dimensions of MPA.
Dimensions (in cm) Frequency,fr (GHz) 1.88 2.45 5.44
Patch Lp 4.71 2.8 1.6
Wp 3.73 2.4 1.16
Substrate Ls 8.4 6 3.75
Ws 6.7 5 3.48
20 ml each of 62 samples of soil are tested; of these, 31 samples are acidic in nature (pH below 7.0), while the rest are alkaline (pH above 7.0). All the samples are dry, powdered and fertilizer-extracted to remove all organic matter. The samples are the ‘Udayamperoor’ series from Ernakulam district, South India which are moderately acidic in nature (pH between 4.7 and 6.4) and ‘Anuppur’/‘Agali’ series from Palakkad district, South India which are moderately alkaline (pH between 7.0 and 7.5) [11].
each case is computed using Equation (1). This gives the amount of inherent moisture content present in the soil sample. Then εr and VWC of each wet soil sample corresponding to the amount of water extra-added are calculated.
4. THE NEURAL NETWORK MODEL
Neural networks are composed of simple elements operating in parallel. These elements are inspired by biological nervous systems. One can train a neural network to perform a particular function by adjusting the values of the connections (weights) between elements. Typically, neural networks are adjusted, or trained, so that a particular input leads to a specific target output. Artificial neural networks (ANN) have been applied to a wide range of problems in many disciplines. One of the key application areas of ANN is Remote Sensing, where it has increasingly been used since 1988 for the classification of remotely-sensed images. Multi-layer perceptron trained by back-propagation algorithm is the most common neural network used for image classification. This type of neural network has been successfully applied to image processing. The Levenberg-Marquardt algorithm is well suited for problems with training data of this type [12, 13].
In the proposed model, a single feed-forward ANN model, with 2 hidden layers having 18 and 12 neurons respectively, is used. The input data for training the model consists of the experimentally measured values of εr of each dry soil sample and at all VWCs. The output or ‘target’ consists of
Figure 3. Structure of the feed-forward neural network.
the corresponding VWCs, expressed in percentage. While ‘testing’ or experimentally measuring the VWC of the soil sample at hand, it is enough to input its measured value of εr. The output will then correspond to the four values of VWCs, one at the ‘dry’ state and the others at the three ‘wet’ states. The network is trained using almost all varieties of soil samples available in the locality and typical values of VWC in the upper 10 cm of soil. This guarantees excellent results.
The architecture of a three-layer feed-forward neural network is shown in Figure 3. The training and testing of data are carried out using MATLAB 6.1.
5. RESULTS AND DISCUSSION
The estimation of VWC of an unknown soil sample is done by carrying out the experiment with the sample in the holder, measuring itsεr using Equation (4) and evaluating VWC using the trained ANN model. Values of εr of all soil samples are found for four different cases: (a) all dry samples (20 ml
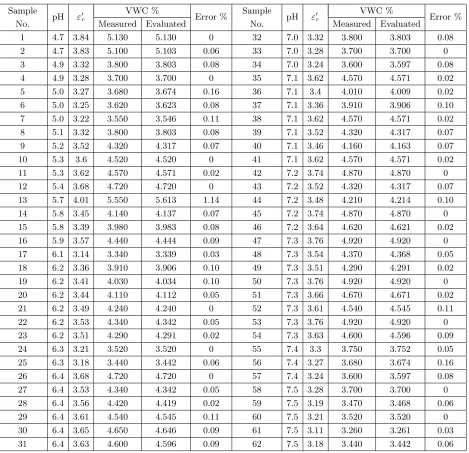
Table 2. Percentage error in the measured and evaluated values of VWC of dry samples.
Sample
No. pH ε
r VWC % Error % Sample
No. pH ε
r VWC % Error %
Measured Evaluated Measured Evaluated
1 4.7 3.84 5.130 5.130 0 32 7.0 3.32 3.800 3.803 0.08
2 4.7 3.83 5.100 5.103 0.06 33 7.0 3.28 3.700 3.700 0
3 4.9 3.32 3.800 3.803 0.08 34 7.0 3.24 3.600 3.597 0.08
4 4.9 3.28 3.700 3.700 0 35 7.1 3.62 4.570 4.571 0.02
5 5.0 3.27 3.680 3.674 0.16 36 7.1 3.4 4.010 4.009 0.02
6 5.0 3.25 3.620 3.623 0.08 37 7.1 3.36 3.910 3.906 0.10
7 5.0 3.22 3.550 3.546 0.11 38 7.1 3.62 4.570 4.571 0.02
8 5.1 3.32 3.800 3.803 0.08 39 7.1 3.52 4.320 4.317 0.07
9 5.2 3.52 4.320 4.317 0.07 40 7.1 3.46 4.160 4.163 0.07
10 5.3 3.6 4.520 4.520 0 41 7.1 3.62 4.570 4.571 0.02
11 5.3 3.62 4.570 4.571 0.02 42 7.2 3.74 4.870 4.870 0
12 5.4 3.68 4.720 4.720 0 43 7.2 3.52 4.320 4.317 0.07
13 5.7 4.01 5.550 5.613 1.14 44 7.2 3.48 4.210 4.214 0.10
14 5.8 3.45 4.140 4.137 0.07 45 7.2 3.74 4.870 4.870 0
15 5.8 3.39 3.980 3.983 0.08 46 7.2 3.64 4.620 4.621 0.02
16 5.9 3.57 4.440 4.444 0.09 47 7.3 3.76 4.920 4.920 0
17 6.1 3.14 3.340 3.339 0.03 48 7.3 3.54 4.370 4.368 0.05
18 6.2 3.36 3.910 3.906 0.10 49 7.3 3.51 4.290 4.291 0.02
19 6.2 3.41 4.030 4.034 0.10 50 7.3 3.76 4.920 4.920 0
20 6.2 3.44 4.110 4.112 0.05 51 7.3 3.66 4.670 4.671 0.02
21 6.2 3.49 4.240 4.240 0 52 7.3 3.61 4.540 4.545 0.11
22 6.2 3.53 4.340 4.342 0.05 53 7.3 3.76 4.920 4.920 0
23 6.2 3.51 4.290 4.291 0.02 54 7.3 3.63 4.600 4.596 0.09
24 6.3 3.21 3.520 3.520 0 55 7.4 3.3 3.750 3.752 0.05
25 6.3 3.18 3.440 3.442 0.06 56 7.4 3.27 3.680 3.674 0.16
26 6.4 3.68 4.720 4.720 0 57 7.4 3.24 3.600 3.597 0.08
27 6.4 3.53 4.340 4.342 0.05 58 7.5 3.28 3.700 3.700 0
28 6.4 3.56 4.420 4.419 0.02 59 7.5 3.19 3.470 3.468 0.06
29 6.4 3.61 4.540 4.545 0.11 60 7.5 3.21 3.520 3.520 0
30 6.4 3.65 4.650 4.646 0.09 61 7.5 3.11 3.260 3.261 0.03
to the experimental setup at 5.44 GHz for all the dry samples is shown in Table 2. It shows the error, expressed as a percentage, between the values of VWC levels measured using Topp’s Equation and evaluated using the ANN model.
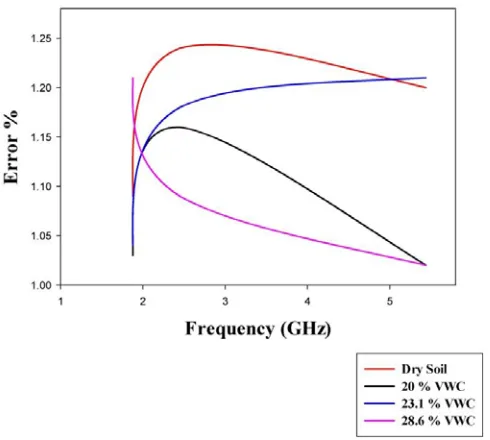
It can be seen that the maximum percentage error is 1.14; for most cases, the error is 0%, signifying the accuracy of the proposed method. Similar results are obtained for the other two frequencies. Also, the method works well if the training is based on any of the three VWC also. The maximum error percentage at the three frequencies for the above-mentioned wet states of soil is shown in Figure 4.
It is evident that the maximum error percentage does not exceed 1.25% for any of the frequency or VWC level used for training An advantage with this method is that there is no need to test the pH value of the soil sample and hence all the associated pre-processing steps such as drying, pulverizing etc. can be avoided to an extent.
6. CONCLUSION
First and foremost, the paper explores the relevance of usage of microwave frequencies for the dielectric-property extraction of soil. It also reports a simple and accurate neural-network-based methodology to estimate the amount of moisture content in soil at L, S and C frequency bands. One major advantage with this method is that there is no need to pre-test the pH value of the soil sample. Hence all the associated pre-processing steps such as drying, pulverizing etc of soil samples. can be avoided, resulting in a huge saving of time. The United Nations has declared 2015 as the International Year of Soils and the official slogan is ‘healthy soils for a healthy life’. This study on the dielectric properties of dry and moist soils is useful not only in assisting the farmers by predicting the soil moisture content so that crop growth and productivity can be further improved, but also in designing microwave sensors for soil-moisture estimation. On a larger note, the structure and chemical composition of soils can also be predicted. The data is helpful in designing sensors for microwave remote sensing and for the retrieval of soil-moisture content from the remotely-sensed satellite data. Hence, research in this area will enrich our knowledge of soil science and will prove beneficial to the farmers and all those involved in agriculture.
ACKNOWLEDGMENT
The authors owe a great deal to the Soil Testing Labs at Nettoor, Kochi, South India and Pattambi, Palakkad, South India for providing the soil samples.
REFERENCES
1. CMG Garden Notes 211, Colorado State University Extension, 2011.
2. Wastelands Atlas of India, Land Use Division, Land Resources Group, RS & GIS Applications Area, National Remote Sensing Centre, Indian Space Research Organisation, Hyderabad, 2010. 3. Freedman, G., “The future of microwave heating equipment in the food industries,” Microwave
Power, Vol. 7, 1973.
4. Fox, M. J.,Handbook of Microwave Measurements, Polytechnic Press Institute, New York, 1963. 5. Nelson, S. O., “Dielectric properties measuring techniques and applications,” American Society of
Agricultural Engineers, Paper No. 983067. St. Joseph, MI, 1998.
6. Rajesh Mohan, R., B. Paul, S. Mridula, and P. Mohanan, “Measurement of soil moisture content at microwave frequencies,”International Conference on Information and Communication Technologies (ICICT 2014), Elsevier Procedia Computer Science, Vol. 46, 1238–1245, 2015.
7. Behari, J., Microwave Dielectric Behaviour of Wet Soils, Anamaya Publishers, India, 2005. 8. Venkatesh, M. S. and G. S. V. Raghavan, “An overview of dielectric properties measuring
9. Topp, G. C., J. L. Davis, and A. P. Annan, “Electromagnetic determination of soil water content and electrical conductivity measurement using time domain reflectometry,” Water Resources Research, Vol. 16, 574–582, 1980.
10. Trabelsi, S. and S. O. Nelson,Free-space Measurement of Dielectric Properties of Cereal Grain and Oilseed at Microwave Frequencies, 589–600, Institute of Physics Publishing, 2003.
11. Analysis report Form ST-4, District Soil Testing Laboratory, Ernakulam and Palakkad, Kerala, South India, 2014.
12. Ouchar, A., R. Aksas, and H. Baudrand, “Artificial neural network for computing the resonant frequency of circular patch antennas,” Microwave and Optical Technology Letters, Vol. 47, No. 6, 564–566, 2005.