Available online: https://edupediapublications.org/journals/index.php/IJR/ P a g e | 1535
Investigating Mobile App User Behavior and Challenges
in Software Engineering
Boyapati Ramya Krishna & Md.Shakeel Ahmed
1Department of CSE (M.tech) 2Assistant professor M.tech
Vasireddy Venkatadri Institute Of Engineering and Technology, Nambur, state, INDIA 1 boyapatiramya1@gmail.com2shakeelahmedvits@gmail.com
Abstract
Mobile applications (apps) are software developed for use on mobile devices and made available through app stores. App stores are highly competitive markets where developers need to cater to a large number of users spanning multiple countries. This work hypothesizes that there exist country differences in mobile app user behavior and conducts one of the largest surveys to date of app users across the world, in order to identify the precise nature of those differences. The survey investigated user adoption of the app store concept, app needs, and rationale for selecting or abandoning an app. We collected data from more than 15 countries, including USA, China, Japan, Germany, France, Brazil, United Kingdom, Italy, Russia, India, Canada, Spain, Australia, Mexico, and South Korea. Analysis of data provided by 4,824 participants showed significant differences in app user behaviors across countries, for example users from USA are more likely to download medical apps, users from the United Kingdom and Canada are more likely to be influenced by price, users from Japan and Australia are less likely to rate apps. Analysis of the results revealed new challenges to market-driven software engineering related to packaging requirements, feature space, quality
expectations, app store dependency, price sensitivity, and ecosystem effect.
1. INTRODUCTION
Mobile apps are software
applications developed for use on mobile devices such as smart phones and tab-lets. Once developed, an app is sold via an app store. App development is market-driven. Similar to traditional market-driven software [1], [2], the requirements for an app are usually derived from strategic business goals or from market opportunities. During the development of an app, developers have limited contact with potential users. Success is measured by the number of downloads and revenues generated from the app. The app store concept has democratized the software industry—almost anyone can build and sell apps to a worldwide population of users via app stores. As the profit margins from app sales are small (Section 1.2), an app should ideally appeal to a large number of users worldwide in order to be successful. However, many developers are unaware that users from different countries have different behavior and needs, and that these factors affect app downloads.1
Despite these failures, app
development continues to accel-erate
Available online: https://edupediapublications.org/journals/index.php/IJR/ P a g e | 1536
engineering has been studied in the past [4], [5], [6], but today researchers are
increasingly focusing on the new
opportunities and chal-lenges of app development. Recent studies have made advan-ces in our understanding of app user behaviors through mining app store data, gathering user activity logs and sur-veys (e.g., [7], [8], [9]). These provide useful data relating to specific smartphones, app stores, apps, app categories (e.g., medical apps), countries, or age groups. However to date there has been little research that studies global user behaviors in different app stores and mobile devices, comparing across countries. In this work we complement previous research by focusing on this important area.
1.1 Contributions
This work makes the following
contributions:
We conducted one of the largest surveys to date of mobile app users worldwide, in terms of question-naire extent, participant number, and country cover-age. Our questionnaire investigated user adoption of the app store concept, their app needs, and their rationale for selecting or abandoning an app, as well as the differences in user behaviors across countries. We surveyed 10,208 participants from more than 15 countries, including the United States of America, China, Japan, Germany, France, Brazil, the United Kingdom, Italy, Russian Federation, India, Canada, Spain, Australia, Mexico, and Republic of Korea.
We analyzed the data and identified clear evidence that there exist country differences in user app behavior, where some, but not all, of these differences can be correlated with known cultural differences between countries. The analysis was conducted using well-established statistical measures such as the Pearson correlation coefficient, linear regression, Pearson’s chi-square test, and odds ratio. The large dataset enables our findings to be statistically significant.
1.2 Motivation
App development is now a mainstream form of software engineering. Just as the growth of web development resulted in every organization requiring its own webpages, today every organization requires its own apps. Major soft-ware companies such as IBM, Oracle and Accenture are pro-viding mobile application development services and support.3,4,5 The result is unprecedented growth and com-petition. For example, in January 2013, Apple’s iOS (mobile operating system) App Store had more than 200,000 app developers,6 700,000 apps, and 1,000 new apps per day. A keyword search for ―to do list‖ on 18 Jan 2013 returned more than 1,000 apps offering the feature. With so much competition, developers may lose downloads due to ―packaging‖ features such as the app’s icon, name, or description in the app store [10].
Available online: https://edupediapublications.org/journals/index.php/IJR/ P a g e | 1537
profit of an app priced at $0.99 has to be shared between the app store and the developer).10 It is not surprising that 80 percent of developers reported generating insufficient revenue to support their business.10 Some failures are very costly. For example, a $41 million project to develop an app that allows users to share live video broadcasts and photos with their friendswas abandoned due to insufficient users and a high churn rate.11,12
2 BACKGROUND
2.1 Mining App Store Data
App stores have accumulated a large amount of data, such as app descriptions, user ratings, and reviews. As such, an increasing number of studies to understand user needs are conducted by mining data from the app stores themselves. For example, Pagano and Maalej collected data on user rat-ings and reviews for the top 25 free and paid apps of one country on 16 September 2012 from each app category in the Apple iOS App Store [7]. They used various statistical measures to investigate how and when users provide feed-back, as well as analyze the content of the reviews. Their results showed that most user reviews were provided shortly after new releases, with a quickly decreasing fre-quency over time. In addition, user reviews typically con-tain multiple topics, such as user experience, bug reports, and feature requests. The quality and constructiveness of user reviews vary widely, from helpful advices and innova-tive ideas to offensive comments [7].
Harman et al. mined the Blackberry app store for informa-tion such as app description, app category, user ratings, price and the rank of the app based on downloads [14]. The authors found a strong correlation between user ratings and app rank-ing, but no correlation seemed to be present between price and number of downloads. Their study focused on priced apps, further work may be necessary in order to corroborate the findings by taking free apps into consideration [14]. Chen and Liu mined the Apple iOS App Store and collected app information such as name, developer, category, current rank-ing, average rating, and number of ratings [15]. Their analysis revealed that the top-ranked paid apps are not necessarily closely correlated with user ratings, and their finding was consistent with that of Pagano and Maalej [7].
2.2 Activity Logs
Available online: https://edupediapublications.org/journals/index.php/IJR/ P a g e | 1538
Their results indicated that news and weather apps are often used daily and at a certain time and sug-gested that developers could implement prefetching mecha-nisms in their apps to reduce latency perceived by users.
Falaki et al. collected app usage data from 255 Android and Windows Mobile users [18]. They found immense diversity among users, for example, the average number of smartphone interactions per user per day ranged from 10 to 200, and suggested that apps should adapt to different user groups. Bohmer et al. collected data related to the status information of apps, such as installing, uninstalling, open-ing, and closing, from 4,125 Android users [8]. Their study revealed many interesting app usage patterns, for example, new applications are most popular in the morning and games are most popular at night. However, the participants in Bohmer et al.’s study were biased towards early adopters and frequent app users [19]. Although these studies col-lected considerable data about app usage, they have limited information about the participants themselves [8], and as a result, have difficulty achieving statistical control over potentially confounding variables [19].
A number of studies focus on gathering requirements for specific apps. For example, Henze et al. published five game apps in the Android market and monitored how the apps were used [20]. Their most popular app collected data from 6,907 users. Their data showed that many users aban-doned the apps after a short period and they suggested that developers should focus on app quality
and providing incentives to users in order to motivate long-term use of an app [20]. Henze et al. also found that most of their partici-pants were English-speaking users from the United States, hence limiting their ability to derive conclusions about a global population [20].
In another study, McMillan et al. collected usage data of their iPhone app from 8,676 users over five months [21]. Data logging seemed to be a cost effective way to collect data from a large number of geographically dispersed users. However, activity logs were unable to provide an in-depth understanding of user behavior, and log analysis failed to reveal the users’ needs and rationale behind their behavior In addition, the data was biased towards users who enjoyed the app because users who did not enjoy the app, stopped using it and were unavailable for data logging [21]. The researchers supported the activity logs with question-naires to elicit feedback on app features and user demo-graphics (e.g., age, gender, country of residence). They also interviewed users from a range of countries, but due to lan-guage barriers and difficulty engaging the users, they could only interview 10 users [21].
Available online: https://edupediapublications.org/journals/index.php/IJR/ P a g e | 1539
participants with a lower household income used social networking apps such as Facebook and YouTube more than their peers. They also downloaded more apps, used them more frequently, but found them more difficult to use. In another study, Rahmati and Zhong conducted a four-month study of HTC Wizard phone usage from 14 teenagers in the United States [22].
2.3 Surveys and User Feedback
Elicitation
Surveys are one of the best tools to learn about large groups of users, their interests and their preferences [23]. When con-ducted effectively, surveys can produce a higher degree of certainty about the user’s profile compared to indirect analy-sis of user behavior via activity logs [23]. For example, in addition to activity logs from 117 users of Nokia N95 smart-phones in Switzerland, Chittaranjan et al. also used a ques-tionnaire
to collect the users’ demographic
information (e.g., gender, age, nationality) and self-reported personality traits They found that extraverted participants are more likely to use office and calendar apps, and receive more calls on their smartphone [24]. Male participants were more likely to use game apps, while female participants who were introverted were more likely to use Internet apps [24].
Franko and Tirrell conducted an online survey to examine the app needs of 3,306 medical practitioners in the United States [9]. They collected and analyzed data related to the app store adoption by physicians (e.g., use of smartphones, use of apps in clinical practice), app needs (e.g., commonly used
apps, desired app features), and
demographics (e.g., medical specialty, level of train-ing). Their results indicated that more than 85 percent of the participants owned a smartphone and 56 percent used apps in their clinical practice. They also found that the most useful features are drug guides, followed by medical calculators, coding and billing apps, and preg-nancy wheels. Most importantly, there was a mismatch between physician needs and app availabilities. Many reference apps cost nearly as much as equivalent print versions. In order for an app to be suc-cessful in being commonly used by physicians, it must be easy to use and reasonably priced. Finally, information contained within those apps may not be based on vali-dated or peer-reviewed information [9].
In order to gain a better understanding of development practices for mobile apps, Agrawal and Wasserman con-ducted a survey on app developers, using existing mobile developer forums to solicit respondents [25]. Their survey revealed that developers adhered quite well to recom-mended sets of ―best practices‖ but rarely used any for-mal development processes. In addition, developers rarely tracked their development efforts in an organized manner and gathered few metrics. As mobile apps move from inexpensive recreational uses to complex business-critical applications, it will be essential to apply software engineering processes to assure the
development of secure, high-quality
Available online: https://edupediapublications.org/journals/index.php/IJR/ P a g e | 1540
domain, there are other areas for new research and development such as user experience, non-functional requirements, processes, tools, and architecture [25].
In the field of requirements engineering, Seyff et al. pro-posed using mobile devices to elicit end-user needs [26]. Using their proposed method, mobile phone users can document their needs and requirements using text entry, audio recordings, and images captured using their phone. Their evaluation revealed that end-users are able to docu-ment their needs without being facilitated by requirements analysts [26].
2.4 Summary
To summarize, existing research into app user behavior focus on a specific smartphone, app store, app, app category (e.g., medical apps), country, or age group. Large-scale studies using activity logging and data mining can reveal interesting usage patterns but not the rationale behind the patterns. In addition, they lack information related to user demographics (e.g., age, country of residence), which can be useful to understand the usage patterns. User studies col-lect detailed data and can reveal interesting insights but they often involve insufficient number of participants for the
results to be generalizable. Most
importantly, the data is derived from highly focused studies, which are not able to elucidate the usage of many types of app at an international scale. There is a need for
more comprehensive data that is
representative of app user needs in many countries, which may help improve user
experience and improve software
development practice for mobile apps.
3. METHODOLOGY
This study used a survey to investigate the research questions. We constructed a questionnaire in order to collect quantitative data from app users. In order to provide a representative and generalizable view of mobile app user behavior, we targeted a large number of participants with varied demographics. Our survey focused on the top 15 GDP17 countries. The targeted countries were the United States of America, China, Japan, Germany, France, Brazil, the United Kingdom, Italy, Russian Federation, India, Canada, Spain, Australia, Mexico, and Republic of Korea, sorted by decreasing GDP.18 Due to the large coverage of participants, we employed an online survey in order make the survey more accessible.
To under-stand the participants’
background, we also used questions to elicit information about their demographics and personality.
3.1 Questionnaire Construction
Available online: https://edupediapublications.org/journals/index.php/IJR/ P a g e | 1541
device they use, as well as the app store they use. We used close-ended questions whenever possible because open-ended questions require much more effort from the respondents [23].
We arranged the questions so as to engage the partici-pants in the survey because participants who are interested are more likely to complete the survey and provide better quality data [23], [27]. For example, we grouped the ques-tions thematically and arranged questions to have a natural progression [23], e.g., start from how users find apps, to what influences them when downloading apps, the amount they spend on apps, to why they rate apps, and why they stop using apps. We put demographics questions at the end because they are considered boring and could be construed as intrusive at the start of the survey [23].
To reduce response bias, we randomized the ordering of the answer choices for choices that do not need to be sorted in order (e.g., answers for the app store questions). This method reduces bias that may occur when respondents choose answers without reading all of the options [27]. In doing so, some options (such as ―I don’t rate apps‖ and ―I do not pay for apps‖) remain the first option so that partici-pants who do not do those things can quickly move on to the next question, and some options (such as ―Other‖) remain the final option where people usually find them.
3.2 Data Collection
Two methods were used for data collection: snowballing and online panels. The survey
was conducted from the 26th of September 2012 to the 26th of November 2012. In the first method, we used the snowballing method (used in our pre-vious research [30], [31]) to recruit participants. Specifically, we invited individuals in our social networks to complete the survey, and then asked them to invite individuals in their social networks to complete the survey, and so on. The following methods were used: emails to specific colleagues or friends, emails to mailing lists, posting the survey link on Twitter, Facebook, and LinkedIn.
The second method comprised the distribution of our survey to a panel of international participants provided by Cint,20 an ISO certified panels company for conducting opinion and social research.21 To achieve a representative sample of the target population, the panels used a random and stratified sampling technique, and enabled the recruit-ment of participants that is census representative.22 Within the required targets, sample is randomly generated as well as being stratified by high, medium and low responders. A total of 32,491 panel members were recruited to participate in the survey.
3.6 Data Cleaning Approach
Available online: https://edupediapublications.org/journals/index.php/IJR/ P a g e | 1542
hagan funcionar mejor‖ was translated to English as ―for creators to make them work better,‖ and coded as ―feedback to developers.‖ We assigned the same code to other answers that when translated have the same meaning, e.g., ―to provide feedback to the developers‖ and ―to inform creators of defects in the app‖.
We then parsed the codes as follows. If the code dupli-cated an existing option in the same question, we merged it with the
existing option, and removed the
participants’ selection of the ―Other‖ option. (We found the majority of codes to fall in this category.) If the code duplicated an exist-ing option in another question, we selected the option in the other question, and maintained the participants’ selection of the ―Other‖ option in the original question. If the code was new, but the number of answers sharing the same code was more than 5 percent, we created a new option for thequestion, and participants were recoded to select the new option rather than ―Other.‖ If the code was new, but the number of answers sharing the same code was less than 5 percent, the participants remained selecting the ―Other‖ option. This approach was used so that the ―Other‖ option was the one with the fewest answers among all options [33].
Finally, for respondents who did not know their app store, we used the mobile phone specifications they provided in order to derive their app stores. For example, if their mobile phone is iPhone, we recoded their app store as Apple iOS App Store, because the iOS App Store is the most
com-mon and the only official app store used by iPhone users.
3.7 Data Analysis Techniques
We analyzed RQ1 3 using descriptive statistics. We also used parametric statistics to analyze the relationship between variables as follows. We used the Pearson correla-tion coefficient to analyze the relationship between users’ age and other variables, such as whether they use search engines to find apps, or whether price influences their app choice, as well as frequency of app store visits and the aver-age number of apps downloaded. Moderate sized correla-tions (r > .5) were followed up with linear regressions in order to assess whether one variable was a significant pre-dictor of the other variable.
Available online: https://edupediapublications.org/journals/index.php/IJR/ P a g e | 1543
users from countr
y C
are R times more likely to exhibi
t behav ior B
comp ared
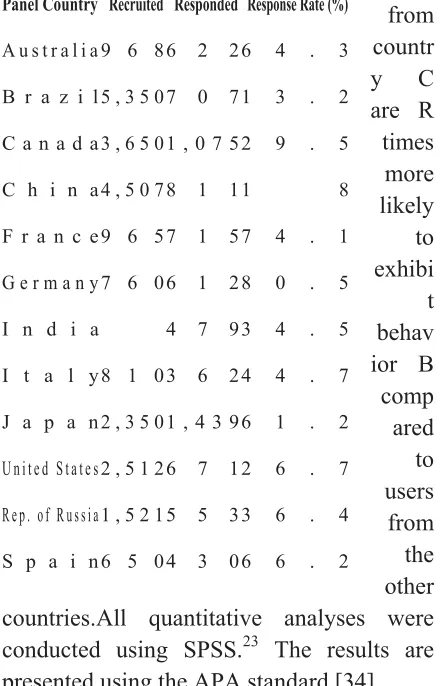
to users from the other countries.All quantitative analyses were conducted using SPSS.23 The results are presented using the APA standard [34].
4. RESULTS
Out of the 32,491 participants recruited from the panel, a total of 9,818 participants responded, and a further 390 par-ticipants responded from our snowballing method, result-ing in a total of 10,208 participants who responded to our survey (96 percent panel, 4 percent snowballing method). The overall response rate was approximately 30 percent. This is similar to the highest response rate achieved for
TABLE 2
A further 390 participants responded through the snowballing method.26For some participants, the panel country differed from the country of residence. In our analysis of different countries, we used country of residence provided by the participant in the demographics section of the questionnaire.A total of 8,082 participants completed the survey (panel ¼ 7,831, snowballing ¼ 251). (We excluded incom-plete surveys in our analysis.) A total of 3,258 partici-pants were screened out because they did not use apps.25Only three participants provided bad data (e.g., garbage or obscenities) and were excluded from the anal-ysis. Thus the final total comprised 4,824 participants (Male ¼ 2,346 (49 percent), Female ¼ 2,478 (51 percent), aged 11-87, average age ¼ 34.51, standard deviation ¼ 15.19). Fig. 2 shows the country of residence of the par-ticipants at the time of the survey. A total of 1,805 partic-ipants (37.4 percent) were interested to learn about the results of the survey and volunteered their contact details. The complete dataset is available in the supple-mentary material of the paper, available
online, and at:
http://www.cs.ucl.ac.uk/research/app_user_s urvey/.
Panel Country Recruited Responded Response Rate (%)
A u s t r a l i a 9 6 8 6 2 2 6 4 . 3
B r a z i l 5 , 3 5 0 7 0 7 1 3 . 2
C a n a d a 3 , 6 5 0 1 , 0 7 5 2 9 . 5
C h i n a 4 , 5 0 7 8 1 1 1 8
F r a n c e 9 6 5 7 1 5 7 4 . 1
G e r m a n y 7 6 0 6 1 2 8 0 . 5
I n d i a
1 , 4 7 9 33 84 . 5 8
I t a l y 8 1 0 3 6 2 4 4 . 7
J a p a n 2 , 3 5 0 1 , 4 3 9 6 1 . 2
U n i t e d S t a t e s 2 , 5 1 2 6 7 1 2 6 . 7
R e p . o f R u s s i a 1 , 5 2 1 5 5 3 3 6 . 4
Available online: https://edupediapublications.org/journals/index.php/IJR/ P a g e | 1544
CONCLUSION
Mobile apps are software developed for use on mobile devi-ces and made available through app stores. App stores are highly competitive markets with a rapidly increasing num-ber of apps, and developers need to cater to a large number of users due to low margins per sale. In this study, we con-ducted one of the largest surveys to date of mobile app users across the world. We demonstrated that app user behavior differs significantly across countries, a result that was shown in other domains but never before in app-based software engineering, indicating that app developers should carefully consider the countries of their target users. We also investigated user adoption of the app store concept, their app needs, and their rationale for selecting or aban-doning an app. Through analysis of the survey results, we identified new challenges to market-driven software engi-neering related to packaging requirements, feature space, quality expectations, app store
dependency, price sensitiv-ity, and
ecosystem effect, and their implications for software engineering research in terms of
research directions and tool
development.We have released the results of our survey to the app developer community and received feedback that the insights are very useful. Some developers have requested for other countries to be studied as they are building apps for those countries.
We anticipate that the new challenges identified in this paper can guide software
engineering researchers towards the
development of tools and techniques to
improve mar-ket-driven software
engineering for mobile apps.
ACKNOWLEDGMENTS
The authors wish to thank their colleagues for translating the questionnaire: Arturo Araujo (to Spanish), Bora Kim (to Korean), Eric Platon (to French), Florian Wagner (toGerman), Kyoko Oda (to Japanese), Michael Bottone (to Ital-ian), and Yiqi Deng (to Mandarin). They also wish to thank Day Translations, Inc. for translating the questionnaire into Russian and Portuguese, Adrian Klein, Ea Gram, Franco Raimondi, Ian Thorne, Jason Lau, Kazuki Nishiura, Kyoko Oda, Ruth Compton, Sanchia Yip, Thomas Compton, and Valentina Baljak for their feedback on the questionnaire, Jennifer van Heerde-Hudson for her survey advice, and the survey participants for their time.
REFERENCES
[1] P. Sawyer, I. Sommerville, and G. Kotonya, ―Improving market-driven RE processes,‖ in Proc. Int. Conf. Product Focused Softw. Pro-cess Improvement, 1999, pp. 222–236.
[2] J. Natt Och Dag, ―Elicitation and management of user require-ments in market-driven software development,‖ Dept. Commun. Syst. Lund Institute Technol., Licentiate Thesis, 2002.
[3] Distimo, ―In-depth view on
Available online: https://edupediapublications.org/journals/index.php/IJR/ P a g e | 1545
market,‖ Distimo Company Rep., Utrecht, Netherlands, 2011.
[4] C. Potts, ―Invented requirements and
imagined customers: requirements
engineering for off-the-shelf software,‖ in Proc. 2nd
IEEE Int. Symp. Requirements Eng., 1995, pp. 128–130.
[5] L. Karlsson, N. G. Dahlstedt, B. Regnell, J. Natt Och Dag, and A. Persson, ―Requirements engineering challenges in market-driven software development: An interview study with practitioners,‖ Inform. Softw.Technol., vol. 49, pp. 588–604, 2007.
[6] K. Wnuk, B. Regnell, and B.
Berenbach, ―Scaling up requirements engineering, exploring the challenges of increasing size and com-plexity in market-driven software development,‖ in Proc. 17th Int. Working Conf. Requirements Eng.: Found. Softw. Quality, 2011, pp. 54– 59.
[7] D. Pagano and W. Maalej, ―User
feedback in the appstore: An empirical study,‖ in Proc. 21st IEEE Int. Requirements Eng. Conf., 2013, pp. 125– 134.
[8] M. Bohmer, B. Hecht, J. Schoning, A. Kruger, and G. Bauer, ―Falling asleep with Angry Birds, Facebook, Kindle: A large scale study on mobile application usage,‖ in Proc. 13th Int. Conf. Human Comput. Interaction Mobile Devices Services, 2011, pp. 47–56.
[9] O. I. Franko and T. F. Tirrell, ―Smartphone app use among medi-cal providers in ACGME training programs,‖ J. Med. Syst., vol. 36, pp. 3135–3139, 2012.
[10] B. Westerman, ―How do people really use the iPhone,‖ Presenta-tion slides published in 2008 by Create with Context,
Inc. URL:
http://createwithcontext.com/insights-how-peoplereally-use-the-iphone.php.
[11] G. Hofstede, G. J. Hofstede, and M. Minkov, Cultures and Organiza-tions: Software of the Mind, vol. 2. London, U.K.: McGraw-Hill, 1991.