Available Online at www.ijcsmc.com
International Journal of Computer Science and Mobile Computing
A Monthly Journal of Computer Science and Information Technology
ISSN 2320–088X
IJCSMC, Vol. 3, Issue. 12, December 2014, pg.310 – 320
RESEARCH ARTICLE
ARBITARY DISTRIBUTED SHADOWING FOR
IMPROVING QUALITY OF REAL TIME STREAMING
IN WIRELESS CELLULAR NETWORKS
V.V.G.S RAJENDRA PRASAD, M.Tech1, R.RANJIT KUMAR, M.Tech2, L.VISHNU VARDHANM3 (M.Tech) Professor & Head of ECE Department, MVR College of Engg & Tech, JNTUK University,India1
Assistant Prof In ECE Department ,MVR College of Engg & Tech, JNTUK University,India2
M.Tech Scholar, MVR College of Engg & Tech, JNTUK University, India3
Abstract: This paper gives numerically tractable, explicit integral expressions for the distribution of the signal-to-interference-and- noise-ratio (SINR) experienced by a typical user in the downlink channel from the k-th strongest base stations of a cellular network modeled by Poisson point process on the plane. Our signal propagation-loss model comprises of a power-law path- loss function with arbitrarily distributed shadowing, independent across all base stations, with and without Rayleigh fading. Our results are valid in the whole domain of SINR, in particular for SINR < 1, where one observes multiple coverage. In multiple access channels, when users know each other’s channels, precoders can be designed utilizing channel information
to cancel the interference at the receiver without sacrificing the diversity or the complexity of the system. Recently, it was shown those when there are only two users, a receiver can completely cancels the interference of the two users and provide full diversity for each user. Unfortunately, the scheme only works for two users. In this paper, we extend the scheme to more than 2 users.
We also analytically prove that our system provides full diversity to each user. Simulation results confirm our analytical proof and show that our proposed scheme outperforms other existing interference cancellation schemes. In this latter aspect our paper complements previous studies reported in [1].
Keywords: Wireless cellular networks, Poisson process, shadowing, fading, SINR, multiple coverage, symmetric sums
I. INTRODUCTION
Recently, a lot of attention has been given to multi-user detection schemes with simple receiver structures. Multiple transmit and
receive antennas have been used to increase rate and improve the reliability of wireless systems. In this paper, we consider a
multiple-antenna multi-access scenario where interference cancellation is achieved by utilizing channel information. Shannon's
theory and its modern extensions quantify the quality of communications channels (ergodic capacity, finite block errors, error
exponents, etc.) in a probabilistic manner by considering averages over codeword’s and channel characteristics (noise, fading,
consisting in taking spatial averages over node (emitter, receiver) locations. Establishing clear connections between
stochastic-geometric averages and basic information-theoretic notions may be difficult (cf e.g. [3]) but this approach for wireless networks
has recently attracted a lot of attention. In particular, the fundamental characteristic, discovered in information theory,
signal-to-noise-ratio is now being studied in many geometric contexts with the incorporation of interference. This paper contributes to this
approach by considering the distribution of the signal-to-interference-and- noise-ratio (SINR) of a typical user on down-link
channels from different base stations of a single-tier cellular network modeled by Poisson point process on the plane. In
particular, it complements [1], by providing explicit characterization of low (less than one) values of SINR. Current
cellular-network technology allows for effective use of such SINR regimes, whence our motivation comes.
Cellular network models based on the Poisson point process have been shown to give tractable and accurate solutions [4], with
the Poisson assumption being justified by representing highly irregular base station deployments in urban areas [5] or mimicking
strong log-normal shadowing [6], or both. Knowledge of the distribution of SINR allows to calculate key performance indicators
of cellular networks, e.g. spectral efficiency [7] 1 or energy efficiency [6, 9]. It can also be (non- trivially) related to user-level quality-of-service metrics.
In studying the SINR of a given user with respect to the base station with the greatest received signal, the main difficulty for
small values of SINR is taking into account multiple coverage. Simple algebra shows that there can be at most one base station
offering a given user SINR > 1, and hence the probability of having at least one station covering at this level reduces to the sum
of probabilities of SINR-coverage over all base stations. However, this is not the case for SINR < 1, where one needs to study
probabilities of simultaneous coverage by several base stations. We express these probabilities via the so-called symmetric sums
and relate them to the appropriate partitioning of the SINR domain for SINR < 1, which are the main ideas behind this paper. Our
signal propagation-loss model consists of the deterministic power-law path-loss function and independent (across all base
stations), arbitrarily distributed shadowing. As previously observed [6, 10], any characteristic involving only the sequence of
propagation-loss values experienced by a given user from all base stations entirely depend on the distribution of the shadowing
via its moment of order 2/3, where 3 is the path- loss exponent. We also study the impact of Rayleigh fading on the SINR
coverage by incorporating into the propagation-loss model additional independent (across all base stations) random variables with
exponential distributions. Assuming that fading affects the SINR coverage condition but not the choice of the serving base
station, we observe that it worsens the coverage particularly at small values of SINR.
The SINR coverage in a multi-tier network was studied in [1] for SINR > 1. Two different approaches to express the
distribution of the SINR in its whole domain, both involving inversion of Laplace transforms, were presented in [6, 11]. Our
expressions, which involve two key families of integrals (over the positive real line and a hyper-cube respectively), are much
more tractable in numerical evaluation. Our model with fading was recently examined in [12] under slightly more general
assumptions. We revisit it in order to present more closed- form expressions under our specific assumptions, and compare the
coverage probabilities obtained in it to these in the model without fading. Which of these two models is more appropriate depends
on the context. For example if users are motionless, then the fading should be taken into account, while highly mobile users "see"
channel characteristics averaged over fading.
II. OBJECTIVES
A receiver can completely cancel the interference of the two users and provide full diversity for each user. Unfortunately,
the scheme only works for two users. For that we extend cancel the interference of the more than two users and provide full
diversity for each user.
III. EXISTING SYSTEM
The existing multi-user systems are the small number of required receive antennas and the low complexity of the array-processing decoding. However, as mentioned before, full diversity for each user is only achieved using maximum-likelihood detection. On the other hand, maximum-likelihood detection is usually not practical, because its complexity increases exponentially as a function of the number of antennas, the number of users, and the bandwidth efficiency
IV. DISADVANTAGES OF EXISTING SYSTEM
High complexity
High interference
Limited users
V. PROPOSED SYSTEM
Scientists and developers of digital communication systems are interested not only in the modeling and performance evaluation of
single communication links. Typically, the performance of the whole network containing many links working in parallel and
interfering with each other is of primary interest, therefore the so-called system level simulation is also necessary. This type of
simulation allows the modeling of resource management issues, admission of system users, interaction and network loading by
several types of traffic sources, etc. The aim of such modeling is network capacity evaluation.
The recommended advanced channel model structure is shown in Fig. 1. The channel model consists of a Primary Module and an
Extension Module. The Primary Module originates from the WINNER II channel model, whereas the Extension Module has been
added to enable the tests of wireless systems operating in scenarios beyond those specified by the advanced system requirements.
Fig:1 Block diagram of the proposed system
Scenarios are modeled in the Primary Module: indoor hotspot (InH), urban micro-cell (UMi), urban macro-cell (UMa), and rural
macro-cell (RMa). Additionally, the optional suburban macro-cell (SMa) scenario has been taken into account in the evaluation
of IMT- Advanced system proposals. Each of the scenarios is accompanied by a set of parameters that are fed to the generic
large- and small- scale parameters and channel impulse response generation procedures. The Extension Module is a tool allowing
the selection of modified parameters to generate large-scale (LS) parameters of the simulated scenarios for macro-cell scenarios,
small- scale (SS) and LS parameters are variables, and the extension module provides new parameter values for the primary
module based on environment-specific parameters. The Extension Module is optional for implementation.
VI. ADVANTAGES OF PROPOSED SYSTEM
Full diversity achieved
High interference cancellation
It is applied to many no of users
Low complexity
VII. SHADOWING TECHNIQUE
A lot of attention has been given to multi-user detection schemes with simple receiver structures. Multiple transmit and
receive antennas have been used to increase rate and improve the reliability of wireless systems. In this paper, we consider a
multiple-antenna multi-access scenario where interference cancellation is achieved by utilizing channel information. We assume a
quasi-static flat Rayleigh fading channel model. The path gains are independent complex Gaussian random variables and are fixed
during the transmission of one block. In addition, a short-term power constraint is assumed. For the sake of simplicity, we only
present the scheme for four users each with four transmits antennas and one receiver with four receives antennas. By adjusting the
dimensions of channel matrices, our proposed scheme can be easily applied to J users with J transmit antennas and one receiver
with J receive antennas.
On R2, we model the base stations with a homogeneous Poisson point process $ with density A. Given $, let {Sx}xe$ be a
collection of independent and identically distributed random variables, that represent the shadowing experienced between station
x G $ and a typical user located, without loss of generality, at the origin. Let S denote a generic shadowing variable. The
distribution of S is arbitrary except for a technical assumption E[S2] < to and a conventional assumption that E[S] = 1 that we make without loss of generality.
A. SINR multi-coverage We define the SINR of the typical user with respect to the station x G $ by
Sx / (|x|)
SINR(x):=---
W + I - Sx /£ (|x|)'
where the constant W is the noise power, I =∑ x€ ɸ Sx/£( |x|) is the total power received from the entire network, and the path-loss function is£ (|x|) — (K |x|f) β, (2)
with constants K > 0 and β > 2. In this paper we are interested in the distribution of the coverage number of the typical user
defined as the number of base stations that the typical user can connect to at the SINR level T, namely
∑ ∲ (3)
-coverage probability, is coverage condition but not the choice of the serving base station 4. In consequence, the coverage probability under fading (with respect to the smallest fading-averaged-propagation-loss base station) is defined as
P c (T) = P {(Yi)-1F /( W + I - (Y1)- 1F )>T} (4)
VIII. IMPLEMENTATION
In order to obtain sufficient statistical knowledge on the system performance in the simulated environments, a sufficiently high
number of statistical events have to be modeled. A statistical event describes a particular distribution of mobile terminals in the
simulated network coverage area for which all transmission channels to the assigned base stations are determined. Thus, a
statistical event involves a random selection of mobile terminal locations and a selection of random properties of all channels
between the mobile terminals and base stations. As it has been mentioned before, such an approach to deriving statistical
properties of the investigated system is called the drop concept. In a single drop, mobile station locations and large scale channel
parameters are fixed. Only fast fading is dynamically simulated.
Deriving performance measures for each drop requires the collection of an appropriately high volume of simulation data. Reliable
statistical properties are obtained by the selection of a sufficiently high number of drops. In the assumed model [13], the
properties of each drop are selected randomly and independently of the properties of the previous drops.
The coefficients of each channel are generated in a stepwise procedure visualized in Figure 2. First, the propagation
scenario is selected and the environment parameters for this scenario are defined. After that, the network layout is set up by
generating base station positions according to the network topology and by randomly generating the positions of user terminals
In the next step, large-scale parameters are generated. First, LoS or NLoS propagation conditions are chosen. They can be
selected randomly for all terminals in the whole network; however, in the calibration mode, the same LoS or NLoS propagation
can also be chosen for all terminals. After setting the LoS/NLoS conditions, an appropriate path loss formula is applied for each
link.
Finally, large-scale parameters are generated for each link. The large-scale parameters are: delay spread (DS), angle
spread of arrival (ASA), angle spread of departure (ASD), Ricean K factor (K) and shadow fading (SF). In order to receive
correlated values of each large scale parameter, first, random Gaussian distributed numbers for each of them are generated on a
dense two-dimensional grid covering the area of the whole simulated network. Then, each parameter surface is filtered in two
dimensions by an exponential filter with parameters determined on the basis of measurements and given in [13]. Similarly to
what has been done in [35], filtering in two dimensions is performed using a one-dimensional filter, by implementing it as a
two-step procedure. In the first two-step, the filtration along the x-axis is performed. In the second two-step, the resulting surface is filtered
again along the y- axis. Figure 6 illustrates the filter impulse responses and the filtered parameters on the grids for the indoor
and the zero mean). In order to apply them in the simulator, inverse mapping to the log-normal distribution with scaling by the
relevant standard deviation and shifting them by the selected mean value is performed.
Let us consider K mobile terminals located in specified places and linked to the same base station. The filtered values of
each parameter at a specific location of each mobile terminal constitute a basis for the calculation of the final parameter values
which are received due to the cross-correlation between all large scale parameters. This operation is performed by a matrix
multiplication. The entries of the cross-correlation matrix are determined by measurements. Their values are given in [13]. The
resulting large-scale parameters are Gaussian distributed. As the assumed distributions of ASA, ASD, SF, K and DS in the
channel model are log-normal, the inverse mapping from Gaussian to log-normal random variables is applied.
Conditions (IR - impulse response, LSP - large-scale parameters). In the exemplary simulator implemented at the
Poznan University of Technology, the path losses between each mobile terminal and each base station are known. This enables
the assignment of each mobile terminal to the serving base station. Such an assignment is a procedure in which a mobile station
selects the serving base station from a list of candidate base stations featuring the highest received power within the 1 dB margin.
In Fig. 7, the resulting wideband signal to noise and interference (Wideband SINR) is presented, and in Fig. 8, the selected
serving cells ID are visualized. Note that due to Figs. 7 and 8 data generation procedure, only the cross-correlation of LSPs was
performed.
Figure 2. Wideband SINR experienced by UEs
After the large-scale parameters are fixed for each link, the generation of small-scale parameters is performed. For each
propagation scenario, the number of clusters applied in the channel model is given in [13]. First, cluster delays in a given link are
generated on the basis of the delay spread parameter. After that, cluster powers are generated using a particular cluster delay as a
small-scale parameter generation is the calculation of the departure and arrival angles, first for the clusters and then for the rays of
which the clusters are composed.
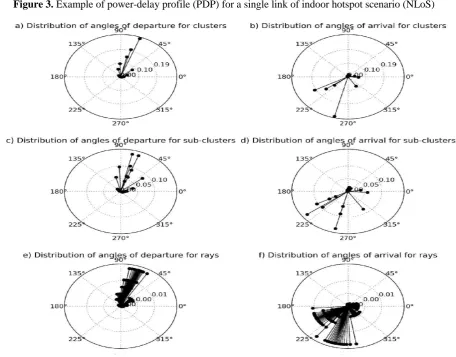
Figure 4. Example of generated angles for a single link of indoor hotspot scenario (NLoS).
Figs. 3 and 4 illustrate the above operation performed for a single link. Two plots in Fig. 9 show the link power profile
normalized to unity. Plot 9a illustrates the power profile for clusters before the division of the two strongest clusters into
sub-clusters. Plot 9b shows the power profile after performing this operation. In Fig. 10, angular parameters of a single link are
presented. Plots 10a and 10b present the distributions of the departure and arrival angles for clusters before the division, whereas
plots 10c and 10d show the same parameters after sub-cluster division. Finally, plots 10e and 10f show the ray angle distribution.
In the last row of plots, the angles are wrapped into [- n, n] interval.
When all large- and small-scale parameters are set, the final MIMO channel impulse response coefficients are calculated.
There is a separate impulse response for each pair of the sth transmit and uth receive antenna array elements.
IX. SIMULATION RESULTS
In this section, we provide simulation results that confirm our analysis in the previous sections. The
performance of our proposed scheme is shown in Figures 8,9
Figure 5 Simulation results for SINR calculation for Simulation and Integration without fading.
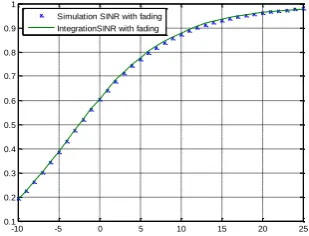
Figure 6. Simulation results for SINR calculation for Simulation and Integration with fading.
-10 -5 0 5 10 15 20 25
0 0.1 0.2 0.3 0.4 0.5 0.6 0.7 0.8 0.9 1
T (dB)
1
-P
c
(T
)
Simulation SINR IntegrationSINR
-10 -5 0 5 10 15 20 25 0.1
0.2 0.3 0.4 0.5 0.6 0.7 0.8 0.9 1
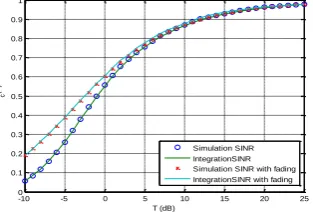
Figure 7. Comparison of Simulation results for SINR calculation without and with fading
In addition, in Figure 8, we have provided a simulation results versus the integration models. In all case,
what we mean by SINR is Signal Interference noise Ratio is the average SINR for the performance of
proposed system with and without Rayleigh fading of mean around 1. From Figure 9, we can see that
adapting the Integration we can improve the performance compared with using a Simulation rate. Also we
can see that even with variable rate, our scheme provides the best performance.
X. FUTURE EXTENSION
Fig 8:Calculates delta probability for 2-base station signal combination % and second-strongest signal removed under arbitrary
shadowing/fading in a multi-tier cellular network based on a Poisson
-10 -5 0 5 10 15 20 25
0 0.1 0.2 0.3 0.4 0.5 0.6 0.7 0.8 0.9 1
T (dB)
1
-Pc
(T
)
Simulation SINR IntegrationSINR Simulation SINR with fading IntegrationSINR with fading
-100 -5 0 5 10 15 20
0.05 0.1 0.15 0.2 0.25
Fig 9:Calculates coverage probability for a single-tier cellular network with log-normal shadowing based on a Poisson model outlined in [1] For SIR results (ie noise N=0) results are scale-invariant (independent of lambda) A variation of this code was used to produce Figures 1 and 2 in
XI. CONCLUSION
We have considered interference cancellation for a system with more than two users when users know each other’s
channels. We have proposed a system to achieve the maximum possible diversity of 16 with low complexity for 4 users each with
4 transmit antennas and one receiver with 4 receive antennas. Besides diversity, our proposed scheme also provides the best
performance among all existing schemes with simple array processing decoding. Our main idea is to design precoders, using the
channel information, to make it possible for different users to transmit over orthogonal directions..the probability update scheme
has been modified in such a way that time consumer for probability is optimized and user cannot identify any difference with the help of delta
probability. The comparative result of delta probability and normal probability have been show in fig 8and9 .We have analytically proved
that the system provides full diversity
REFERENCES
[1] H. Dhillon, R. Ganti, F. Baccelli, and J. Andrews, "Modeling and analysis of K-tier downlink heterogeneous cellular networks," IEEE J. Sel. Areas Commun., vol. 30, no. 3, pp. 550-560, april 2012.
[2] M. Haenggi, J. Andrews, F. Baccelli, O. Dousse, and M. Franceschetti, "Stochastic geometry and random graphs for the analysis and design of wireless networks," IEEE J. Sel. Areas Commun., vol. 27, no. 7, pp. 1029-1046, September 2009.
[3] C. Galarza, P. Piantanida, and M. Kountouris, "On the block error probability of finite-length codes in decentralized wireless networks," in Proc. ofAllerton Conference, sept. 2011, pp. 11951201.
[4] J. Andrews, F. Baccelli, and R. Ganti, "A tractable approach to coverage and rate in cellular networks," IEEE Trans. Commun., vol. 59, no. 11, pp. 3122 -3134, november 2011.
[5] C.-H. Lee, C.-Y. Shih, and Y.-S. Chen, "Stochastic geometry based models for modeling cellular networks in urban areas," Wireless Networks, pp. 1-10, 2012.
[6] B. Blaszczyszyn, M. Karray, and H. Keeler, "Using Poisson processes to model lattice cellular networks," in Proc. of IEEE IN- FOCOM, 2013, available also at http://arxiv.org/abs/1207.7208.
[7] M.-S. Alouini and A. Goldsmith, "Area spectral efficiency of cellular mobile radio systems," IEEE Trans. Veh. Technol., vol. 48, no. 4, pp. 1047-1066, jul 1999.
-10
0
-8
-6
-4
-2
0
2
4
0.2
0.4
0.6
0.8
1
[8] T. Bonald, S. Borst, N. Hegde, and M. Jonckheere, "Flow- level performance and capacity of wireless networks with user mobility," Queueing Systems, vol. 63, pp. 131-164, 2009.
[9] F. Richter, A. Fehske, and G. Fettweis, "Energy efficiency aspects of base station deployment strategies for cellular networks," in Proc. of IEEE VTC, sept. 2009.
[10]B. Blaszczyszyn and M. K. Karray, "Quality of service in wireless cellular networks subject to log-normal shadowing," IEEE Trans. Commun., vol. 61, no. 2, pp. 781-791, 2013, published on Early Access on December 2012.
[11]H. Dhillon, R. Ganti, F. Baccelli, and J. Andrews, "Coverage and ergodic rate in K-tier downlink heterogeneous cellular networks," in Proc. ofAllerton Conference, sept. 2011, pp. 1627 -1632.
[12]T. T. Vu, L. Decreusefond, and P. Martins, "An analytical model for evaluating outage and handover probability of cellular wireless networks," in Proc ofWPMC, sept. 2012, pp. 643 -647.
[13]S. Borst, "User-level performance of channel-aware scheduling algorithms in wireless data networks," in Proc. of IEEE INFO- COM, 2003, pp. 321-331.
[14]W. Feller, An Introduction to Probability Theory and its Applications, vol I., 3rd ed. New York: J. Wiley & Sons, 1968. [15]H. U. Gerber, Life Insurance Mathematics. Springer, 1995.
[16]F. Baccelli and B. Blaszczyszyn, Stochastic Geometry and Wireless Networks, Volume I — Theory, ser. Foundations and Trends in Networking. NoW Publishers, 2009, vol. 3, No 3-4.
[17](2012, Accessed on the 10th of September) Digital Library of Mathematical Functions. National Institute of Standards and
Technology. Release 1.0.5 of 2012-10-01. [Online]. Available: http://dlmf.nist.gov/
[18]E. Ulanskii, "An identity for generalizing the hyper geometric integral," Mathematical Notes, vol. 79, no. 5, pp. 741-744, 2006.
[19]H. P. Keeler, "SINR-based fc-coverage probability in cellular networks," MATLAB Central File Exchange, 2013. [20]F. Kuo and I. Sloan, "Lifting the curse of dimensionality," Notices softheads, vol. 52, no. 11, pp. 1320-1328, 2005.

![Fig 9:Calculates coverage probability for a single-tier cellular network with log-normal shadowing based on a Poisson model outlined in [1] For SIR results (ie noise N=0) results are scale-invariant (independent of lambda) A variation of this code was used to produce Figures 1 and 2 in ](https://thumb-us.123doks.com/thumbv2/123dok_us/1965203.1259162/10.595.192.400.67.288/calculates-coverage-probability-shadowing-poisson-invariant-independent-variation.webp)