Detection and Location of Nonlinear Scatterers Using DORT
Applied with Pulse Inversion
Joesph M. Faia1, Yujie He1, Hong Soo Park2, Edward Wheeler1, and Sun K. Hong2, *
Abstract—In this paper, an experimental demonstration employing the decomposition of the time-reversal operator (known as DORT) in combination with pulse inversion is reported, allowing one to detect and selectively focus on nonlinear targets. DORT is a technique based on a multistatic configuration that separates the detected targets by means of eigendecomposition of the time reversal operator allowing for selective transmission of waves towards a target of interest. Pulse inversion is a technique that enhances harmonic responses while suppressing fundamental responses. By applying DORT with pulse inversion (PI-DORT), harmonic detection and selective transmission to detected nonlinear targets can be enhanced. The results from our experiment show that PI-DORT can effectively detect and separate nonlinear targets for selective transmission.
1. INTRODUCTION
Remote detection of objects has long been a topic of interest in applied electromagnetics. In some applications, targets of interest are nonlinear devices that contain semiconductors (i.e., electronic devices), which can be difficult to detect and identify in the presence of other linear (non-electronic) scatterers with similar or larger scattering cross sections. One way to overcome the difficulty involved in their detection is to exploit their non-linearity, that is, to use their harmonic response for distinguishing them from linear scatterers. Since higher order harmonics of the original excitation can only be generated via nonlinear interaction, reception of the harmonic responses indicates the presence of a nonlinear target and inherently provides clutter rejection. Various works have shown the utility of harmonics-based detection of nonlinear devices for applications including radars, RFID and biomedical [1–6].
In addition to detection, the ability to selectively focus electromagnetic energy at detected nonlinear targets may be desirable in a range of applications. For wireless power transfer, harmonic responses from passive rectifiers can be exploited for detection and subsequent selective focusing (beam-forming) to concentrate wireless power at the detected device. Similarly, harmonic detection and selective focusing may also be used to send power or information to a passive biomedical implants. Security applications may include detection of hostile electronic devices which could then be disabled by selectively beaming high power electromagnetic energy.
To this end, we have recently proposed the use of DORT in combination with pulse inversion (PI) for detecting and selective focusing on nonlinear devices in the presence other linear scatterers [7]. DORT (French acronym for decomposition of time-reversal operator) is a technique that utilizes multistatic scattered responses obtained with an array of antennas by means of the eigenvalue decomposition (EVD) to separate the detected targets in terms of the eigenvalues and their eigenvectors, which contain the information necessary to perform selective focusing (beamforming) towards a target of interest [8, 9]. PI is a technique that allows either even- or odd-ordered harmonics to be extracted from the linear
Received 26 September 2018, Accepted 21 November 2018, Scheduled 7 December 2018
* Corresponding author: Sun K. Hong ([email protected]).
1 Department of Electrical and Computer Engineering, Rose-Hulman Institute of Technology, 5500 Wabash Ave., Terre Haute, IN
combination of the scattered responses due to excitation by two transmit pulses, with one an inverted version of the other but otherwise identical [10, 11]. Our previous work in [7] has proposed PI-DORT for nonlinear devices by providing examples via a two-dimensional numerical simulation. In this paper, the utility of PI-DORT for nonlinear targets is experimentally confirmed in a three-dimensional testbed with the results demonstrating that nonlinear targets can be effectively detected and separated for selective focusing.
2. PI-DORT
DORT basically is an iterative implementation of time-reversal with an array of antennas, where all of the monostatic and bistatic pairs of the array elements are used. Assume an environment where P individual, well-resolved, scatterers are present. For an N-element array, an N ×N response matrix
M(t) is constructed from multistatic operation, i.e.,
M(t) =
⎡ ⎣
m1,1(t) · · · m1,N(t) ..
. . .. ...
mN,1(t) · · · mN,N(t) ⎤
⎦. (1)
Here,mi,j(t) is the response received by the ith antenna when the jth antenna transmits, expressed as
mi,j(t) = P
p=1
sp,j(t)∗gi,p(t), (2)
where ∗ denotes the convolution; gi,p(t) represents the Green’s function between the pth scatterer and ith antenna; and sp,j(t) represents the response of the pth scatterer due to the pulse transmitted from thejthantenna. If thepthscatterer is a passive nonlinear target,s
p,j(t) can be represented with a power series as
sp,j(t) = ∞
k=1
ck[f(t)∗gp,j(t)]k, (3)
where f(t) is the transmit pulse, and gp,j(t) represents the Green’s function between the pth scatterer and ith antenna. Even for a linear scatterer, Eq. (3) can be used to represent the scattered response, withk= 1 being the only non-zero term in the series.
For a practical harmonic detection, the fundamental band is suppressed with a high-pass or band-pass filter in order to receive higher order harmonics whose amplitude is typically smaller by orders of magnitude. However, in a case where the transmit pulse is wideband and there exists an overlap between the fundamental and harmonic bands, a filter alone may not accurately extract the harmonic responses. Furthermore, there may be a significant response from antenna ringing or inter-element coupling present at the time when harmonic responses are received and which may overwhelm harmonic responses, especially at short detection range. These issues may be resolved by applying PI to M(t) prior to the DORT processing.
PI uses two transmit pulses that are identically shaped aside from being opposite in polarity, i.e., f−(t) =−f+(t), thereby producing a set ofm+i,j(t) andm−i,j(t). The sum of these two responses is
msi,j(t) =m+i,j(t) +m−i,j(t) = P p=1 ∞ k=0
2c2(k+1)f+(t)∗gp,j(t) 2(k+1)
∗gi,p(t), (4)
where the odd-ordered harmonics (including the fundamental) are eliminated while the even-ordered harmonics are enhanced by a factor of 2.
DORT is then applied to the frequency domain multistatic response matrixMs(ω). First, the time reversal operator (TRO) is defined as
where the Hermitian conjugate † is identical to time reversal in the frequency domain. The TRO matrixT(ω) is self-adjoint since it is the product of a matrix and its Hermitian conjugate. Therefore, the eigendecomposition could be done by applying the singular value decomposition of Ms†(ω) and
Ms(ω) where they can be expressed as
Ms(ω) =U(ω)Σ(ω)V†(ω) and Ms†(ω) =V(ω)Σ†(ω)U†(ω), (6) thereby resulting in the eigendecomposition of T(ω), i.e.,
T(ω) =V(ω)Λ(ω)V†(ω), (7)
where Λ(ω) = Σ†(ω)Σ(ω) is a diagonal matrix, with its elements representing the eigenvalues of
T(ω) (i.e., λi(ω) =σ2
i(ω)). Each eigenvalue should represent each resolved target in the interrogated environment. Relating Eqs. (5) and (7), we see that each column in V(ω) represents the phase-conjugated Green’s functions between the array elements and the corresponding target. For DORT applied to Ms(ω) after PI, the eigenvalue λi(ω) should only be associated with nonlinear targets and contain nonzero magnitude in the even-ordered harmonic frequency bands.
Selective focusing (beamforming) on a target of interest can be done by generating a set of signals using the singular value σi(ω) and the associated eigenvector vi(ω), which represents the phase conjugated (time-reversed) Green’s functions between the array elements and theith target, such that the signals to be fed into the array at a frequencyω are
ki(ω) =σi(ω)vi(ω). (8)
In this paper, the utility of PI-DORT for nonlinear targets is verified by reporting on three-dimensional experiments in which the measured results show that nonlinear targets can be detected and separated to permit selective focusing.
3. EXPERIMENTAL SETUP
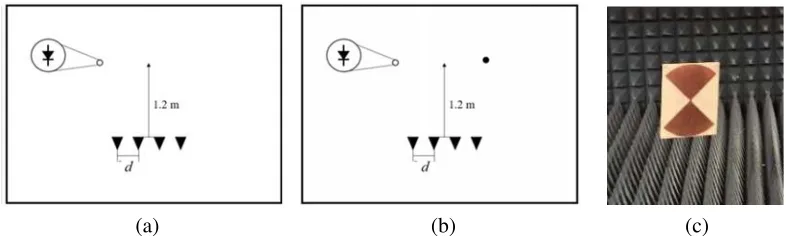
An experiment consisting of a four-element antenna array to measure multistatic responses is set up in an anechoic chamber. Measurements are made with two representative cases of target configurations, namely a) single nonlinear scatterer, and b) a linear scatter and a nonlinear scatterer, as illustrated in Figure 1.
(b)
(a) (c)
Figure 1. Two target configurations tested: (a) single nonlinear target and (b) a nonlinear and linear target, and a bow-tie shaped target used in the experiment for both linear and nonlinear targets.
Since the purpose here is an experimental demonstration of the feasibility of PI-DORT for nonlinear detection, a scatterer of the same geometry is used for both linear and nonlinear targets. A planar bow-tie shaped scatterer is used to represent both linear and nonlinear targets with the nonlinear target including a Schottky diode with a low turn-on voltage (HSMS-2862) that terminates the gap at the center of the bow-tie as illustrated in Figure 1(c). The bow-tie scatterer, due to its wideband nature, ensures sufficient scattering for both the fundamental and harmonic frequencies.
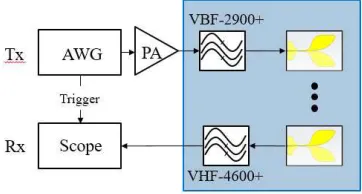
On the receive end, a high-pass filter is connected to one of the antennas in the array with a passband frequency of 4.6 GHz (Mini-Circuits VHF-4600+) to filter out the fundamental response from the signal fed into a high-speed oscilloscope. A diagram of the experimental apparatus is shown in Figure 2. To obtain a complete set of multistatic responses (i.e., M(t) in Eq. (1)), the transmit and receive procedure is repeated manually for all monostatic and bistatic pairs.
Figure 2. Block diagram for PI-DORT experiment on transmit and receive ends.
4. RESULTS
4.1. Single Nonlinear Target
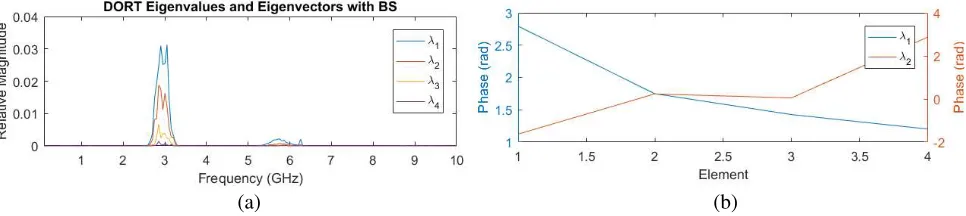
For a single nonlinear target, two different target locations were considered, the first being the center of the cross-range and second being a location off-center to the left. For both locations, the down-range distance is 1.2 m, and the antenna spacing d is 30 cm. Figure 3(a) shows the eigenvalues generated from PI-DORT of the target at the center, where a dominant eigenvalue (λ1) in the second harmonic band is observed, which should correspond to the nonlinear scatter. As a result of PI, the fundamental band is canceled out and does not appear in the eigenvalues. The phase of the first two eigenvectors at 5.8 GHz are plotted in Figure 3(a), where the concave shape of the phase of the first eigenvector indicates thatλ1is associated with the nonlinear target located at the center. The second eigenvalueλ2 also has nonzero values (although small), but the phase plot of its associated eigenvector indicates an off-centered direction, implying thatλ2 may be due to the harmonic response reflected off the chamber
(b) (a)
(b) (a)
Figure 4. Eigenvalues and eigenvectors obtained after PI-DORT for a single off-centered nonlinear target: (a) eigenvalues and (b) phase of the first two eigenvectors at 5.8 GHz.
wall. Part ofλ2may also represent other modes introduced in the nonlinear target due to its geometrical extent.
In Figure 4(a), the eigenvalues generated from PI-DORT of the off-centered target are plotted. Similar to the case of the target at center, a dominant eigenvalue (λ1) in the second harmonic band is observed corresponding to the nonlinear scatter, along with the second eigenvalue (λ2) significantly smaller in magnitude. Again possible explanations for multiple nonzero eigenvalues are reflections off the walls and multiple modes due to the extent of the target. Unlike the first case, the fundamental band is significantly suppressed, but there is no complete canceling, likely due to jitter from the AWG betweenf+(t) andf−(t) and error in receiving the multistatic responses, which may vary between each round of measurements. That being said, the fundamental band is sufficiently suppressed to allow the harmonic band to be discerned. The eigenvector associated with λ1 plotted in Figure 4(b) indicates that the target is located towards the left side of the array.
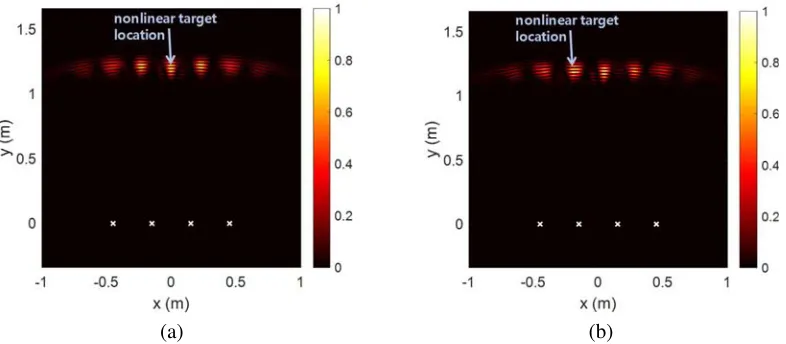
Using the signals obtained from the extracted eigenvectors, selective focusing is demonstrated with numerical simulation. Utilizing SEMCAD X [12], a model consisting of the same array configuration as that used in the measurement is simulated. The signals are generated based on Eq. (8) with the center frequency of 5.8 GHz (second harmonic) and a Gaussian envelope corresponding to a bandwidth of 1 GHz (1ns pulsewidth). Figures 5(a) and 5(b), respectively, show the electric field intensity for the centered and off-centered nonlinear target locations, at a single instance of time. For both cases,
(b) (a)
focusing occurs at the target location (marked with a circle), indicating that the extracted eigenvalue and its eigenvectors correctly represent the nonlinear target. However, a few other spots with high field intensity are observed, which are related to grating lobes as a result of antenna spacing greater than half a wavelength. Grating lobes may be reduced by decreasing the element spacing or by increasing the bandwidth (shorter pulse) of transmitted signals.
4.2. One Linear and One Nonlinear Target
The second configuration includes one nonlinear and one linear target. Both targets are placed 1.2 m in down-range, with the nonlinear target placed off-center to the left and the linear target off-center to the right, as illustrated in Figure 1(b). In this configuration, antenna spacing is reduced to 5 cm in an effort to reduce grating lobes. Since PI is supposed to suppress the scattered responses from linear targets in the fundamental band, we first applied DORT without PI in order to show that the eigenvalues in the fundamental band are associated with the linear target. In this process, background subtraction (which is accomplished by subtracting the multistatic responses without any targets placed) is applied to remove any inter-element coupling that dwarfs the target responses. In Figure 6(a), the eigenvalues generated from DORT without PI (i.e., using background subtraction only) are plotted. Since PI is not applied here, the fundamental band is not suppressed at all, and two dominant eigenvalues appear in the fundamental band. Here, λ1 and λ2, respectively, correspond to the linear and nonlinear targets. The phase plots of the associated eigenvectors in Figure 6(b), where the phase of the first and second eigenvectors are tilted in opposite directions, correctly indicate the direction of the linear and nonlinear target locations, each of which are off-center but in directions opposite from one other. There is a slight amount of λ1 in the second harmonic band, which is much smaller compared to the fundamental band. Furthermore, the nonzero value in the second harmonic band exists for λ1, notλ2, whenλ2 should be associated with the nonlinear target. This is because DORT is processed at discrete frequency points without any information of the eigenvalues decomposed at other frequency bands, which allows the strongest scatter at that frequency point to be the first eigenvalue. In this case, since the linear target is a stronger scatterer due to its closer distance, it appears as the strongest eigenvalue in the fundamental band. However, in the second harmonic band the nonlinear target is a stronger scatterer, therefore it appears as the first eigenvalue. Such ‘mixing’ of eigenvalues can be corrected by correlating adjacent frequency points when applying DORT over a range of frequencies [13].
(b) (a)
Figure 6. Eigenvalues and eigenvectors obtained after DORT (without PI) for the case of one linear and one nonlinear target: (a) eigenvalues and (b) phase of the first two eigenvalues at 2.9 GHz.
Figure 7(a) shows the eigenvalues generated from PI-DORT for the same configuration. Here, one can see a significant amount ofλ1 in the second harmonic band, and the phase plot of the corresponding eigenvector (Figure 7(b)) indicates that λ1 is associated with the nonlinear target. It is also apparent that λ1 in the fundamental band is not completely suppressed, which can be attributed to the jitter between the positive and negative pulses. However, the fundamental band is suppressed sufficiently enough for the 2nd harmonic band to be visible and to allow the nonlinear scatterer to be detected.
(b) (a)
Figure 7. Eigenvalues and eigenvectors obtained after PI-DORT for the case of one linear and one nonlinear target: (a) eigenvalues and (b) phase of the first two eigenvalues at 5.8 GHz.
(b) (a)
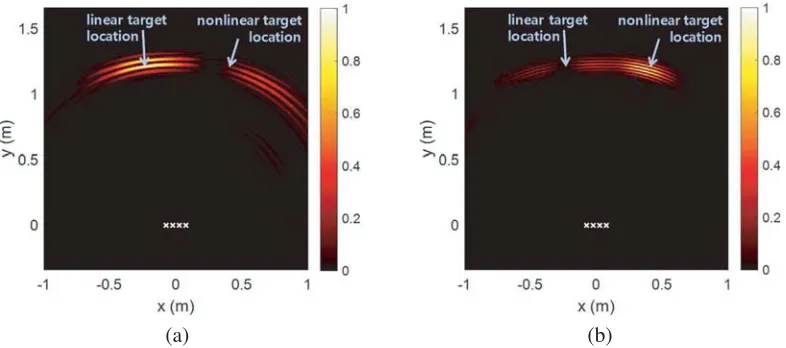
Figure 8. Wave focusing results using (a) eigenvector 1 (linear target) at 2.9 GHz and (b) eigenvector 2 (nonlinear target) at 5.8 GHz. The color bar indicates normalized field intensity. The cross marks indicate the location of antenna elements and the arrows indicate the location of linear and nonlinear targets.
nonlinear target, the signals are generated with the center frequency of 5.8 GHz (second harmonic), both with a Gaussian envelope corresponding to a bandwidth of 1 GHz (1 ns pulse width). The electric field intensity for the case of linear and nonlinear target are plotted in Figures 8(a) and 8(b), respectively. For both cases, wave focusing at the respective target locations (marked with a circle) occur, indicating that the extracted eigenvalue and its eigenvectors correctly represent the nonlinear target. Also, no significant grating lobes are present in this configuration due to smaller element spacing.
5. CONCLUSION
ACKNOWLEDGMENT
This work was supported in part by a National Research Foundation of Korea (NRF) grant funded by the Korea government (Ministry of Science & ICT) (No. NRF-2017R1C1B5018179).
REFERENCES
1. Riley, J., A. Smith, D. Reynolds, A. Edwards, J. Osborne, I. Williams, N. Carreck, and G. Poppy, “Tracking bees with harmonic radar,” Nature, Vol. 379, 29–30, Jan. 1996.
2. Lovei, G., I. Stringer, C. Devine, and M. Cartellieri, “Harmonic radar — A method using inexpensive tags to study invertebrate movement on land,”New Zealand Journal of Ecology, Vol. 21, No. 2, 187–193, 1997.
3. Colpitts, B. and G. Boiteau, “Harmonic radar transceiver design: Miniature tags for insect tracking,”IEEE Transactions on Antennas and Propagation, Vol. 52, No. 11, 2825–2832, Nov. 2004. 4. Federico, A. and L. Roseli, “Theory of zero-power RFID sensors based on harmonic generation and orthogonally polarized antennas,”Progress In Electromagnetics Research, Vol. 134, 337–357, 2013. 5. Mazzaro, G., K. A. Gallagher, A. R. Owens, K. D. Sherbondy, and R. M. Narayanan, “Ultrawideband harmonic radar for locating radio-frequency electronics,” ARL Technical Report, ARL-TR-7256, Mar. 2015.
6. Huang, H., P.-Y. Chen, C.-H. Hung, R. Gharpurey, and D. Akinwande, “A zero power harmonic transponder sensor for ubiquitous wirelessμL liquid-volume monitoring,”Scientific Reports, Vol. 6, No. 18795, 1–4, Jan. 2016.
7. Faia, J. M., K. W. McClintick, and S. K. Hong, “Application of DORT and pulse inversion to detection and selective focusing on nonlinear elements,” 32nd General Assembly & Scientific Symposium of the International Union of Radio Science (URSI-GASS), 2017.
8. Prada, C., S. Manneville, D. S. Poliansky, and M. Fink, “Decomposition of the time reversal operator: Detection and selective focusing on two scatterers,” Journal of Acoustical Society of America, Vol. 4, No. 99, 2067–2076, 1996.
9. Yavuz, M. E. and F. L. Teixeira, “Full time-domain DORT for ultrawideband electromagnetic fields in dispersive, random inhomogeneous media,” IEEE Transactions on Antennas and Propagation, Vol. 8, No. 54, 2305–2315, 2006.
10. Leighton, T. G., G. H. Chua, P. R. White, K. F. Tong, H. D. Giffiths, and D. J. Daniels, “Radar clutter suppression and target discrimination using twin inverted pulses,”Proceedings of the Royal Society A, Vol. 469, No. 2160, 2013.
11. Hong, S. K., V. Mendez, T. Koch, W. Wall, and S. Anlage, “Nonlinear electromagnetic time-reversal in an open semireverberant system,” Physical Review Applied, Vol. 2, No. 044013, Oct. 2014. 12. SEMCAD X. EM simulation platform. Available from:
https://speag.swiss/products/semcad/solu-tions.