Electronic Thesis and Dissertation Repository
January 2016
Copper Indium Sulfide Quantum Dots for Light Selective
Copper Indium Sulfide Quantum Dots for Light Selective
Nanocomposite Thin Films and Solar Cell Applications
Nanocomposite Thin Films and Solar Cell Applications
Harrison Ward
The University of Western Ontario
Supervisor
Dr. Paul Charpentier
The University of Western Ontario
Graduate Program in Chemical and Biochemical Engineering
A thesis submitted in partial fulfillment of the requirements for the degree in Master of Engineering Science
© Harrison Ward 2016
Follow this and additional works at: https://ir.lib.uwo.ca/etd
Part of the Chemical Engineering Commons
Recommended Citation Recommended Citation
Ward, Harrison, "Copper Indium Sulfide Quantum Dots for Light Selective Nanocomposite Thin Films and Solar Cell Applications" (2016). Electronic Thesis and Dissertation Repository. 3474.
https://ir.lib.uwo.ca/etd/3474
This Dissertation/Thesis is brought to you for free and open access by Scholarship@Western. It has been accepted for inclusion in Electronic Thesis and Dissertation Repository by an authorized administrator of
i
Abstract
Nanotechnology is allowing the solar energy industry to advance at an accelerating rate, although new materials and processes are required for developing new types of solar cells. Similar to other industries, it is desirable to develop the most environmentally friendly and cost-effective solutions on how to make these next generation materials. Of these new materials, quantum dots (QDs) are of current scientific interest which provide record-breaking increases in efficiency and a new approach for harnessing solar radiation. However, most previous QD work has focused on lead or cadmium based materials, which are not earth friendly and have low thresholds in both California and European legislation. For this reason, this work examines the earth friendly and abundant materials Copper Indium Sulfide (CIS) QDs, i.e. CIS-QDs, which have favorable emission
properties. These materials were prepared and examined for use in solar harvesting in photovoltaic (PV) devices.
Copper Indium Sulfide (CIS) QDs were synthesized using three different synthesis techniques, then compared based on their optical and size-dependent properties. Two techniques followed a hydrothermal batch reaction process, referred to as hot injection (HI) and heat up (HU) techniques, that are differentiated by the time at which the sulfur component is added to the reaction medium. The third technique was based on a
continuous microfluidic approach. Results showed that the QDs produced from the HU and HI methods have a chalcopyrite structure, with their optical properties being highly dependent on their size and elemental composition. QDs produced from the microfluidic approach were found to agglomerate quickly and had a resulting weak photoluminescent response.
ii
generation solar cell configurations. Based on the optimal configuration, QD sensitized solar cells were fabricated and tested. Resulting current-voltage (IV) curves and solar cell data showed a direct relation between QD composition and cell efficiency.
Key Words: light conversion, ethylene-vinyl acetate, quantum dots, quantum dot solar cells
Acknowledgments
First and foremost I would like to thank my supervising professor, Dr. Paul Charpentier for his continuous guidance and support throughout the duration of my thesis project. I would also like to thank Dr. Wei Wu, Qasem Al-Sharari, Md. Abdul Mumin,
ZakirHossain, and Anastasia Pasche for helping me with different synthesis and
iii
TABLE OF CONTENTS
ABSTRACT ... I ACKNOWLEDGMENTS ... II LIST OF TABLES ... IV LIST OF FIGURES ... V LIST OF ABBREVIATIONS ... VII NOMENCLATURE ... VIII
CHAPTER 1: LITERATURE REVIEW ... 1
INTRODUCTION:... 1
QUANTUM DOT CLASSIFICATIONS: ... 3
Core Quantum Dots:... 4
Core-Shell Quantum Dots: ... 4
Alloyed Quantum Dots: ... 5
CIS Quantum Dots: ... 6
Magic Quantum Dots: ... 6
QUANTUM DOT APPLICATIONS: ... 6
QUANTUM DOT PHOTOVOLTAICS ... 9
OBJECTIVES: ... 16
BIBLIOGRAPHY ... 17
CHAPTER 2: SYNTHESIS OF COPPER INDIUM SULFIDE QUANTUM DOTS FOR USE IN QUANTUM DOT SENSITIZED SOLAR CELLS ... 21
ABSTRACT: ... 21
INTRODUCTION:... 22
EXPERIMENTAL SECTION: ... 24
Materials: ... 24
Heat-Up Synthesis Method: ... 25
Hot-Injection Synthesis Method: ... 25
Microfluidic Synthesis Method: ... 26
QDSSCASSEMBLY: ... 27
Cell Fabrication: ... 27
ZnS Passivating Layer: ... 28
Characterization Methods: ... 28
RESULTS AND DISCUSSION: ... 30
Transmission Electron Microscopy: ... 31
Energy-dispersive X-ray Spectroscopy: ... 35
X-ray Photoelectron Spectroscopy: ... 36
Fourier Transform Infrared Spectroscopy: ... 40
X-ray Diffraction: ... 40
UV-Visible Spectroscopy and Photoluminescence Spectroscopy: ... 41
Quantum Yield: ... 44
Quantum Dot Solar Cells: ... 47
iv
BIBLIOGRAPHY ... 49
CHAPTER 3: NANOCOMPOSITE THIN-FILMS FOR DOWN-CONVERSION APPLICATION ... 53
ABSTRACT: ... 53
INTRODUCTION:... 54
Down-Conversion for Solar Cells: ... 55
Down-Conversion for Greenhouses: ... 57
Quantum Dot Emission Spectrum Modification: ... 57
EXPERIMENTAL SECTION: ... 58
Quantum Dot Synthesis: ... 58
Materials: ... 58
Methods: ... 58
Nanocomposite Thin-Film Fabrication: ... 59
Methods: ... 59
Characterization Methods: ... 60
RESULTS AND DISCUSSION: ... 61
Quantum Dot Samples: ... 61
Energy-dispersive X-ray Spectroscopy: ... 62
X-ray Photoelectron Spectroscopy: ... 64
X-ray Diffraction: ... 68
Photoluminescence Spectroscopy: ... 68
Nanocomposite Thin-Film Samples: ... 70
UV-Visible Spectroscopy: ... 71
Scanning Electron Microscopy: ... 74
Potential Efficiency Increases for Silicon Solar Cells ... 75
CONCLUSION: ... 76
BIBLIOGRAPHY ... 77
CONCLUSION: ... 79
FUTURE WORK: ... 80
APPENDIX: ... 81
CURRICULUM VITAE ... 86
LIST OF TABLES
Table 1-1: Record efficiencies of different QD solar cell designs………...9v
Table 1-3: Cost comparison of commercial QDs………...15
Table 2-1: Microfluidic System Parameters………..26
Table 2-2: Summary of HU and HI CIS QD Experiments………31
Table 2-3: CIS QD Size Comparison……….…………33
Table 2-4: Summary of EDX Results for CIS-R1 HU/HI and CIS-R3 HU/HI………….35
Table 2-5: XPS Peak Position Comparison………...39
Table 2-6: Comparison of Sample Photoluminescent Intensities………..43
Table 2-7: QY of CIS QDs from different synthesis methods………...46
Table 2-8: Summary of Experimental CIS QDSSC Performance……….47
Table 3-1: Summary of CIS and ZCIS QD Experiments………...61
Table 3-2: Summary of ZCIS EDX Results………...64
Table 3-3: Molar ratio comparison between precursor solution and final products……..64
Table 3-4: XPS Peak Positions.………. 67
Table 3-5: Summary of ZnO - EVA and CIS-R1-HU - EVA Thin Films……….72
Table 3-6: Summary of CIS-R1-HI - EVA Thin Films……….72
Table 3-7: Summary of CIS-R1-HU - EVA Thin Films Aged 11 Months………73
Table 3-8: Potential efficiency increases from a down-conversion layer for silicon solar cells………76
LIST OF FIGURES
Figure 1-1: Quantum Confinement Effect on Conduction and Valence Band……….1Figure 1-2: Nanotechnology growth in different markets 2009-2015……….2
vi
Figure 1-4: Exciton recombination diagram………5
Figure 1-5: Light Converting Mechanisms………13
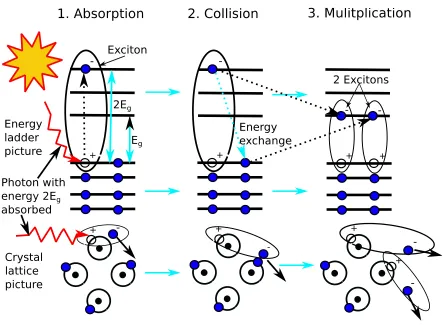
Figure 1-6: Schematic of MEG Mechanism………...14
Figure 1-7: QD Market Growth 2008-2013………...16
Figure 2-1: Reaction schematic for formation of CIS QDs from copper (II) chloride and indium (III) acetate………...……….23
Figure 2-2: Microfluidic Reaction System……….26
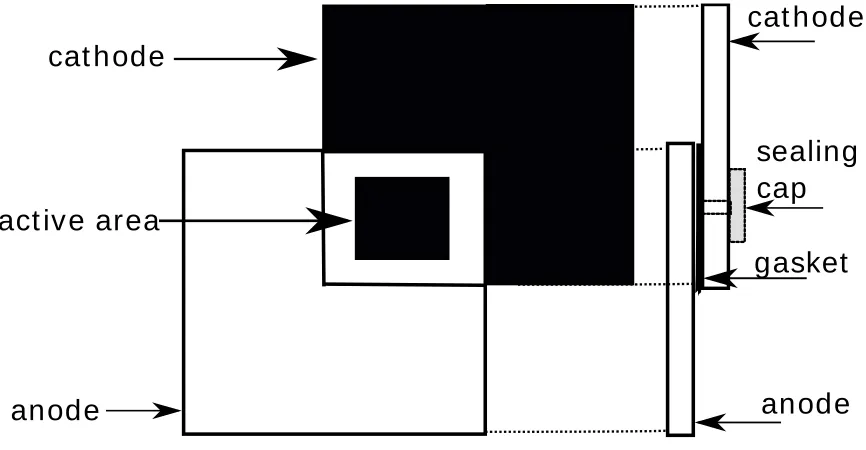
Figure 2-3: Experimental Solar Cell Schematic……….27
Figure 2-4: Experimental CIS QDSSC Design………..28
Figure 2-5: TEM images of CIS R1 HU (a), CIS R1 HI (b), CIS R2 HU (c), CIS R2 HI (d), CIS R3 HU (e), and CIS R3 HI (f)………..32
Figure 2-6: TEM image of CIS R1 HI………...34
Figure 2-7: TEM image of CIS R2 Micro………..34
Figure 2-8: EDX Spectrum of CIS-R3-HI (a), CIS-R3-HU (b), CIS-R1-HI (c), and CIS-R1-HU (d)………35
Figure 2-9: XPS Survey Spectrums of CIS R1 (left) and CIS R2 (right)………..36
Figure 2-10: High Resolution XPS Scans for CIS R1 Peaks……….37
Figure 2-11: High Resolution XPS Scans for CIS R2 Peaks……….38
Figure 2-12: FTIR Absorbance Spectrum of CIS QDs.Figure 2-13: XRD Spectrum of CIS-R2-HU………40
Figure 2-13: XRD Spectrum of CIS-R2-HU………..41
Figure 2-14: Absorbance and Emission Spectrums of CIS QDs. Emission Spectrum of CIS-R2-HU (a), Emission Spectrum of CIS-R2-HI (b), UV-Visible Absorbance Spectrum of CIS-R2-HU (c), and UV-Visible Absorbance Spectrum CIS –R2-HI (d)….42 Figure 2-15: Emission Spectrum of CIS-R2-Micro with 0.1 mL/min flowrate………….43
Figure 2-16: Emission Spectrum of CIS-R2-Micro with 0.5 mL/min flowrate………….43
Figure 2-17: Experimental QY Calibration Curve for Coumarin 153, CIS-R2-HU, and CIS-R2-HI………..45
vii
Figure 3-1: Reaction schematic of forming ZCIS QDs from zinc acetate, copper (II)
chloride, and indium (III) acetate………...59
Figure 3-2: EDX Spectrum of ZCIS R1 60 minute reaction (a), ZCIS R2 60 minute reaction (b), ZCIS R3 60 minute reaction (c), ZCIS R4 60 minute reaction (d), and ZCIS R4-10 minute reaction (e)………..63
Figure 3-3:XPS Survey Spectrum of ZCIS R1………..65
Figure 3-4: High Resolution XPS Scans for ZCIS R1 Peaks………66
Figure 3-5: XRD results for ZCIS QDs with 60 minute reaction time………..68
Figure 3-6: Emission Spectrum of ZCIS QDS with different molar ratios, Zn:Cu:In, and different reaction times, labeled in minutes. ZCIS-R1 (a), ZCIS-R2 (b), ZCIS-R3 (c), and ZCIS-R4 (d)………69
Figure 3-7: ZCIS QDs dispersed in toluene under 365 nm illumination (left) and CIS QDs dispersed in toluene under 365 nm illumination (right)……….70
Figure 3-8: Transmittance Spectrum of 250 μm Zinc Oxide-EVA Thin Films………….71
Figure 3-9: Transmittance Spectrum of 250 μm CIS-R1-HU-EVA Thin Films…………71
Figure 3-10: Transmittance Spectrum of 0.1 wt.% CIS-R1-HI-EVA Thin Films……….73
Figure 3-11: Transmittance Spectrum of 250 μm, 0.1 wt.% CIS-EVA thin film after fabrication (a) and aged 11 months (b)………..73
Figure 3-12: SEM image 0.1 wt% CIS QD in EVA at 100x mag (a), 1000x mag (b), and 10 000x mag (c). 0.2 wt% CIS QD in EVA at 100x mag (d), 1000x mag (e), and 10 000x mag (f). 0.5 wt% CIS QD in EVA at 100x mag (g), 1000x mag (h), and 10 000x mag (i)………75
LIST OF ABBREVIATIONS
viii
EVA ethylene-vinyl acetate copolymer FTO fluorine-doped tin oxide
FWHM full width at half maximum HI hot-injection
HU heat-up
ITO indium tin oxide ODE 1-octadecene QD quantum dot QY quantum yield (%) SD standard deviation
SILAR successive ionic layer absorption and reaction TEM transmission electron microscopy
UV ultra-violet
NOMENCLATURE
A integrated photoluminescent area e- electron
Eg band gap
D quantum dot diameter (nm) DB quantum dot bohr radius
ix
h+ hole
hv light (photon) hvexc excitation light
hvpl emission (photoluminescence) light
Krad energy released from electron transition to k-shell
CHAPTER 1: LITERATURE REVIEW
Introduction:
Nanotechnology is a rapidly growing field attracting intense interest across multiple science and engineering disciplines. It has tremendous potential in applications including solar, medical, and various electronic devices (Research 2008, BCC-Research 2014). Nanotechnology refers to the ability to engineer materials and devices at an atomic scale, typically working with dimensions in the range of 1-100 nm.
Advancements in material synthesis techniques and characterization devices has allowed researchers to gain new insight into what is possible using the tools of nanotechnology.
A nanomaterial is defined as any material with at least one dimension limited to the nano–scale, typically less than 100 nm. There are three distinct classifications of nanomaterials: nanosheets, nanorods, and nanodots (W.G.J.H.M. van Sark 2012). A
nanosheet is a material with one dimension in the nano-scale, an example being graphene. A nanorod is a material with two quantized dimensions, such as carbon nanotubes, while nanodots, also referred to as quantum dots (QDs), are quantum confined in all three dimensions. Quantum confinement occurs when the diameter of a particle, referred to as ‘D’ in Figure 1-1, reaches a size smaller than the Bohr radius, DB, of that material. This
causes the energy levels of the material to split, leading to highly tunable electronic and optical properties(W.G.J.H.M. van Sark 2012).
Figure 1-1: Quantum Confinement Effect on Conduction and Valence Band(W.G.J.H.M. van Sark
All three classifications of nanomaterials have their role in various branches of nanotechnology. QDs are known for their unique ability to selectively convert light energy to different wavelengths, a highly researched process in the solar energy industry (Kamat, 2013).
The start of nanotechnology began in the 1980s with scientists observing
molecules at a nano-scale (United States National Nanotechnology Initiative, 2015). The global market for nanomaterials is expected to grow to $64.2 billion by 2019(BCC-Research 2014). The vast majority of this market includes nanoparticles and nano-scale thin films, which accounted for nearly 80% of the nanotechnology market in 2013. From Figure 1-2 it can be seen that solar energy and optoelectronics are experiencing the most rapid growth in recent years. Furthermore, as the population continues to rise, especially in developing countries, global demand for renewable energy will continue to grow, driving the development of new solar energy harvesting technologies.
Quantum Dot Classifications:
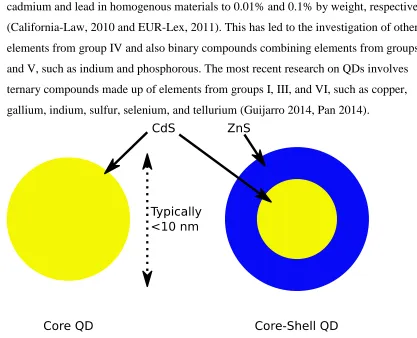
Quantum dots (QDs) can be organized into three classifications, i.e. core, core-shell, and alloyed QDs (Sigma-Aldrich, 2015). Different materials are used to produce QDs in each of these categories, each with distinct advantages depending on the end-use application. The most commonly used materials for QDs are metal chalcogenides, specifically metal sulfides, selenides, and tellurides. QDs made from elements in groups II-VI and IV-VI, specifically those cadmium and lead based, have attracted the most interest (Kamat 2013, Stolle 2013, Kramer 2014). However any products containing cadmium or lead are hindered by environmental regulations and are not generally accepted by the public. The European Union and California law both restrict the use of cadmium and lead in homogenous materials to 0.01% and 0.1% by weight, respectively (California-Law, 2010 and EUR-Lex, 2011). This has led to the investigation of other elements from group IV and also binary compounds combining elements from groups III and V, such as indium and phosphorous. The most recent research on QDs involves ternary compounds made up of elements from groups I, III, and VI, such as copper, gallium, indium, sulfur, selenium, and tellurium (Guijarro 2014, Pan 2014).
Core Quantum Dots:
The most basic type of QD is referred to as a core QD. Core QDs have a uniform composition and typically consist of two different elements with common examples of core QDs being: CdS, CdSe, CdTe, ZnS, ZnO, PbS, and PbSe. Although these QDs suffer from limited functionality, they are easily tuned by varying their particle sizes (Semonin, Luther et al. 2012, Kamat 2013, Sargent 2013). Cadmium based QDs primarily absorb light in the UV region, while their emission can be tuned across the visible spectrum (Kongkanand, Tvrdy et al. 2008, Lin, Chen et al. 2012). Lead based QDs absorb light from the UV, visible, and near infrared parts of the electromagnetic spectrum. They can be tuned to emit light in the near infrared and infrared parts of the spectrum (Ma, Swisher et al. 2011, Beard, Luther et al. 2013). A strong absorption of light across the majority of the electromagnetic spectrum is attracting researchers’ interest for developing solar cells utilizing lead based QDs as the primary absorbing layer (Kramer and Sargent 2014). However, protecting the surrounding environment from exposure to lead remains a current concern, with more environmentally responsible choices necessary.
Core-Shell Quantum Dots:
maximize effective electron-hole recombination, a process described in Figure 1-4 below.
Figure 1-4: Exciton recombination diagram(G. Ledoux 2001).
The effectiveness of a QDs ability to absorb and emit light is their most important feature, which can be quantified by the quantum yield (QY). The QY is defined simply as the ratio of photons emitted to photons absorbed. By coating the QD core material with a different shell material, the QY can be dramatically increased (Sanchez, Binetti et al. 2014).
For QD applications involving light harvesting, it is necessary to position the conduction and valence bands of the core and shell material such that the generated holes remain quantum confined in the core, while electrons remain quantum confined in the shell. This forces the charge carriers to cross the core-shell boundary in order to emit photons, making the process easily tunable by carefully selecting the band gap offset between the individual core and shell materials. To satisfy these conditions, the shell typically requires a higher band gap material than the core (Sanchez, Binetti et al. 2014).
Alloyed Quantum Dots:
difficulty, researchers have created alloyed QDs, which are mostly different combinations of the common materials used to produce core and core-shell QDs. Furthermore, the properties of alloyed QDs are distinct from both of their bulk materials and both of their parent semiconductors (Kamat 2013).
CIS Quantum Dots:
Copper-Indium Sulfide (CIS) QDs were chosen in this work for use in QD solar
cells and down-conversion because of their relatively low toxicity compared to Cd and Pb, high absorption coefficients, and widely tunable emission wavelength range
(McDaniel 2013, Yu 2013). CIS QDs are compatible with a variety of surface ligands and have shown promising results in a variety of applications, including solar, LEDs, and bio-imaging (Song 2012, Yu 2013,Guijarro 2014, and Pan 2014).
Magic Quantum Dots:
QD synthesis typically consists of two main steps, nucleation followed by growth, which causes the products to have a rather broad size distribution. However some
researchers have been able to stop the growth process immediately after nucleation. The resulting QDs exhibit highly precise properties and are referred to as magic-sized QDs (Yu, 2010). These QDs are single sized and only exhibit homogenous spectra broadening (Yu, 2010).
Quantum Dot Applications:
The potential applications for QDs continue to grow as new discoveries are made. From Figure 1-2, the current areas of application for QDs can be divided into six
security industry using QD technology mostly for counterfeit applications(BCC-Research 2014). The industry of solar energy utilizing QDs has shown significant growth in recent years and will be an essential requirement to support the growing population’s energy
demands (BCC-Research 2008, Kamat 2013). This thesis investigates the synthesis of CIS QDs and their application for solar energy harvesting.
Fabrication Methods:
There are a variety of synthesis techniques used to produce QDs. The majority are based on a hydrothermal route, which involves heating up a solution of precursor
compounds, organic surfactants, and a solvent. Upon heating, the precursors decompose, forming monomers that initiate crystal growth. The QDs are allowed to grow for a specific amount of time, after which they precipitate from solution. This is traditionally done using either a solvent or anti-solvent wash and then centrifugation in which the QDs are separated from the solvents and reactants by centrifugal force. Recently, new
separation techniques have been explored such as using gas-expanded liquids to precipitate the QDs from dispersion(McLeod, Anand et al. 2005). Once the QDs have been recovered, it is then necessary to process them into thin films for use in the end-use application of interest, e.g. photovoltaics. Film deposition is an area attracting significant interest, and is paramount in producing high efficiency solar cells. There are a number of film deposition techniques used today including drop casting or spin coating, chemical bath, successive ionic layer absorption and reaction, electrophoretic deposition, and the use of a molecular linker (Kamat 2013).
bath approaches, the QD loading is achieved directly onto the metal oxide support, which is most commonly TiO2. Here the obtained loading is typically higher than that achieved
when producing films with pre-synthesized QDs. However recent results from H. Zhang et al. showed 34% coverage of CdSe QDs on TiO2 films using a molecular linker method
(H. Zhang 2012). This value is the highest reported among quantum dot sensitized solar cells (QDSSCs), with typical values being in the range of 14-20%(H. Zhang 2012). Pre-synthesized QDs typically have higher quality and higher QY, and can be easily tuned for specific requirements.
Solar Cell Classifications:
cells (DSSC), perovskite cells, and QD cells. The latter of which is increasing in efficiency at the highest rate amongstst all photovoltaic technologies(NREL, 2014).
Quantum Dot Photovoltaics
There are a number of different approaches to producing solar cells using QDs (Kramer and Sargent 2014). These can be divided into three categories, solid-state heterojunction cells, liquid junction cells, and polymer-QD hybrid cells. Solid-state heterojunction cells can utilize multiple layers of QDs, with each layer capable of
absorbing an additional part of the sun’s spectrum. This makes them the leading candidate
for reaching the highest possible efficiencies. Solid-state cells also avoid degradation from a liquid electrolyte that is used in liquid-junction QD solar cells. Liquid-junction and QD-polymer hybrids have advantages also relating to their structure, processability, and cost (Hines 2014, Lan 2014). QDs can also manipulate solar energy by being combined with traditional silicon-based devices. This is referred to as up and down-conversion.
The architecture of QD solar cells is constantly evolving with new innovations and technologies. The three main categories of QD solar cells: solid-state heterojunction cells, liquid junction cells, and polymer-QD hybrid cells; each have different cell
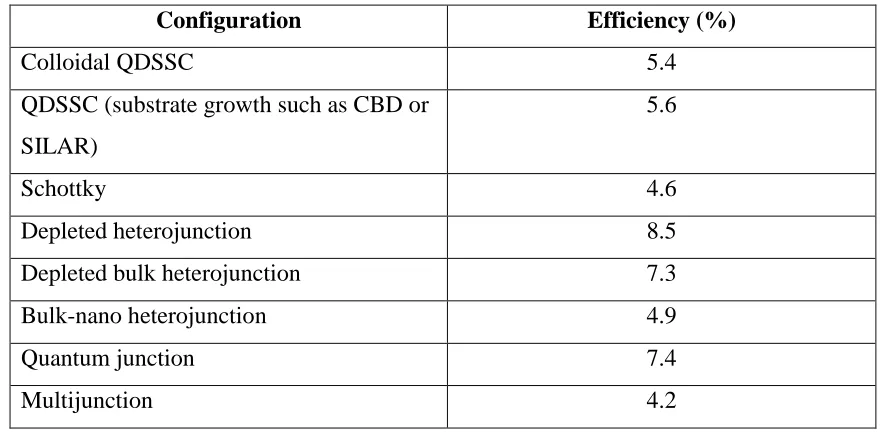
architectures and can be broken down into nine groups. The record efficiency for each classification can be seen below in Table 1-1.
Table 1-1: Record efficiencies of different QD solar cell designs(Kramer and Sargent 2014).
Configuration Efficiency (%)
Colloidal QDSSC 5.4
QDSSC (substrate growth such as CBD or SILAR)
5.6
Schottky 4.6
Depleted heterojunction 8.5
Depleted bulk heterojunction 7.3
Bulk-nano heterojunction 4.9
Quantum junction 7.4
Colloidal Quantum Dot Sensitized Solar Cell:
This type of configuration is very similar to a dye-sensitized solar cell with the dye being replaced by colloidal QDs. The first time a solar cell of this nature was reported was in 1998 utilizing InP QDs as sensitizers (Zaban, 1998). This type of cell includes a monolayer coating of colloidal QDs over a transparent, nanoporous electron acceptor like TiO2 or ZnO. This interface is then permeated with a liquid electrolyte, commonly an
organic polysulfide, for hole collection. A primary challenge with these types of solar cells is achieving continuous, monolayer coverage of the entire nanoporous electron acceptor. This can be attributed to the colloidal QD diameter being much larger than the nanoporous TiO2 pore diameter. Poor coverage of the electron-accepting layer leads to it
coming into direct contact with the hole-transporting electrolyte. This leads to back injection of the charge carriers, which significantly degrades device performance.
In an effort to overcome this issue, researchers are depositing a higher band gap layer, commonly ZnS, overtop of the QD layer to prevent contact with the
electrolyte(Guijarro, Guillen et al. 2014). An alternative approach involves sensitizing solution stable TiO2 nanoparticles with the QDs prior to film deposition of the QD – TiO2
nanostructure. Although efficiencies of greater than 5% have been successfully demonstrated with this approach, using a chemical bath deposition or SILAR method allows for QD synthesis and film deposition to be carried out in a single step (Zhang, 2012). This provides some advantages for QD coverage, but not without sacrificing optical properties and monodispersity(Kramer and Sargent 2014).
The operating principle of a QDSSC is very similar to that of a DSSC. When the QDs absorb a photon with high enough energy, they promote an electron to its conduction band. This electron is then injected into the conduction band of nanoporous TiO2. At the
same time the hole resulting from the electron that was excited to the conduction band of the QDs is transported into the liquid electrolyte, where it undergoes reduction. The electron travelling through the TiO2 passes through the anode and then reenters the cell
Schottky Colloidal Quantum Dot Solar Cell:
These types of cells rely on an electron affinity difference between the top, a transparent conductive oxide, and the back, commonly Mg or Al, contact layers of the cell(Kramer and Sargent 2014). This produces a built-in electric field, which acts as the driving force for extraction of electrons and holes. These cells typically utilize PbS QDs for electron extraction that are blended with an organic polymer, which facilitates hole extraction. The first cell with this architecture was produced in 2005 (McDonald, 2005). After extensive investigation into the polymer’s impact on electrical properties, it was
found to actually hinder hole extraction, compared to the improved hole transport in QDs themselves. By producing these devices without a polymer component, it was confirmed that with an electric field, thin-films consisting of only QDs could effectively separate and transport both electrons and holes. This made Schottky QD solar cells more similar to polycrystalline thin-film cells, with the major advantage of having quantum-tuned band gaps(Kramer and Sargent 2014).
Schottky cells are attractive because of their functional simplicity, ease of
fabrication, excellent potential for mass production using a roll-to-roll process, and good demonstration of the stand-alone ability of QD thin-films (Luther, 2008). These have reached efficiencies greater than 4.5%(Ma, Swisher et al. 2011).
The architecture of a polymer-QD hybrid solar cell is similar to the solid-state heterojunction cell. It consists of conductive and transparent anode layer, commonly ITO or FTO, then the photoactive layer, which is a combination of the polymer material and QDs, and finally the cathode layer, commonly aluminum(Ma, Swisher et al. 2011).
Depleted Heterojunction:
semiconductor is deposited on top, commonly TiO2 or ZnO, which does not have to be
nanoporous. Next the QD active layer is deposited onto the wide band gap semiconductor, with a thickness of 50-300nm(Kramer and Sargent 2014).
Selection of appropriate surface ligands is critical in depleted heterojunction cells in order to achieve the best interfacial contact between the QD active layer and wide band gap semiconductor transport layer. Tuning conduction band offsets is of critical
importance as improperly matched band gaps of two different materials at an interface creates a barrier for electron injection. By carefully controlling the band offsets, efficient charge extraction can occur without a strong electric field (Kramer and Sargent 2014). Optimization of band gap offsets through careful selection of QD size has produced efficiencies as high as 8.5% (Maraghechi, 2013).
Depleted bulk heterojunction, bulk-nano heterojunction, quantum junction, and multijunction cells are all similar to the depleted heterojunction cell in design, with minor differences in the materials used. These types of cells can all be classified as solid-state heterojunction cells.
Down-Conversion:
QDs can also be applied to existing solar cell technologies, primarily silicon based cells, to increase efficiency. One of these concepts is referred to as down-conversion. This is a process during which the QDs convert a portion of the sun’s electromagnetic
Down-conversion refers to the process where a single high-energy photon is converted to multiple lower energy photons. Essentially this process is capable of concentrating the sun’s light spectrum into narrower, high intensity spectrums, with the
tunable emission wavelength dependent on the final application. This also reduces
thermalization loses in first generation solar cells, through a concept referred to a multiple exciton generation (MEG) (NREL 2012). Two similar processes also attracting
researchers’ attention are down shifting, a less efficient form of down-conversion, and up
conversion, the exact opposite process of down-conversion.
Figure 1-5: Light Converting Mechanisms (W.G.J.H.M. van Sark 2012).
MEG is a phenomenon unique to QDs. Traditionally the absorption of a photon causes a single electron to jump from the valence band to the conduction band. If the energy of the photon is higher than that of the absorbing material’s band gap, it is released in the form
Figure 1-6: Schematic of MEG Mechanism (NREL 2012)
Very few reports have been published on these concepts. There have been some studies on the use of rare earth ions for up-conversion and the use of nano-layered zinc oxide as a down-conversion layer (Yao Zhu 2013, SISER 2014). However there are no studies available on the use of CIS QDs as a down converting layer.
Technology Classification:
The seven different QD solar cell configurations discussed above can be organized into three distinct categories.
Table 1-2: QD Solar Cell Classifications
Classification Configurations
Heterojunction, Quantum Junction, and Multijunction
Liquid-Junction QDSSC
QD-Polymer Hybrid Schottky
The majority of researchers working with QDs synthesize them in their own labs, as there are only a few commercial suppliers of QDs. However, the cost for these QDs is
currently very high and varies substantially from supplier to supplier. This is because of the wide variety in quality, composition, manufacturing processes, and geographical location between the suppliers. QDs are a specialty chemical and the only prices available for them are from companies selling them for research purposes. These costs also have to cover the extensive QD product characterization required by the company to insure they provide a consistent, premium product. Large chemical companies are currently pursuing partnerships with companies that have expertise in QD manufacturing at a smaller scale in hopes of gaining control of the emerging commercial market for QDs. This will lead to a significant reduction in cost and more widespread availability.
Table 1-3: Cost comparison of commercial QDs (Crystalplex 2014, Mesolight 2014,
Nanotech 2014, Sigma-Aldrich 2014)
Supplier Cost per 50 mg
Crystalplex $500-700
Mesolight $200-600
Ocean Nanotech $250-900
Sigma Aldrich $500-1000
Future of QD Solar Applications
QDs are allowing for progression of the photovoltaic industry at an impressive rate. The growth rate of investment for QDs used in solar and other applications can be seen in Figure 1-7. As new techniques for improving surface chemistry, interface
energy. Some of the more important areas requiring improvements for economic commercialization are in synthesis techniques such as continuous production using a microfluidic reactor system. Incorporating roll-to-roll processing techniques for QD solar cells will also be critical in achieving commercial feasibility.
Figure 1-7: QD Market Growth 2008-2013(BCC-Research 2008)
OBJECTIVES:
The objectives of this thesis were to:
1. Evaluate available synthesis methods for producing non-cadmium or lead free quantum dots, focusing on copper indium sulfide.
2. Investigate the use of these quantum dots in polymer films for application as a light-selective thin film using downregulation.
Bibliography
1. Barkhouse, D. A. R., Debnath, R., Kramer, I. J., Zhitomirsky, D., Pattantyus-Abraham, A. G., Levina, L., Etgar, L., Grätzel, M. and Sargent, E. H.
“Depleted Bulk Heterojunction Colloidal Quantum Dot Photovoltaics.” Advanced Materials. 2011, 23, 3134.
2. BCC-Research (2008). Quantum Dots: Technical Status and Market Prospects. Wellesley, MA.
3. BCC-Research (2014). Quantum Dots: Global Market Growth and Future Commercial Prospects. London England.
4. Beard, M. C., J. M. Luther, O. E. Semonin and A. J. Nozik (2013). "Third generation photovoltaics based on multiple exciton generation in quantum confined semiconductors." AccChem Res 46(6): 1252-1260.
5. British-Petroleum (2014). BP Energy Outlook 2035. London England. 6. California-Law. (2010). "What are the Maximum Containment Values
(MCVs) for these Metals in Products." from
https://www.dtsc.ca.gov/HazardousWaste/rohs2_MCVs.cfm. 7. Crystalplex. (2014). "Crystalplex Quantum Dots, Semiconductor
Nanocrystals." 2014, from
http://www.crystalplex.com/SearchResults.asp?Cat=1.
8. EUR-Lex (2011). COMMISSION DIRECTIVE 2011/37/EU. EUR-Lex: Access to European Union Law, Official Journal of the European Union. 9. G. Ledoux, O. G., F. Huisken, B. Kohn, D. Porterat and C. Reynaud (2001).
"Crystalline silicon nanoparticles as carriers for the Extended Red Emission." Astronomy and Astrophysics 377: 707-720.
10. Group, W. R. (2012). "Lead-salt Semiconductor Quantum Dots." 2015, from http://wise.research.engineering.cornell.edu/index.html.
11. Guijarro, N., E. Guillen, T. Lana-Villarreal and R. Gomez (2014). "Quantum dot-sensitized solar cells based on directly adsorbed zinc copper indium sulfide colloids." PhysChemChemPhys 16(19): 9115-9122.
12. Gur, I.,Fromer, N., Geier, M., Alivisatos, A. “Air-stable all-inorganic
nanocrystal solar cells processed from solution.” Science. 2005, 310, 462. 13. H. Chung, a. P. H. H. (2007). "Phosphor coatings to enhance Si photovoltaic
cell performance." Journal of Vacuum Science and Technology 25: 61-66. 14. H. Zhang, K. C. (2012). "Efficient CdSe quantum dot-sensitized solar cells
prepared by a postsynthesis assembly approach." Chemical Communication 48: 11235-11237.
15. Hines, D. A. and P. V. Kamat (2014). "Recent advances in quantum dot surface chemistry." ACS Appl Mater Interfaces 6(5): 3041-3057. 16. Kamat, P. V. (2013). "Quantum Dot Solar Cells.The Next Big Thingin
17. Katsuhiro Nose, T. O., and Shinya Otsuka-Yao-Matsuo (2008). "Colloidal Synthesis of Ternary Copper Indium Diselenide Quantum Dots and Their OpticalProperties." Journal of Physical Chemistry 113: 3455-3460.
18. Kongkanand, A., K. Tvrdy, K. Takechi, M. Kuno and P. V. Kamat (2008). "Quantum dot solar cells. Tuning photoresponse through size and shape control of CdSe-TiO2 architecture." J Am ChemSoc 130(12): 4007-4015. 19. Kramer, I. J., Zhitomirsky, D., Bass, J. D., Rice, P. M., Topuria, T., Krupp, L.,
Thon, S. M., Ip, A. H., Debnath, R., Kim, H.-C. and Sargent, E. H. “Ordered Nanopillar Structured Electrodes for Depleted Bulk Heterojunction Colloidal Quantum Dot Solar Cells.” Advanced Materials. 2012, 24, 2315.
20. Kramer, I. J. and E. H. Sargent (2014). "The architecture of colloidal quantum dot solar cells: materials to devices." Chem Rev 114(1): 863-882.
21. Lan, X., S. Masala and E. H. Sargent (2014). "Charge-extraction strategies for colloidal quantum dot photovoltaics." Nat Mater 13(3): 233-240.
22. Leschkies, K., Jacobs, A., Norris, D., Aydil, F. “Nanowire-quantum-dot solar cells and the influence of nanowire length on the charge collection efficiency.” Applied Physics Letters. 2009, 95, 193103.
23. Liu, H., Tang, J., Kramer, I. J., Debnath, R., Koleilat, G. I., Wang, X., Fisher, A., Li, R., Brzozowski, L., Levina, L. and Sargent, E. H. “Electron Acceptor Materials Engineering in Colloidal Quantum Dot Solar Cells.” Advanced Materials. 2011, 23, 3832.
24. Luther, J., Law, M., Beard, M., Song, Q., Reese, M., Ellingson, R. and Nozik, A. “Schottky Solar Cells Based on Colloidal Nanocrystal Films”. Nano Letters. 2008, 8, 3488.
25. Ma, W., S. L. Swisher, T. Ewers, J. Engel, V. E. Ferry, H. A. Atwater and A. P. Alivisatos (2011). "Photovoltaic performance of ultrasmallPbSe quantum dots." ACS Nano 5(10): 8140-8147.
26. Maraghechi, P., A. J. Labelle, A. R. Kirmani, X. Lan, M. M. Adachi, S. M. Thon, S. Hoogland, A. Lee, Z. Ning, A. Fischer, A. Amassian and E. H. Sargent (2013). "The donor-supply electrode enhances performance in colloidal quantum dot solar cells." ACS Nano 7(7): 6111-6116.
27. McDaniel, H., N. Fuke, N. S. Makarov, J. M. Pietryga and V. I. Klimov (2013). "An integrated approach to realizing high-performance liquid-junction quantum dot sensitized solar cells." Nat Commun 4: 2887.
28. McDonald, S., Konstantatos, G., Zhang, S., Cyr, P., Klem, E., Levina, L. and Sargent, E. “Solution-processed PbS quantum dot infrared photodetectors and photovoltaics.” Nature Materials. 2005, 4, 138.
29. McLeod, M. C., M. Anand, C. L. Kitchens and C. B. Roberts (2005). "Precise and rapid size selection and targeted deposition of nanoparticle populations using CO2 gas expanded liquids." Nano Lett 5(3): 461-465.
30. Mesolight. (2014). "Quantum Dot Products." from http://www.mesolight.com/index.php.
31. Nanoco-Group-PLC. (2014). "Quantum Dots manufactured in Bulk Quantities." 2014, from http://www.nanocotechnologies.com/index.aspx. 32. Nanotech, O. (2014). "Products Catalogue ", from
33. Ning, Z., D. Zhitomirsky, V. Adinolfi, B. Sutherland, J. Xu, O. Voznyy, P. Maraghechi, X. Lan, S. Hoogland, Y. Ren and E. H. Sargent (2013). "Graded doping for enhanced colloidal quantum dot photovoltaics." Adv Mater 25(12): 1719-1723.
34. NREL. (2012). "Novel Physical Principles Research Thrust." 2015, from http://www.centerforadvancedsolarphotophysics.org/physical_principles.html. 35. NREL. (2014). "National Center for Photovoltaics." 2015, from
http://www.nrel.gov/ncpv/.
36. Pan, Z., I. Mora-Sero, Q. Shen, H. Zhang, Y. Li, K. Zhao, J. Wang, X. Zhong and J. Bisquert (2014). "High-efficiency "green" quantum dot solar cells." J Am ChemSoc 136(25): 9203-9210.
37. Pattantyus-Abraham, A.,Kramer, I., Barkhouse, A., Wang, X., Konstantatos, G., Debnath, R., Levina, L., Raabe, I., Nazeeruddin, M., Grätzel, M. and Sargent, E. “Depleted-Heterojunction Colloidal Quantum Dot Solar Cells”.
ACS Nano. 2010, 4, 3374.
38. Queisser, W. S. a. H. J. (1961). "Detailed Balance Limit of Efficiency of p‐ n Junction Solar Cells." Journal of Applied Physics 32: 510-519.
39. Sanchez, R. S., E. Binetti, J. A. Torre, G. Garcia-Belmonte, M. Striccoli and I. Mora-Sero (2014). "All solution processed low turn-on voltage near infrared LEDs based on core-shell PbS-CdS quantum dots with inverted device structure." Nanoscale 6(15): 8551-8555.
40. Sargent, G. K. a. E. H. (2013). Colloidal Quantum Dot Optoelectronics and Photovoltaics Cambridge, Cambridge University Press.
41. Semonin, O. E., J. M. Luther and M. C. Beard (2012). "Quantum dots for next-generation photovoltaics." Materials Today 15(11): 508-515.
42. Sigma-Aldrich. (2014). "Quantum Dots - Products." from
http://www.sigmaaldrich.com/materials-science/material-science-products.html?TablePage=16376883.
43. Sigma-Aldrich. (2015). "Quantum Dots." from
http://www.sigmaaldrich.com/materials-science/nanomaterials/quantum-dots.html
44. SISER. (2014). "Up and Down-conversion." from
http://siser.eps.hw.ac.uk/research/next-generation/up-and-down-conversion. 45. Song, W.-S. and H. Yang (2012). "Efficient White-Light-Emitting Diodes
Fabricated from Highly Fluorescent Copper Indium Sulfide Core/Shell Quantum Dots." Chemistry of Materials 24(10): 1961-1967.
46. Stolle, C. J., T. B. Harvey and B. A. Korgel (2013). "Nanocrystal
photovoltaics: a review of recent progress." Current Opinion in Chemical Engineering 2(2): 160-167.
47. Sungwoo Kim, M. K., Seajin Kim, Jin-HyukHeo, Jun Hong Noh, Sang HyukIm, Sang IlSeok, and Sang-Wook Kim (2013). "Fabrication of CuInTe2 and CuInTe2xSex Ternary Gradient Quantum Dots and Their Application to Solar Cells." ACS Nano.
49. W.G.J.H.M. van Sark, A. M. a. R. E. I. S. (2012). Solar Spectrum Conversion for Photovoltaics Using Nanoparticles. Third Generation Photovoltaics. D. V. Fthenakis, INTECH.
50. Yang, J., J. Y. Kim, J. H. Yu, T. Y. Ahn, H. Lee, T. S. Choi, Y. W. Kim, J. Joo, M. J. Ko and T. Hyeon (2013). "Copper-indium-selenide quantum dot-sensitized solar cells." PhysChemChemPhys 15(47): 20517-20525.
51. Yao Zhu, A. A., Bruno Masenelli and Patrice Melinon (2013). "Zinc oxide nanoparticles as luminescent down-shifting layer for solar cells." SPIE. 52. Yu, K., Hu, M., and Wang, R., Piolet, M., Frotey, M., Zaman, M., Wu, X.,
Leek, D., Tao, Y., Wilkinson, D., and Li, C. “Thermodynamic Equilibrium-Driven Formation of Single-Sized Nanocrystals: Reaction Media Tuning CdSe Magic-Sized versus Regular Quantum Dots.” J. Phys. Chem. C, 2010, 114 (8), pp 3329–3339.
53. Zaban, A. M., O. I.; Gregg B. A.; Nozik A. J. (1998). "Photosensitization of Nanoporous TiO2 Electrodes with InP Quantum Dots." Langmuir14 (3153-3156).
54. Zhang, H., Cheng, K. (2012). "Efficient CdSe quantum dot-sensitized solar cells prepared by a postsynthesis assembly approach." Chemical
Communication 48: 11235-11237.
CHAPTER 2: SYNTHESIS OF COPPER INDIUM SULFIDE
QUANTUM DOTS FOR USE IN QUANTUM DOT SENSITIZED
SOLAR CELLS
Abstract:
Third generation solar cells utilize high-performance high-cost nanomaterials, termed quantum dots (QDs), capable of reaching high efficiencies. Specifically QDs can be used in place of organic dyes in a cell configuration similar to that of the well-known dye-sensitized solar cell (DSSC) design. QDs exhibit higher absorption coefficients and increased tunability compared to organic dyes. However most QDs utilize lead or
cadmium, which are not considered earth friendly elements. Copper indium sulfide (CIS) QDs are of interest, but the relationship between structure and properties is unknown.
Introduction:
Quantum Dots (QDs) are quickly emerging as the next major technology in the solar industry (Stolle 2013). They provide unique properties that can be easily
manipulated to suit specific application requirements. QDs were first discovered in the early 1980s and have been attracting a surge of interest related to their application in photovoltaics in the last ten years(Kamat 2013). While group II−VI and IV−VI cadmium- or lead-based QDs have been the focus of greatest interest, other materials such as group I−III−VI semiconductors combining group I (Cu, Ag), group III (Al, Ga, In, Tl), and
group VI (S, Se, Te) elements have been identified as potentially less toxic materials. Products containing cadmium or lead are hindered by environmental regulations, e.g. the European Union and California both restrict the use of cadmium and lead in homogenous materials to 0.01% and 0.1% by weight, respectively (California-Law, 2010 and EUR-Lex, 2011). Considering the quantum confinement effects, QDs of I−III−VI
semiconductors cover a broad range of optical and electronic properties with tunable band gaps covering a wide wavelength range from the near-infrared region, through visible, to the UV region(H. Zhang 2012). This makes CIS QDs an excellent candidate for use in solar applications.
Similar to other renewable technologies, the bottleneck for QD photovoltaics is with the economy of scale involved in their production. The chemistry involved during crystal nucleation is difficult to control, making large-scale production challenging (Chang and Waclawik 2013 and Hines 2013). There have been a number of different techniques used in the literature to synthesize QDs, most of which rely on a hydrothermal reaction of metal salts in a high boiling point solvent. Although this procedure can
produce high quality QDs, it has several drawbacks, including batch mode operation, long residence times, and requires vacuum and/or inert gas for the reaction to take place (Hines and Kamat 2014).
the third is a novel microfluidic synthesis method. The methods most commonly reported in the literature can be organized into two classifications, hot-injection (HI) and heat-up (HU) techniques. Both techniques involve preparing a precursor solution of copper and indium salts in a non-polar solvent, with or without the addition of a surfactant (Yang, Kim et al. 2013, Yu, Ng et al. 2013, PB Kreider 2014). This work provides new insight on the relationship between synthesis methods and the quantum yield and size distribution of QD products. In the case of the HU technique, a sulfur-containing compound is also added to the precursor solution prior to heating (Chang and Waclawik 2013). The reaction solution at room temperature is then heated up under vacuum, to between 180 and 320 oC, which is then maintained for as little as 5 minutes or up to several hours, depending on the other synthesis parameters. The reaction solution is constantly mixed using a
magnetic stir bar set to a moderately high mixing speed. Due to the continuous flow in the microfluidic system, additional mechanical mixing is not required. For the HI technique, the reaction is initiated by injecting the sulfur-containing compound into the reaction solution once it has reached sufficient temperature. The reaction chemistry in this approach is very complex and has still not been thoroughly explained in literature, however, it has been shown that HI methods produce a more narrow size distribution of particles, due to a more constant growth temperature (Kamat 2013 and Sungwoo 2013).
Figure 2-1: Reaction schematic for formation of CIS QDs from copper (II) chloride and indium (III) acetate (Chang and Waclawik 2013).
There are many factors that contribute to the surface chemistry of QDs. The properties of QDs are highly dependent on surface chemistry, making it crucial to control. However this can be difficult because there is still so much unknown on QD chemistry. The KAMAT lab (Kamat 2014) has performed studies showing the effect of washing procedures, quenching time, and storage conditions on QDs (Hines and Kamat 2014). With so many factors able to affect the QD product, it is essential to maintain precise
I
H3C In 3+
O O
[ ]
I3
Cu Cl ClI I
+ Cu2+ In3+
DDT + ODE
CuInS2
Quant um Dot s
Chalcopyrit e Cryst al St ruct ure
conditions during the experiments. Many methods in the literature use highly toxic surfactants such as tri-octylamine. With the goal of this work being to reduce the toxicity of the QDs used, it is also desirable to have a synthesis method using green chemistry. The surfactant used for the majority of this work was 1-dodecanethiol, which is also the sulfur source for the reaction and functional ligand for QD applications.
The optimized QD synthesis procedure used octadecene as the reaction solvent, 1-dodecantethiol as the sulfur source and surface ligand, copper (II) chloride and indium (III) acetate as the precursors. QD synthesis techniques, including precursor ratios used, were adapted from several methods reported in literature(Yang, Kim et al. 2013, Yu, Ng et al. 2013, PB Kreider 2014). Batch synthesis procedures based on HI and HU methods were explored as well as a continuous-flow synthesis approach. The microfluidic reactor allows for an increased rate of heat transfer due to the small diameter and high surface area of the tubing exposed to the heat source. This reduces the amount of time required for crystal nucleation to take place, the rate limiting step in quantum dot formation. All batch methods included the use of a non-polar solvent, organic surfactant, and metal salt precursors. As shown by the Jensen group at MIT, the benefits of using a microfluidic reactor for QD synthesis are potentially an improved reaction yield, continuous production and easy scale-up, increased QY, decreased particle size distribution, and improved life cycle analysis (Jensen 2009). QDs can be produced in less than 5 minutes and require substantially less energy input. The microfluidic reactors used by the Jensen Group make use of specifically designed microfluidic cells that allow extremely precise control over reaction conditions, compared to the more simple design of the microfluidic reaction system used in this work.
Experimental Section:
Materials:
Copper (II) chloride (CuCl2, 99.995%, Sigma Aldrich), indium (III) acetate (In(C2H3O2)3,
99.99%, Sigma Aldrich), 1-dodecanethiol (CH3(CH2)11SH, 98%, Sigma Aldrich), and
purification. Anhydrous methanol (99.8%) and toluene (99.9%, CHROMASOLV Plus) were purchased from Sigma Aldrich and used as received.
Electrolyte (Iodolyte Z-150, 150 mM iodide/triiodide in 3 methoxypropionitrile, Solaronix 35321), counter electrode (test cell platinum electrode, Solaronix 74201), electrode (test cell transparent titania electrode, Solaranix 74111), CIS QDs (from HU method), dichloromethane (CH2Cl2, 99.5%, Sigma Aldrich), zinc acetate((CH3CO2)2Zn, 99.99%,
Sigma Aldrich), and sodium sulfide (Na2S, Sigma Aldrich) were used without further
purification.
Heat-Up Synthesis Method:
In this synthesis method, the precursor powders, 0.2 mmol copper (II) chloride and 0.4 mmol indium (III) acetate were combined in a three-neck reaction flask with the solvent, 10 mL 1-octadecene, and surfactant, 1.5 mL 1-dodecanethiol, at room
temperature. The flask was then drawn under vacuum and heated to 80oC. It was
maintained with magnetic stirring until all bubbling stopped, about 30-60 minutes. The flask was then heated to 200 oC and maintained under vacuum while the crystal
nucleation and growth took place (10-120 minute reaction were examined). The flask was allowed to cool to room temperature, with a subsequent addition of a non-polar solvent such as chloroform or toluene to help disperse the QD particles, followed by addition of a polar solvent, methanol to precipitate the QD particles. The suspension was centrifuged at 6000 rpm for 10 minutes, with the supernatant being discarded and the QD precipitate being dispersed in toluene, followed by addition of methanol before centrifuging again at 6000 rpm for 10 minutes. This washing process was repeated at least twice to ensure the final product was free of unreacted precursors. The QD powder was then dried overnight in a vacuum oven at 80 0C.
Hot-Injection Synthesis Method:
(II) chloride and indium (III) acetate, were combined in one flask with 10 mL of 1-octadecene and heated up to 200 oC under vacuum, while the sulfur-containing surfactant
(1.5 mL of 1-dodecanethiol) was heated up to a similar temperature and then injected into the metal salt solution once it reached 200 oC. The injection was carried out rapidly, typically lasting about 10 seconds.
Microfluidic Synthesis Method:
The synthesis process involved two main steps. Precursor mixing followed by controlled crystal growth. First the metal salt precursors, copper (II) chloride and indium (III) acetate, and surface ligand, 1-dodecanethiol, were dissolved in a non-polar solvent, 1-octadecene, and heated to 80oC. The reaction solution was then withdrawn in a glass syringe and loaded into a KD Scientific Legato microfluidic pump. The syringe was connected to PTFE tubing, with an inner diameter of 750 μm, and the reaction solution pumped through the controlled temperature zones before being collected in a glass vial for photoluminescence spectroscopy analysis. Specifications for the microfluidic reaction system are listed below in Table 2-1.
Figure 2-2: Microfluidic Reaction System.
Table 2-1: Microfluidic System Parameters
Flow Rate 0.01-1.0 mL/min
Superficial Velocity 2.2-220 cm/min
Heating Zone 1 200oC
Heating Zone 2 180oC
Residence Time (syringe pump to product collection)
0.5-45 min
QDSSC Assembly:
In this work CIS QDs were used as the primary absorbing layer for producing colloidal QDSSCs. A Colloidal Quantum Dot Sensitized Solar Cell architecture was used as described in the literature(Guijarro, Guillen et al. 2014, Kramer and Sargent 2014). A schematic of the cell design is shown in Figure 2-3.
Figure 2-3: Experimental Solar Cell Schematic(Solaronix 2015).
Cell Fabrication:
The QD ligand, 1-dodecanethiol, acted as a molecular linker attaching the QDs to the titania electrodes after calcining for one hour at 500 oC. The pre fabricated titania anodes were placed in solutions of CIS QDs dispersed in dichloromethane, a procedure adapted from the literature (Yang, Kim et al. 2013, Guijarro, Guillen et al. 2014). After soaking overnight, the anodes were rinsed with ethanol and heated to 90oC on a hot plate. The gasket was then applied to the top of the anode and then the cathode was sealed on top of the gasket. The electrolyte solution was then injected with a vacuum syringe
cat hode
anode
act ive area
anode
cat hode
through the pre-drilled hole. Finally, the hole was capped, forming a complete seal on the active area of the cell.
ZnS Passivating Layer:
In order to prevent the electrolyte from coming into direct contact with the QDs, which has shown to cause degradation, a passivating layer of zinc sulfide was applied on top of the QD absorbing layer (Guijarro, 2014). This technique is common among
researchers producing QDSSCs, and uses a successive ionic layer absorption and reaction (SILAR) approach to deposit the zinc sulfide(Yang, Kim et al. 2013, Guijarro, Guillen et al. 2014). This procedure involved consecutively dipping the sensitized electrodes in aqueous solutions of 0.5 M zinc acetate and 0.5 M sodium sulfide, each for one minute, repeated twice.
Figure 2-4: Experimental CIS QDSSC Design.
Characterization Methods:
Transmission electron microscopy (TEM) was performed to determine particle size for the QD samples. Images were analyzed with Image J to determine average QD size and standard deviation. TEM images were taken at an operating voltage of 100 kV using a Phillips CM10 TEM with Digital Camera Output.
Energy dispersive X-ray (EDX) spectroscopy was performed to compare the elemental composition of QD samples, using a Hitachi S-4500 field emission scanning electron
Anode Sensit izing La yer
Cat hode
Elect rolyt e
(Iodolyt e Z -150 , Solaronix)
CIS QDs
ZnS Passivat ing Layer (SILAR Growt h)
Plat inum Elect rode (Solaronix)
microscope with a Quartz PCI XOne SSD X-ray analyzer, at an operating voltage of 5 kV.
X-ray photoelectron spectroscopy (XPS) analyses were carried to determine surface
chemistry of the QD samples, with a Kratos Axis Ultra spectrometer using a
monochromatic Al K α source (15mA, 14kV). XPS can detect all elements except
hydrogen and helium, probes the surface of the sample to a depth of 5-7 nm, and has
detection limits ranging from 0.1 to 0.5 atomic percent depending on the element. The
instrument work function was calibrated to give a binding energy (BE) of 83.96 eV for
the Au 4f7/2 line for metallic gold and the spectrometer dispersion was adjusted to give a
BE of 932.62 eV for the Cu 2p3/2 line of metallic copper. The Kratos charge neutralizer
system was used on all specimens. Survey scan analyses were carried out with an analysis
area of 300 x 700 microns and a pass energy of 160 eV. High resolution analyses were
carried out with an analysis area of 300 x 700 microns and a pass energy of 20 eV.
Spectra have been charge corrected to the main line of the carbon 1s spectrum
(adventitious carbon) set to 284.8 eV. Spectra were analyzed using CasaXPS software
(version 2.3.14).
A Nicolet 6700 fourier transform infrared (FTIR) spectrometer equipped with a smart ITR diamond horizontal attenuated total reflectance (ATR) accessory was used to collect absorbance spectra from 500-4000 cm-1 for confirming ligand functionalization on the QDs.
X-Ray diffraction (XRD) was used to confirm the crystal structure of the QD samples. Analysis was done using a Bruker D2 Phaser powder difractometer using CuKα radiation (λ for Kα = 1.54059 Å) from 2θ = 0-100. Estimates for particle size were calculated based
on equation (3-1), using the Diffrac.EVA XRD analysis software.
A PTI photoluminescence spectrophotometer was used to measure the photoluminescence emissions of the QD samples. The QDs were dispersed in toluene and excited with an excitation wavelength of 400 nm. Emission spectra was collected from 420-800 nm.
Results and Discussion:
CIS QDs were first produced examining the HU and HI synthesis methods with different molar ratios of Cu:In. CIS QDs were also synthesized using a microfluidic technique with different flow rates, as seen below in Table 2-2. In order to determine the most effective synthesis method for making the CIS QDs, samples produced from these methods were compared using several characterization techniques. The most attractive feature of QDs is their ability to absorb and emit lights at different wavelengths. To characterize the optical performance of these QDs, UV-Visible and photoluminescence spectroscopies were used. These results are then further analyzed to determine QYs of the samples from different synthesis methods.
Photoluminescence spectroscopy was the first characterization technique performed on each QD sample as the emission spectrum profile is a quick way to determine the effectiveness of a synthesis method. Reaction solvent volumes from 5-50mL, most commonly 1-octadecene, were tested and it was found that for using 0.2 mmol of copper, and changing the amount of indium according to the desired molar ratio, in 10 mL of 1-octadecene, optimal QD products were produced. Synthesis procedures with three different molar ratios for HU and HI experiments were performed, with parameters listed in Table 2-2. Using equivalent sample concentrations,
Table 2-2: Summary of HU and HI CIS QD Experiments
Sample
Name
CIS-R1 (HU and HI)
CIS-R2 (HU and HI)
CIS-R3 (HU and HI)
CIS-R2 (Micro)
CIS-R2 (Micro)
Reaction
Time (min)
60 60 60 2.7 0.6
Molar
Ratio
(Cu:In)
1:1 1:2 1:4 1:2 1:2
Transmission Electron Microscopy:
Figure 2-5: TEM images of CIS R1 HU (a), CIS R1 HI (b), CIS R2 HU (c), CIS R2 HI (d), CIS
R3 HU (e), and CIS R3 HI (f).
Table 2-3: CIS QD Size Comparison
Sample Average Diameter (nm) Standard Deviation (nm)
Heat-Up:
CIS R1 3.6 1.3
CIS R2 4.9 1.4
CIS R3 5.5 2.2
Hot-Injection:
CIS R2 3.6 0.6
CIS R3 5.7 0.9
Literature Comparison:
CIS (Yu, 2013) 3.4 0.4
CIS (Chang, 2013) 9.3 0.5
CIS (Song, 2012) 2.0-2.5 Widely dispersed
TEM results for CIS R1 HI and CIS R2 Micro showed significant agglomeration, as seen below in Figures 2-6 and 2-7.
Figure 2-6: TEM image of CIS R1 HI.
20 nm
Figure 2-7: TEM image of CIS R2 Micro.
Energy-dispersive X-ray Spectroscopy:
EDX was used to determine the elemental composition of the QD samples produced from the HU and HI synthesis techniques.
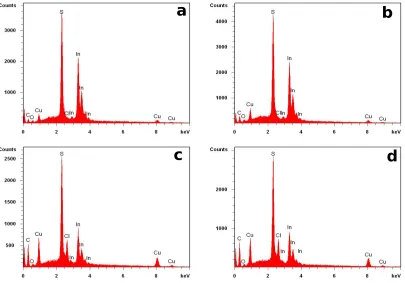
Figure 2-8: EDX Spectrum of CIS-R3-HI (a), CIS-R3-HU (b), CIS-R1-HI (c), and CIS-R1-HU (d).
Table 2-4: Summary of EDX Results for CIS-R1 HU/HI and CIS-R3 HU/HI
Element % C O S Cu In
Sample
R1-HU 44.7 1.2 16.4 18.0 15.0
R1-HI 42.8 1.1 16.7 19.4 15.6
R3-HU 22.3 4.3 25.1 6.8 40.9
R3-HI 14.6 2.2 27.0 8.6 46.9
for R1 samples and 1:4 for R3 samples (Table 2-2). It can be seen that the carbon content, attributed to the QD ligand, is higher for the HU synthesis samples. This can be attributed to the ligand having more surface coverage on the QD, because of the longer time it is exposed to QDs during the crystal nucleation reaction. It can be seen that the amount of S present is dependent on the molar ratio of Cu:In. The S elemental percentage is consistent for both methods with each of the different molar ratios.
X-ray Photoelectron Spectroscopy:
Further to EDX, XPS was performed to determine specific chemical bonding of elements present within the QD samples. The survey spectrums of CIS R1 and CIS R2 from the HI method are compared below in Figure 2-9.
Figure 2-9: XPS Survey Spectrums of CIS R1 (left) and CIS R2 (right).
To characterize the CIS QDs, six characteristic peaks were examined, including indium 3d 5/2, indium 3d 5/2 - M4N45N45 auger parameter, copper 2p 3/2, copper 2p 3/2 –
L3M45M45 auger parameter, carbon 1s, and sulfur 2p 3/2 and 1/2. The high resolution
CIS R1:
CIS R2
Table 2-5: XPS Peak Position Comparison
Peak Peak Position (eV)
(CIS R10
Peak Position (eV) (CIS R2)
Dominant
Compound(Beamson 1992, Wagner 2003)
Cu 2p 3/2 932.29 932.31 Cu(II) - CuS
Cu LMM 570.63
Auger Parameter: 1848.4
570.76 Auger Parameter:
1848.3
Cu(I) - CuS
In 3d 5/2 444.88 445.14 CuInS2
In MNN 1079.56
Auger Parameter: 852.03
1079.94 Auger Parameter:
851.9
In2S3
S 2p 3/2
162.26(i) (95%) 163.55(ii) (5%) 162.34(i) (83%) 161.39(ii) (17%)
CuS, C-S-H (Thiol), CuInS2
S 2p 1/2
163.44(i) 164.73(ii) 163.52(i) 162.57(ii)
Doublet separation from S 2p 3/2,
+1.18 eV
C 1s 284.80 284.80 C-C, C-H (from QD
ligand)
Comparing the binding energies for each peak to those in the XPS database (Beamson 1992, Wagner 2003), the data in Table 2-5 confirms the chemical structure of the QD samples as being a mixture of CuInS2, CuS, and In2S3. Analyzing the auger parameters as
well for copper and indium allows for more insight into the dominant chemical species, as there is limited availability of XPS database data for specific binding energies from CuInS2.The copper peaks indicate Cu(I) as being the dominant species in both samples.
The indium auger parameter suggests In2S3 as being the dominant species, however the
indium 3d 5/2 peaks correspond directly to the binding energy of CuInS2, 444.9 +/- 0.4
functionalization on the QDs. These findings corroborate the previously discussed EDX results, showing that the QD samples produced have the structure of CIS2.
Fourier Transform Infrared Spectroscopy:
As shown in Figure 2-12, peaks from approximately 1350-1450 and 2800-2900 are present from C-H bonds, characteristic of 1-dodecanthiol which is coated over the outer surface of the QDs, CH3(CH2)10CH2SH, indicating successful functionalization of
the QDs with the surface ligand. These results are consistent with findings from EDX and XPS indicating ligand functionalization on the surface, resulting in C-H and C-C bonds.
Figure 2-12: FTIR Absorbance Spectrum of CIS QDs.
X-ray Diffraction:
The XRD spectrum of CIS-R2-HU corresponds to bulk tetragonal chalcopyrite CIS, with characteristic peaks at 27, 47, and 55 degrees (Chang and Waclawik 2013). These results are consistent with EDX and XPS, indicating a CIS2 tetragonal chalcopyrite
Figure 2-13: XRD Spectrum of CIS-R2-HU.
UV-Visible Spectroscopy and Photoluminescence Spectroscopy:
The absorbance profiles of CIS QDs produced by the investigated methods are very similar. Samples show strongest absorbance in the UV region, with some continuing into the visible range, making them ideal for applications requiring emission at 650 nm and higher. The only samples that actually produced visible absorption peaks were CIS-R2-HU and CIS-R2-HI, which can be seen in Figure 2-14.
Figure 2-14: Absorbance and Emission Spectrums of CIS QDs. Emission Spectrum of
CIS-R2-HU (a), Emission Spectrum of CIS-R2-HI (b), UV-Visible Absorbance Spectrum of CIS-R2-CIS-R2-HU
(c), and UV-Visible Absorbance Spectrum CIS –R2-HI (d).
It can be observed that the sample produced from the heat-up (HU) method has stronger absorbance, both at equal concentrations of CIS QDs. To perform QY calculations, the sample absorbance measurements were taken using UV-Visible Spectroscopy at very low concentrations to minimize light scattering, yielding absorbance values from 0.002-0.012 (Nanoco-Group-PLC 2013).
Figure 2-15: Emission Spectrum of CIS-R2-Micro with 0.1 mL/min flow rate.
Figure 2-16: Emission Spectrum of CIS-R2-Micro with 0.5 mL/min flow rate.
Table 2-6: Comparison of Sample Photoluminescence Intensities
Sample Peak Emission Intensity (counts)
CIS-R2-HU 500 000
CIS-R2-HI 600 000
CIS-R2-Micro with 0.5 mL/min flow rate 130 000
When comparing the sample emission spectrums of the different methods it can be seen that the intensity is highest for the HI sample. Although it was expected that the different synthesis methods would produce different results, mostly due to different heat transfer rates and mixing conditions, the emission intensity is highly dependent on the
concentration of QDs being tested. The QY can be used to normalize the effects of concentration and provide a comparison based on the absorption-emission efficiency of the QDs.
Quantum Yield:
The QY of a material is particularly important with light harvesting applications such as photovoltaics, with the QY defined as the ratio of photons absorbed to photons emitted. One of the main advantages of QDs is their ability to absorb light and convert it into more desirable wavelengths. The QY value is highly related to the performance of QDs in this area. The QY is greatly influenced by surface chemistry, such as trap sites in the QDs, ligands used, storage conditions and synthesis techniques. High QYs are characteristic to high-performance, higher quality QDs.
The QY was calculated using the following formula (Nanoco-Group-PLC 2013):
𝑄𝑌 = 𝑄𝑌𝑠× 𝐴𝑥
𝐴𝑠×
𝐹𝑠
𝐹𝑥×
𝑁𝑥
𝑁s^2
2
(2.1)
where A refers to the area under the photoluminescence emission spectrum, F refers to the absorbance value at the excitation wavelength, N refers to the refractive index of the solvent, s refers to the standard used, and x refers to the unknown sample.
material based on an optimized QY procedure developed by Nanoco Inc.(Nanoco-Group-PLC 2013). Although the QY can be determined using one set of absorption and emission measurements from Coumarin 153, a more accurate, reproducible procedure involved constructing a calibration curve for the dye standard. Dye solutions containing Coumarin 153 dissolved in toluene of different concentrations were prepared and their absorbance was measured at 400 nm. Immediately after the absorbance measurements,
photoluminescence measurements were carried out. This same procedure was used to develop the QD calibration curves also by dissolving QD powder in toluene at different concentrations. The area under the photoemission was then calculated, allowing a
calibration curve relating absorbance to integrated photoluminescent area to be produced. Due to the high QY of most commercial dyes, dye solutions with absorbance values in the range of 0.002-0.012 were selected because more concentrated dye solutions produce substantial photoemissions, which lead to less accurate photoluminescence