Shareholder Value: An analysis of Return on Assets and Equity
and their impact on Corporate Strategic Donation using profit
Margin and Turnover .
Dr. Solomon Arhin
Affiliation: Christian Service university Kumasi, Ghana
ABSTRACT:
Return on Assets(ROA) and Return on Equity(ROE) are key performance indicators that the investors of companies shares always consider in assess their future earning potentials. Any shareholder who anticipates a decline in Return on Assets(ROA) or Equity usually takes proactive step to avoid such an unprecedented, unforeseen and undesired event to happen. From the biblical perspective, in Mathew 25:27, investors put their moneys into the bank to obtain interest. This study focuses on establishing relationship between Return on Asset and Return on Equity using profit Margin and Turnover as a model of Corporate strategic Donation in the selected firms. The population for the study is made up all the Information Technology companies registered with Security and exchange commission database. The study uses sample size of consolidated financial statement of 471 subsidiaries that was registered and reported their financial statement with Security and exchange database. It is a quantitative study that used IBM SPSS version 21 to analyze the data obtained from the secondary source. The responses received were analyzed through descriptive statistics in the form of percentages, mean score, standard deviation, Simple and Multiple Regression Analysis and ANOVA tests to determine how the various groups within the data collected may have greater or lesser influence on the success of Corporate strategic Donation as discretionary management tool. The research reveal that Corporate strategic
Donation does not have adverse impact on the measurement of Return on Asset (ROA,) and Return on Equity(ROE,) as the main dependable variables used in the analysis . While Turnover has positive impact of Corporate Strategic Donations, Profit Margin has negative relationship with Corporate Strategic Donation. The study concluded that emerging firms from the downturn were committed to their communities, but also seeking to generate a bigger impact with their contributions. The study recommends that future researchers can large sample size to show the relationship between corporate donations and their resultant effect on shareholder returns.
Keywords: Strategic philanthropy, Return on Assets,Return on Equity, ANOVA Test Regression, Turnover.
1. INTRODUCTION 1.1 Research Backgrounds
demand and supply for the share on the exchange market.However, the dividend decision is really an interaction between the investment decision and the financing decision, as the amount of money paid out as dividends will affect the level of retained earnings available for investment .most companies follow target dividend payout policy where a constant proportion of earnings is distributed as dividends each year. These important decisions have to be taken care of so that the investor can really assess the quantum of his return on assets or equity invested before any corporate donations can be considered. This study examines the relationship between the return on assets and equity with corporate strategic donation from profit margin and Turnover.
1.2 Statement of the problem
Academic finance researchers have stated that in financial management of business, the key objective is the maximization of shareholders’ wealth. The maximization of shareholders’ wealth is equivalent to the maximization of the market value of the company’s ordinary shares. A company is financed by ordinary shareholders, preference shareholders, loan stock holders and other long –term and short-term payables. All surplus funds, however, belong to the legal owners of the company, its ordinary (equity) shareholders. Any retained profits are undistributed wealth of these equity shareholders.
Shareholders are interested in how much they will receive as dividends. Retained profits can be increased by reducing the dividend payout ratio or by not paying a dividend at all. This is not necessarily in the best interests of the shareholders who might prefer a certain monetary return on their investment..
However ,there are situations whereby turnover and profit margin will decline and stock prices plug due to changes in market conditions .These situation can affect the company’s strategic
philanthropy commitment and dividend payout
policy drastically.
Therefore, there remains a gap in the research to assess the situation of corporate philanthropy commitment in such rough business situation whether the same trend continues to achieve shareholder wealth maximization in terms of return on assets and equity.
1.3 Purpose of the study
The rationale behind this research is to provide a specific and accurate synopsis of the overall purpose of the study (Locke, Spirduso, & Silverman, 1987). Nevertheless, there is a school of thought that believes that corporate charitable activities known as strategic philanthropy adversely impacts the corporate performance and shareholder returns especially in the times where corporate margin and turnover are in decline. The purpose of this study is to test this assertion in the academic literature. Strategic philanthropy is a unique and powerful way where corporations change their philosophy of giving from one of pure generosity to one that aligned charity with commercial objectives. Measurement of the impact of strategic philanthropy will be on profitability measures: Return on Assets (ROA) and Return on equity (ROE), as dependent variables and gross margin and Turnover as independent variables.
1.4 Research Objectives The specific research objectives for this study
include following:
i) To assess the relationship between Return on Assets, and the corporate strategic donations. ii)To measure the relationship between Return on Equity, and the corporate strategic donations. iii) To relate the level of Turnover to Corporate
strategic donations.
1.5 Research Questions
The General research questions are the measure these variables that affect corporate strategic donations and relate them to one another. The specific research questions are identified as follows:
i)Are there any relationship between Return on Equity and the Corporate strategic donations? ii) What is relationship between Return on Equity and corporate Strategic donations?
iii) Does turnover relates to corporate strategic
donation in any way?
iv) Can profit Margin be related to corporate strategic donation as well?
1.5 Significance of the study
Research into the nature of corporate strategic donations is of deep interest in the sense that, many organizations have been redeemed and restored by philanthropies. At the individual organizational level, the importance cannot be over emphasized. This study will make a unique contribution to academic literature in that it examines philanthropic activities in the context of elements that are of much concern to shareholders and will provide strong indications to shareholders to consider in making investment and financing
decisions especially in times of fierce economic downturn, acute corporate losses or mass laid off of company employees .It will contribute to body of knowledge to be used to prevent the collapse of many too big to fail corporations. It also aims to contribute to academic literature and bridge the knowledge gap on corporate strategic donations which can be very resourceful to future studies in terms of organization and the level of academic citation for future research purposes.
1.6 Limitations and Delimitations
All the firms used for this study are listed in the Stock exchange market and are in high-tech industry. Non listed high-tech firms are not included in the sample size for this study. The sample of the population study was only in the high tech industries in US . Other industries were not used and might also serve as delimitation to this research..
2.0 LITERATURE REVIEW 2.1 Introduction
The review covers the theoretical or conceptual framework of the study. The researcher also reviews prior but related studies on tracing the development on this study and measurement and definition of the variables used in the study.
2.2 Conceptual framework: Return on Assets
Return on Equity
Profit Margin
Corporate strategic Donation and commitment (CSD)
2.3 Tracing the development Corporate strategic donation.
Rimel (2001) gave a technical view of corporate strategic donation; according to Greek tradition, the first philanthropist was Prometheus. He gave mankind fire. The impulse behind his act is imbedded in the Greek root of the word philanthropy “love of mankind”. But philanthropy is not simply a kind attitude- it also implies a certain kind of approach. The gift of fire transformed the world. Fire did not simply permit a few people to enjoy a hot meal and a warm shelter on the day it was given. It was a new tool that could be used forever to help humans make their often –hostile environment more accommodating. Leisinger (2007), drew a dichotomy between strategic philanthropy and charity. He said a differentiation can be made between philanthropy and charity, defining charity as unconditional short-term relief (for example., for tsunami victims), while Philanthropy attempts to investigate and address the underlying causes to make a tangible positive change in the social conditions that cause the problem. Further, a robust operational definition of philanthropy can be drawn from the accounting literature : philanthropy is “an unconditional transfer of cash or other assets to an entity or a settlement or cancellation of its liabilities in a voluntary nonreciprocal transfer by another entity acting other than as an owner” (Financial Accounting Standards Board [FASB], 1993: 2). The non reciprocity condition becomes the acid test of philanthropic activity; it is not an explicit exchange of value between two parties such as cause-related marketing but, rather, a transfer of wealth from one party to another.
Strategic philanthropy from a more managerial perspective is a corporate philosophy of giving from one of pure, if scattered and unplanned, generosity to one that aligns giving with commercial objectives. It is the alignment of a
corporation’s charitable strategy with its business strategy. The strategic philanthropic activities reinforce strategic business goals. A well designed program balances the positive impact on the community with a clear understanding of the positive impact a giving program will have for the company, its brand, customers and importantly employee recruitment and retention. For example, Mattel donated $25 million to put its name on the children’s hospital at University of California, Los Angeles, now called Mattel Children’s hospital. The company has no role running the hospital. Adding the company name to the hospital increase brand recognition and contribute to compassionate corporate image among toy buyers. This benefit reinforces the commercial goals while helping sick children.
Porter and Kramer (2002) explained that strategic Philanthropy can often be the most cost-effective way for a company to improve its competitive context, enabling companies to leverage the efforts and infrastructure of non profits and other institutions transfer of wealth from one party to another. Godfrey,Merrill and Hansen(2009) Posit that for firms with negative social impacts, engagement in Corporate social responsibility may be perceived as money to either atone for past sins or it may be a substitute/complement for other negative practices(for example, tobacco companies that try to offset their negative product image through generous philanthropy). Roper and Cheney(2005) advocate that today as in the past, strategic philanthropy work often represents a shift away from traditional business pursuits ,or at least a parallel “social Stream” for successful leaders at turning points in their careers. Many well-known articles and scholarly publications have been made on the aspects of strategic philanthropy prior to the
recent US recession.
intensive competition in the global marketplace will soon force them to function in the poorest regions of the world. These have been a point where many research have emanated and corporations have been measured on their philanthropic contributions. However, Riecken and Yavas(2005) investigated that, there is an important debate among academics about the relationship between corporate philanthropy and corporate financial performance. There are several fundamental reasons for the tremendous growth of interest in the new wave of strategic philanthropy. In the first place, Well-designed contributions can increase the firm’s name and brand recognition among customers in a similar manner to
advertising (Lev,Petrovits and
Radhakrishnan,2010).
In addition,Wang,Choi and Li,(2008) examined that despite substantial growth over the past two decades, corporate philanthropy remains controversial. Some critics argue that corporate contributions are drain on shareholder wealth and a distraction of managers’ attention, while others claim that the business sector is not giving enough. Wood(1991) studied that in the 1960s and 1970s, one shock after another-the OPEC oil crises and resulting economic “stagflation”; the dramatic regulatory successes of environmental, consumer protection, and civil rights activitists;business crises involving political payoffs, life-threatening products, and toxic pollution-pounded home the message that the business environment was social and political , not just economic and technological. Devinney(2009) argued out that, first, corporations exist to generate economic returns, not to solve societal problems. They live to optimize for themselves (that is, their near stakeholders: shareholders, managers, employees, suppliers, governments,etc.), not the general public. However, Pearce and Doh(2005) in their research found out that, strategic Philanthropy without active engagement - cash donations, for instance -
community conditions to improve a workforce. Therefore a firm selects a distinct position in what it exante perceives to be an unexploited or underexploited niche .Werbel and Wortman (2000) studied and pointed out that corporate philanthropy is rooted in questions of corporate identity. The primary basis for making this link is that the corporate philanthropy is a discretionary activity. Contrasting this, Grant,Dutton and Rosso(2008) found out that giving strengthens affective organizational commitment through a “prosocial sense making” process in which employees interpret personal and company actions and identities as caring. Conversely, Goleman,(2000), emphasized that in order to lead, one needs to know how to negotiate, understand the politics of any situation and handle them sensitively, use humor appropriately, and maintain an even temperament despite the extremes of situation. Deephouse,(2000) demonstrated that some of these actions (like charitable donations) are viewed favorably in reputation research and others are viewed positively by stakeholders. Choi and Wang (2009) found support for the arguments that a high stakeholder relation rating both helps a wel-perfoming firm to sustain superior profits and helps a poorly performing firm to move out of its disadvantageous position more quickly. Lev,Petrovits and Radhakrishnan,(2010) made a persuasive case that charitable contributions appear most effective in enhancing revenues in the customer sectors, such as retailers and financial services . Leszczyc and Rothkop(2010) advanced the understanding that , research in cause related marketing has demonstrated that consumers tend to select products bundled with Philanthropy. Nothwistanding that Doh,, etal ,(2003) noted that some companies employ the strategy of social contributions and public donations as an alternative to both avoidance and compliance.Matten and Crane(2003), carefully suggested that as opposed to corporations engaging in charity simply for the
sake of it, corporate citizenship presents a case for strategic philanthropy.
2.4 Measurement of Variables:
In this research four main key variables having effect on corporate strategic donations are measured using dependent and independent variables. Return on Assets(ROA) and Return on Equity(ROE) are the main dependent variables. In order words, The change in Corporate strategic donations will have direct impact on return on Asset and Return on Equity all other things being equal. Independent variables are the profit margin and Turnover. Changes in Turnover and profit Margin may have indirect effect on the firms strategic donation Commitment .There are cases where Turnover and margin will decrease yet, the firm will have to meet its strategic donation commitment to enable the company to maintain its status quo or reputation in the market.
2.5 Definition of Variables:
Corporate Strategic Donation : Giving that strengthens affective organizational commitment through a “prosocial sense making” process in which employees interpret company actions as caring.
Return on Assets(ROA) :Defined as the rate at which assets are turned over to generate profit,
computed as
(Profit before interest and Tax/ Total Assets) . Return on Equity(ROE): Defined as rate of return attributable to equity shareholders for their investment.
Computed as Profit after tax/Capital employed.
3.0 METHODOLOGY 3.1 Research Design and Approach
The research uses quantitative approach using statistical tool IBM SPSS version 21 to confirm and validate the findings from the data collected from secondary source clearly and unambiguously. The Firms selected have the obligation to report all their final statements in the security and exchange commission database. Companies that do not have financial statements comprising income statement, statement of financial position and statement of cashflow on the database were not considered.
3.2 Population and Sampling
The population for the study comprises all the high tech companies that report their financial statement on Security and Exchange Commission database. Since it is impossible to deal with the entire population, An initial selection of fortune 500 companies operating in the information technology industry in the United States were selected. Out of these, the financial data was pulled out from the fifty-nine (59) Consolidated company’s website and Edgar /SEC database for the four year period. These fifty-nine(59) consolidated Companies have subsidiaries firms comprise of four hundred and seventy one ( 471) subsidiaries included in the consolidated statements of operations. The four hundred and seventy one ( 471) subsidiaries constituted the sampling size for this study. All these subsidiaries have their financial statements clearly reported in the dabase.The sampling technique adopted is simple random sampling where firms with all the required information are
selected for the study.
3.3 Research Instrumentation
A number of statistical methods or tools are used to analyze the data. Strategic philanthropy or Corporate Strategic Donation (CSD) is the main key variable measured in relation to dependent and
independent variables. Dependant variables associated with this study are: ROA–Return on Assets, and ROE,-Return on Equity. Independent variables associated with this research study are Profit margin (M) and Turnover (T). Some of the statistical tools that are utilized in the data analysis include Simple and Multiple Regression analysis to evaluate the numeric data; Factor Analysis is used to analyze the relationship between the variables . Reliability tests, including mean, median, standard deviation are performed on data that is collected to determine data reliability and usefulness. ANOVA tests is used to determine how the various groups within the data collected may have greater or lesser influence on the success of Corporate strategic Donation(CSD) as management tool.
3.4 Data Collection Procedure
Brammer, Pavelin and porter (2008) stated that firm-level strategic philanthropic activities is reported in the Annual Report of each company. This suggest that the financial information of each firm would primarily be the major source of information for the study. Financial data of firms are required by regulation to be reported to US Securities and Exchange Commission (SEC)/Edgar Electronic database on corporate filling. Corporate filling information is reported on form 10K. By regulations firms that fail to report their financial statements by the timeline given faces the penalties as expressly stated in the applicable regulations.Becuase of this disclosure requirement, companies make every effort to submit their 10K to Security and Exchange Commission as per the timelines set by Security and Exchange commission.
3.5 Validity and Reliability
performance on Corporate strategic Donations(CSD) while the independent variables of profit Margin and Turnover are used to predict performance on Corporate Strategic Donations(CSD). External validity was ensured by choosing firms in the fortune 500 companies in the information technology company for the study which are entered in the Security and Exchange database. This makes it easier for generalization and comparability of results. Reliability is ensured in this study by adhering to the same procedure in collection of financial data on firms and the performance of the statistical analysis for each of the dependent and independent variables selected for this study.
3.6 Ethical Issues
Ethical issues have been a major concern in recent research .Because of this actual names of firms which financial information are used for the statistical analyses are not disclosed rather a simple mathematical matrix was prepared using the financial ratio formulas to calculate the value of return on assets and return on equity. Profit margin figures and turnover figures can straightaway obtained from the financial statements without
computation. The actual results obtained after the calculations are input to the SPSS to obtain the results of the analysis. The result obtained from the database are used for the purpose of this research only and for any particular gains or public disclosure as ethical or moral obligations may require.
4.0 RESULTS OF STUDY
4.1 Data Analysis and Statistical Analysis Tool
IBM SPSS version 21 was used to analyze the data collected to provide various information needed for the study. The rationale for using the IBM SPSS version 21 was for the sake of avoiding complex statistical analysis and provides easy to understand design methodology and analysis using the most current version of the software. Preliminary data analysis revealed the following descriptive statistics for the 59 Consolidated Companies selected in the sample in the information Technology industry .The figure shows the relationship between Corporate Strategic Donation(CSD) and ROA and ROE by statistical mean and median.
Figure 1: Relationship between ROA,ROE and CDS
Statistics ROA ROE CSD
N Valid 59 59 59
Missing 0 0 0
Mean .035712 -.17737 12.69105
Median .030000 .02000 3.25000
The first and initial analysis indicates a positive relationship between Return on Assets(ROA) and Corporate Strategic Donation in terms of the statistical mean of .0357 whiles there is negative relationship between Return on Equity(ROE) and
Corporate Strategic Donation(CSD) in terms of Statistical mean of -.177
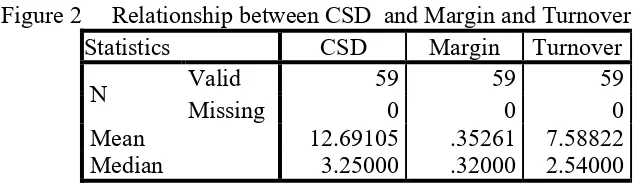
Figure 2 Relationship between CSD and Margin and Turnover
Statistics CSD Margin Turnover
N Valid 59 59 59
Missing 0 0 0
Mean 12.69105 .35261 7.58822
Median 3.25000 .32000 2.54000
The second initial data analysis of firms selected in the sample in the information Technology industry indicates a positive overall performance in terms of internal measures. The two independent variables as performance measures compared with Corporate strategic Donation(CSD) recorded a positive variables for margin, with positive mean values of .352. Turnover ratio is however high with a mean of 7.588 compared with Corporate strategic Donation positive mean of 12.69
However, according to Tabachnick and Fidell (2007), although normality of the variables is not
always required for analysis; the solution is usually quite a bit better if variables have normal distribution. It follows that if variables are not the same, some of the variables will be too peak or skewed positively or negatively and this will affect the solution. A normal distribution for figure 1 and figure 2 will provide a better view in appearance in this case. The two approach usually used are Logarithmic transformation to reduce skewness and kurtosis of sample data, and improved the statistical evaluation of the distribution by assuming 5% trim mean which helps to eliminate the effect of outliers from the IBM SPSS version 21 as illustrated in the figures 3 below.
Figure 3
Descriptive Statistics with Logarithmic Transformation of Variables (Z score) and Trim mean of 5% N Minimum Maximum Mean Std.
Deviati on
Skewness Kurtosis
Stati
stic Statistic Statistic Statistic Statistic Statistic Error Std. Statistic Error Std. Zscore(ROA) 59 -2.74954 3.66611 .000000 1.0000 .456 .311 2.489 .613 Zscore(CSD) 59 -.42820 6.17140 .000000 1.0000 4.688 .311 25.988 .613 Zscore(ROE) 59 -5.13431 1.82184 .000000 1.0000 -4.125 .311 19.373 .613 Zscore(Margin) 59 -1.92532 2.75342 .000000 1.0000 .447 .311 -.480 .613 Zscore(Turnover
)
59 -2.75208 4.85405 .000000 1.0000 3.050 .311 13.640 .613 Valid N
(listwise)
Figure 3 shows the effect of skewness and kurtosis when a 5% trim mean is assumed. The Skewness was very high for CSD( 4.69) among all the variables . The rest shown positive relationship except ROE which recorded a negative skewness
of -4.125. The kurtosis indicated high positive relationship for CSD .All other variables have relatively good positive relationship except profit margin which indicate negative relationship of -.480 to CSD.
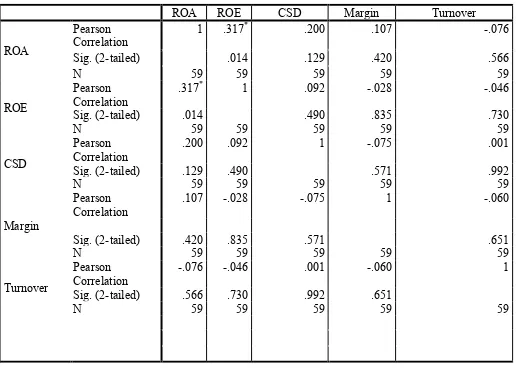
Figure 4 : Correlations among Variables (Z scores)
When ROA(dependent variable is held constant,Turnover produces higher positive relationship of .566 to CDS than Margin and ROE together.However, if ROE is held constant, margin turns to produce higher positive relationship of .835 to CSD than turnover and ROA combined.
On the aspect of the indiepende variables, if Margin is held constant,The ROE produces higher correlations to CDS ,.835 follow by Turnover,.651 ,then ROE with .571 and ROA. Lastly if Turnover is assumed to be constant,ROE produces higher positive correlations than ROA.
ROA ROE CSD Margin Turnover
ROA
Pearson Correlation
1 .317* .200 .107 -.076
Sig. (2-tailed) .014 .129 .420 .566
N 59 59 59 59 59
ROE
Pearson
Correlation .317
* 1 .092 -.028 -.046
Sig. (2-tailed) .014 .490 .835 .730
N 59 59 59 59 59
CSD
Pearson Correlation
.200 .092 1 -.075 .001
Sig. (2-tailed) .129 .490 .571 .992
N 59 59 59 59 59
Margin
Pearson Correlation
.107 -.028 -.075 1 -.060
Sig. (2-tailed) .420 .835 .571 .651
N 59 59 59 59 59
Turnover
Pearson
Correlation -.076 -.046 .001 -.060 1
Sig. (2-tailed) .566 .730 .992 .651
On the whole the two independent variables Margin and Turnover produces higher positive
relationship to CDS than the dependent variable of ROA and ROE put together.
Figure 5
(T-Test for ROA Group Mean)
Group Statistics for Corporate strategic Donation for firms who gave at least $0.2million
CSD N Mean Std.
Deviation
Std. Error Mean Zscore(RO
A)
>= 0.2m 54 -.0079411 1.00383120 .13660412 < 0.2m 5 .0857642 1.06688007 .47712327 Group statistics is the result of IBM SPSS version
21 calculation of sample size, sample mean, standard deviation and standard error mean when testing for mean difference in ROA with Corporate Strategic Donation as the main variable. 59 firms constitute the sample of which 54 firms were big givers who contributed to Corporate strategic Donation of amount equal or greater than $0.2million and only 5 firms were small givers
who contributed to Corporate strategic Donation of an amount less than $0.2million. One can conclude that the mean of the Corporate Strategic Donation group which contribute more than $0.2million is lesser than the mean of the group which contributes less than $0.2million. However, positive difference in mean between the two groups is statistically insignificant.
Independent Samples Test
Levene's Test for Equality of
Variances t-test for Equality of Means
F Sig. t Df
Sig. (2-tailed
) Mean Difference Std. Error Difference
95% Confidence Interval of the Difference
Lower Upper Zscore
(ROA) Equal variances assumed
.058 .811
-.199 57 .843 -.09370528 .47137897 -1.037625 .85021482 Equal
variances not assumed
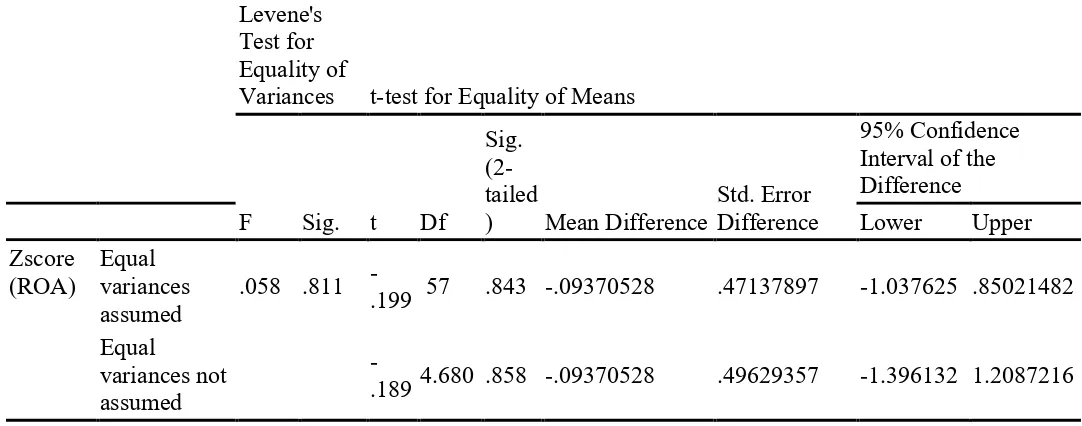
The t test value in the figure 5 continued with equal variances assumed as -.199; this falls in the left hand rejection region for any commonly used
α, and the p value is .843
The p value of .843 implies that, the difference between the two means is not statistically significantly different from zero at the 5% level of significance. There is an estimated change of
-.093% (SE = .471%). However, there is insufficient evidence (p = .843) to suggest that ROA has negative impact on Corporate Strategic Donation. Based on a confidence level of 95% and a confidence interval of [-1.03, .850] one can say that ROA does not negatively impact firm performance Corporate Strategic Donation.
Figure 6
(T-Test for ROE Group Mean).
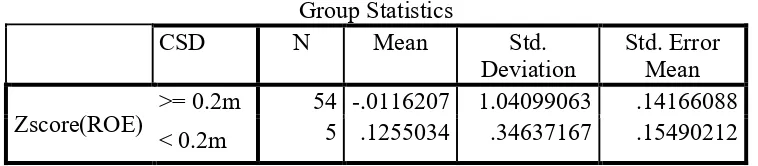
Group Statistics
CSD N Mean Std.
Deviation
Std. Error Mean Zscore(ROE) >= 0.2m 54 -.0116207 1.04099063 .14166088
< 0.2m 5 .1255034 .34637167 .15490212 59 firms constitute the sample of which 54 firms in
contributed to Corporate strategic Donation of amount equal or greater than $0.2million and only 5 firms contribute to Corporate strategic Donation of an amount less than $0.2million. One can conclude that the mean of the Corporate Strategic
Donation group which contribute more than $0.2million is lesser than the mean of the group which contributes less than $0.2million. However, positive difference in mean between the two groups is statistically insignificant.
.
Independent Samples Test
Levene's Test for Equality of
Variances t-test for Equality of Means
F Sig. t Df
Sig. (2-tailed
) Mean Difference
Std. Error Difference
95% Confidence Interval of the Difference
Lower Upper Zscore
(ROE)
Equal variances assumed
Independent Samples Test
Levene's Test for Equality of
Variances t-test for Equality of Means
F Sig. t Df
Sig. (2-tailed
) Mean Difference
Std. Error Difference
95% Confidence Interval of the Difference
Lower Upper Zscore
(ROE) Equal variances assumed
.304 .584
-.291 57 .772 -.13712405 .47119242 -1.080670 .80642250 Equal
variances not assumed
-.653 12.81 .525 -.13712405 .20991063 -.5912847 .31703663
The t test value in the figure 6 continued with equal variances assumed as -.291; this falls in the left hand rejection region for any commonly used
α, and the p value is .772
The p value of .772 implies that, the difference between the two means is not statistically significantly different from zero at the 5% level of significance. There is an estimated change of -.137% (SE = .471%). However, there is insufficient evidence (p = .772) to suggest that ROE does impact Corporate Strategic Donation negatively. Based on a confidence level of 95% and a confidence interval of [-1.08, .806] one can
say ROE does not negatively impact Corporate Strategic Donations.
Figure 7
Regression Analysis with ROA as first Dependent Variable
A standard multiple regression analysis and ANOVA was performed between ROA as the dependent variable and Corporate Strategic Donation, margin and Turnover as independent variables. The results are shown in the tables below:
Regression Analysis with ROA as Dependent Variable.
Variables Entered/Removeda
Mode
l Variables Entered Variables Removed Method
1
Zscore(SPP), Zscore(Marg in),
Zscore(Turn over)b
a. Dependent Variable: Zscore(ROA) b. All requested variables entered.
Model Summary
Mode l
R R Square Adjusted R Square
Std. Error of the Estimate
1 .326a .107 .040 .97962016
a. Predictors: (Constant), Zscore(CSD), Zscore(Margin), Zscore(Turnover)
ANOVAa
Model Sum of
Squares
df Mean
Square
F Sig.
1
Regression 6.179 4 1.545 1.610 .185b
Residual 51.821 54 .960
Total 58.000 58
a. Dependent Variable: Zscore(ROA)
b. Predictors: (Constant),, Zscore(CDS), Zscore(Margin), Zscore(Turnover)
Coefficientsa
Model
Unstandardized Coefficients
Standardized Coefficients
t Sig.
95% Confidence
Interval for B Correlations B Std. Error Beta Lower Bound Upper Bound Zero-order Partial Part 1 (Constant) 1.000E- .128 .000 1.000 -.256 .256
Zscore(CSD) .191 .136 .191 1.400 .167 -.082 .464 .107 .187 .180 Zscore(Margin) .070 .153 .070 .456 .650 -.237 .377 -.076 .062 .059 Zscore(Turnover) -.265 .158 -.265
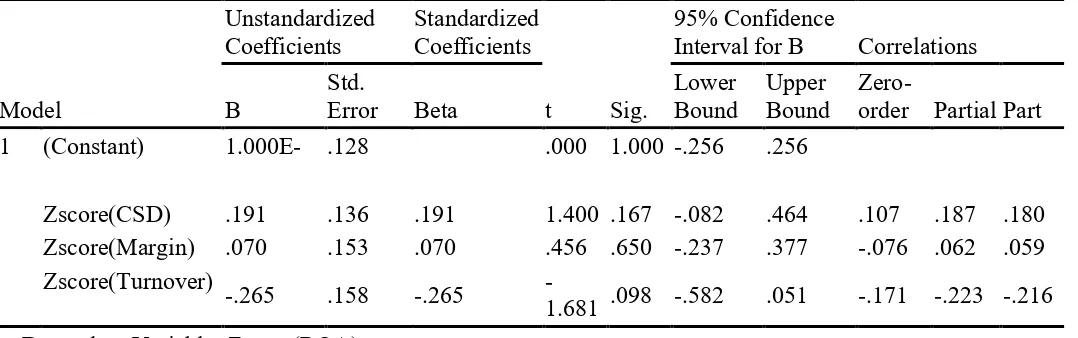
-1.681 .098 -.582 .051 -.171 -.223 -.216 a. Dependent Variable: Zscore(ROA)
Figure 7 shows the correlation between the variables and the unstandardized regression coefficients (B) and the intercept, the standardized
p<.001, with R2 at .107 and 95% confidence levels. The adjusted R2 value .040 indicates less than a tenth of the variability in performance (ROA) is predicted by CSD, Margin and Turnover. For the two regression coefficients that differed significantly from zero, 95% confidence limits were calculated., those for (log) of CSD were [-.082, .464]. The (log) of Margin were [-.237, .377] and that of Turnover is (-.582,.051) respectively.
Figure 8
Regression Analysis with ROE as second Dependent Variable
A standard multiple regression analysis and ANOVA were performed between ROE as the second dependent variable and CSD, Margin ,Turnover as independent variables as shown below.
.
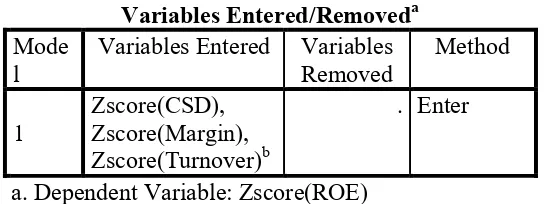
Regression Analysis with ROE as Dependent Variable
Variables Entered/Removeda
Mode l
Variables Entered Variables Removed
Method
1
Zscore(CSD), Zscore(Margin), Zscore(Turnover)b
. Enter
a. Dependent Variable: Zscore(ROE) b. All requested variables entered.
Model Summary
Mode l
R R Square Adjusted R Square
Std. Error of the Estimate
1 .107a .011 -.062 1.03045396
a. Predictors: (Constant), Zscore(SPP), Zscore(Margin), Zscore(Turnover)
ANOVAa
Model Sum of
Squares
df Mean
Square
F Sig.
1
Regression .661 4 .165 .156 .960b
Residual 57.339 54 1.062
Total 58.000 58
a. Dependent Variable: Zscore(ROE)
b. Predictors: (Constant), Zscore(CSD), Zscore(Margin), Zscore(Turnover)
Model
Unstandardized Coefficients
Standardized Coefficients
t Sig.
95% Confidence
Interval for B Correlations B
Std.
Error Beta
Lower Bound
Upper Bound
Zero-order Partial Part
1 (Constant) -1.000E- .134 .000 1.000 -.269 .269
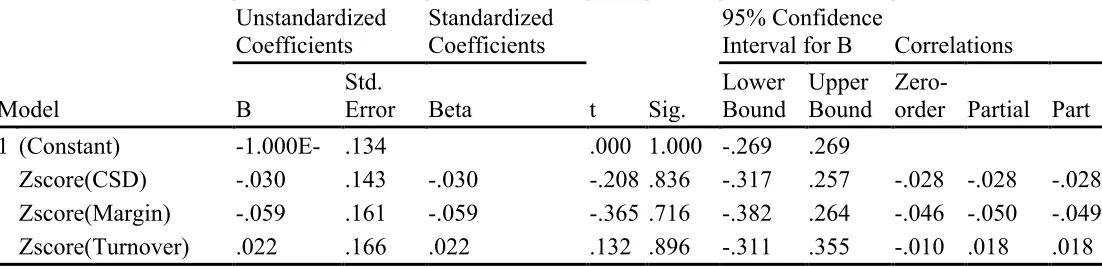
Zscore(CSD) -.030 .143 -.030 -.208 .836 -.317 .257 -.028 -.028 -.028 Zscore(Margin) -.059 .161 -.059 -.365 .716 -.382 .264 -.046 -.050 -.049 Zscore(Turnover) .022 .166 .022 .132 .896 -.311 .355 -.010 .018 .018 Figure 8 shows the correlation between the
variables and the unstandardized regression coefficients (B) and the intercept, the standardized regression coefficients (β), the partial correlation, R2, and adjusted R2. R for the regression was significantly different from zero, F (4, 54) = .156, p<.001, with R2 at .011 and 95% confidence levels. The adjusted R2 value -.062 indicates less than a tenth of the variability in performance (ROE) is predicted by CSD, Margin and Turnover. For the two regression coefficients that differed significantly from zero, 95% confidence limits were calculated. The confidence limits for (log) of CDS were [-.317, .257]. The (log) of Margin were [-.382, .264] and that of Turnover is (-.311,.355) respectively.
4.3 Discussion of Findings
The statistical analysis was used to perform analysis on the key dependent variables and independent variables on Corporate strategic Donations. It is a quantitative study that uses fifty nine (59) consolidated giant companies .The data used is primarily secondary which were available at security and exchange commission data base as companies are require to file their 10k by regulation annually. The fifty-nine(59) consolidated companies has four hundred and seventy one(471) subsidiaries located internationally. The Four variables used are ROA and ROE as dependent Variables and Profit
Margin and Turnover as independent variables. These variables were used to find out their main relationship to the Corporate strategic Donation
(CSD) activities .
The first dependent variable ROA by the use of statistical mean indicate positive relationship to CSD as stated in objective one. Further analysis was done to confirm the mean results by regression and ANOVA.For research objective 1 , the result for ROA indicate that there is insufficient evidence (p = .843) to suggest that ROA has negative impact on Corporate Strategic Donation. The regression The adjusted R2 value .040 indicates less than a tenth of the variability in performance (ROA) is predicted by CSD, Margin and Turnover.
The ROE as the second dependent variable however shows negative relationship to CSD as required in research objective 2. However, when regression analysis is performed, there is insufficient evidence (p = .772) to suggest that ROE does impact Corporate Strategic Donation negatively. The adjusted R2 value -.062 indicates less than a tenth of the variability in performance (ROE) is predicted by CSD, Margin and Turnover.
5.0 CONCLUSION 5.1 Summary of findings
Research objectives Method adopted Results
ROA and its relationship to CSD Statistical mean,
regression and ANOVA
Both analysis support that ROA has positive relationship to CSD and other variables predict ROA by less than 10% ROE and its measurement with CSD Statistical mean,
regression and ANOVA
ROE has negative relationship with CSD by mean test; however, the regression analysis lacks sufficient evidence to support the negative relationship. Turnover and its relationship with
CSD Statistical means Turnover has strong positive relationship to CSD. Profit Margin and its relationship with
CSD
Statistical means Margin has less positive relationship to CSD.
5.2 Conclusion
Conclusion thought on the analysis of the data suggests companies emerging from the downturn were committed to their communities, but also seeking to generate a bigger impact with their contributions. The key findings of this study reveals that in the information technology industry, there is no enough evidence to support the hypothesis that adaptation of strategic philanthropy negatively impact performance on return on Assets (ROA) and Return on Equity(ROE) in the quantitative measure. The overall result shows some significant trend though statistically insignificant but practically significant but not to generalize for the industry. The study takes holistic approach from the selectivity of importance performance indicators of both internal and external to the firm that has bearing on the profitability.
Recommendations for future research
It is recommended for future researchers in the same area to use larger sample size with other industries such as retails, agriculture and mining
where the application of the theory is very minimal. Cooperative learning have occurred in more formal organizations in most of the advanced countries but little has been done in an informal sector especially where the companies are located in a less developed countries. Alliance formations in these areas can also provide enough sector for the growth of the informal sectors .Future researches must also focus on finding process on standard policy formulations for existing alliances that will serve as a standard for future alliance formations for new alliances.Finally,future alliance researchers must go beyond just the process of the alliance formation but the degree of policy implement after the alliance formation to assess the party that stay or default in their promises during the formation.
REFERENCES
2. Locke, L. F., Spirduso, W. W., and Silverman, S. J.(1987). Proposals that work: A guide for planning dissertations and grant proposals (2nd Ed.). Newbury Park, CA: Sage. 5.
3. Rimel,R.W.(2001).Charity and Strategy: philanthropy’s Evolving Role. Proceedings of the American philosophical society,145(4),587-595. 4. Leisinger,K.M.(2007).Corporate philanthropy: The
“Top of the Pyramid”. Business and Society Review, vol.112,Issue 3,315-469.
5. Financial Accounting Standards Board (1993). Statement of Financial Accounting Standards (SFAS) No. 116 Accounting for Contributions Received and Made. Norwalk, CT: FASB.
6. Porter,M,E. and Kramer,M.R.(2002).The competitive Advantage of corporate philanthropy.
Harvard Business Review,80(12),56-68.
7. Godfrey,P,C.,Merrill,C,B.,and Hansen,J.M.(2009). The relationship between Corporate Social Responsibility and shareholder Value :An Empirical Test of the Risk Management Hypothesis. Strategic Management Journal,30,425-445.
8. Roper, J. and Cheney, G. (2005).Leadership, learning and human resource management. The meanings of social entrepreneurship today.
Corporate Governance, 5(3), 95-104.
9. Riecken, G. and Yavas, U. ,(2005).The attitudes of Donors and Non-Donors to the March of Dimes Charity in the United States: A Case study in Non-profit Marketing. International Journal of Management,22(4),572-581.
10. Lev,Baruch.,Petrovits,C .,and
Radhakrishnan,S.(2010).Is doing good good for you?. How corporate charitable contributions Enhance Revenue growth. Strategic management Journal, 31,182-200.
11. Wang, H., Choi, J. and Li, J.(2008).Too little or too much? Untangling the Relationship between Corporate Philanthropy and Firm Financial performance. Organization Science, 19(1), 143-159.
12. Wood, D. J. (1991).Social issues in management: Theory and Research in Corporate social performance. Journal of management, 17(2)383-406.
13. Devinney, T. M.(2009). Is the Socially Responsible Corporation a myth? The Good, the Bad, and the ugly of corporate social Responsibility. Academy of management perspectives, 23, 2, 44-57.
14. Pearce II,J.A. and Doh,J.P.(2005).The High Impact of collaborative social Initiatives.MIT SloanManagement Review,46(3),30-39.
15. Godfrey, P. C.(2005) ,The Relationship between Corporate philanthropy and Shareholder Wealth: A risk management perspective. Academy of management Review,30(4),777-798.
16. Kong, E. (2008).The development of strategic management in the non-profit context: Intellectual capital in social service non-profit organizations.
The international Journal of management Reviews,
10(3), 281-299.
17. Cone,L,C.,Feldman,M.A., and Dasilva,A.T.(2003). Causes and Effects. Harvard Business Review.81(7),95-101,118 .
18. Xin, K. R.and Pearce, J.L.(1996)., Connections as substitutes for formal institutional support.
Academy of Management Journal, 39(46), 1641-1658.
19. Waddock, S, A. and Graves, S, B. (1997).The corporate social performance-financial performance Link. Strategic management Journal
18(4), 303-313.
20. Werbel, J. D. and Wortman, M. S. (2000) .Strategic Philanthropy: Responding to Negative portrayals of corporate Social Responsibility.
Corporate Reputation Review, 3(2), 124-136. 21. Grant,A.M.,Dutton,J.E.and Rosso,B.D.(2008).
Giving commitment: Employee support programs and the prosocial sensemaking process. Academy of management journal,51(5),898-918.
23. Deephouse, D. L. (2000).Media Reputation as a strategic Resource: An Integration of Mass Communication and Resourced based Theories.Journal of Management, 26(6), 1091-1112.
24. Choi, J. and Wang, H. (2009).Stakeholder Relations and the persistence of corporate financial performance.Strategic management Journal, 30(8), 895-907.
25. Leszczyc, P. T. and Rothkopf, M. H.(2010) .Charitable Motives and Bidding in Charity Auctions .Management Science, 56(3),399-413. 26. Doh, P. J. and Etal. (2003).Coping with corruption
in foreign markets. Academy of Management Executive, 17(3).
27. Matten, D. and Crane, A. (2005).Corporate Citizenship: Towards an Extended Theoretical conceptualization. Academy of Management Review, 30(1), 166-179.