CATTLE SERUM TRANSFERRINS: A BALANCED POLYMORPHISM?
G. C. ASHTON
Department of Genetics, University of Hawaii, Honolulu
Received June 14, 1965
ISHER (1930) defined the most likely condition f o r a stable polymorphism Finvolving two alleles as one in which the heterozygote showed superior fitness relative to both homozygotes. The conditions for stability of a polymorphism in which more than two alleles occur have been examined by several authors (for review see SMITH 1961). There is general agreement that overdominance is a prerequisite for maintaining stability. A number of polymorphisms are known in invertebrates in which heterozygote advantage has been demonstrated experi- mentally (FORD 1964; SHEPPARD 1958). I n vertebrates heterozygote advantage has been established with certainty as a balancing mechanism only in the case of the sickle cell hemoglobin heterozygote (ALLISON 1956), although there is mounting evidence (MORTON and CHUNG 1959) that the human
MN
blood group polymorphism may also be maintained by heterozygote advantage.So f a r heterozygote advantage has not been demonstrated for any of the serum protein polymorphisms now known in vertebrates. ASHTON (1958) reported that differential fertility might be occurring between matings of various cattle serum transferrin genotypes. Matings between parents from which equal numbers of offspring like and unlike the mother (with respect to transferrin genotype) were cxpected showed a significant excess of like-mother progeny. Other workers were not. able to confirm this result ( BRUMMERSTEDT-HANSSEN, MOUSTGAARD and MDLLER 1963), but the results of the first segregation analysis prompted a direct investigation of the breeding efficiency of matings between parents of known transferrin genotype (ASHTON 1961). Pooled data for 25M inseminations are shown in Table 1. The most successful matings were from homozygous parents of unlike genotype (61.6%), followed by matings between homozygous parents of like genotype (55.6%). Matings involving heterozygotes were less efficient, homo- zygotes X heterozygotes giving a mean breeding efficiency of 49.2%, and matings between two heterozygotes giving 45.6%. Because TfE was absent from the Jersey cattle examined, and at low frequency in the Australian Illawama Shorthorns, the data in Table 1 refer only to matings involving the alleles TfA and TfD.
Although these results seemed to show heterozygotes at a disadvantage, subse- quent analysis of the returns-to-service data (ASHTON and FALLON 1962) indi- cated that heterozygotes were more viable in utero and therefore at an advantage
(see below),
Genetics Paper No. 5.43. Contribution from Pacific Biomedical Research Center
This investigation was supported in part by Public Health Service Research Grant 1 R 0 1 HD 01831-01, from the National Institute of Child Health and Human Development.
984 G . C . ASHTON
TABLE 1
Breeding efficiencies (percentage of inseminations resulting in a live or stillborn caLf) for matings between various transferrin genotypes
Bull transferrin genotype
Cow transferrin genotype A / A A / D D / D
55.9 45.3 59.5
51 .O 45.6 46.9
61.9 50.3 55.3
Data from ASHTON and FALLON, (1962).
Consideration of data from several sources suggests that four phenomena af- fecting reproductive performance are associated with transferrin polymorphism in cattle. These are (1) superiority of heterozygotes in utero, (2) mother-fetus incompatibility, ( 3 ) differential fertility of heterozygous and homozygous bulls, and (4) differential fertility of heterozygous and homozygous cows. Interaction between these factors produces the observed distribution of breeding efficiencies. Notwithstanding the relatively poor breeding efficiency of matings involving heterozygous parents it can be shown that the advantage of the heterozygote in
utero may be sufficient to produce a balanced polymorphism.
Heterozygote superiority: Because TfE is relatively infrequent, or even absent, in European breeds of cattle the data available refer mainly to TfA and Tf”, and only these alleles are considered in the main treatment in this paper. I t is now known that “Tf”” is really two alleles TfD1 and TfDs (KRISTJANSSON 1962; ASH-
TON 1965). Nearly all the published segregation and fertility data treat these
two alleles as a single Tf”, and it is necessary to remember that “TfAD” can be either TfADl or TfAD2, and “TfDD” can be TfDlD1, TfDlD2, o r TfD2D2.
Evidence for superiority of the transferrin heterozygote TfAD comes from three sources:
( a ) Returns-to-service data. Table 2 shows the distribution of unsuccessful in- seminations as evidenced by the reappearance of oestrus (“return-to-service”) for
TABLE 2
Returns-to-service in artificially inseminated cows from two sources
Returns
Total
Source Mating inseminations
AsnToN and FALLON
( 1962) Like homozygotes 426 Unlike homozygotes 273 New Zealand
D. P. M. B.
(1963) Like homozygotes 101
Unlike homozygotes 119
0-24 days 25 days or more
~~
Percent No. total x 2
131 30.8 . . .
82 30.0 0.M
28 27.7 . . .
29 24.4 0.32
Percent
No. total xa
58 ,13.6 . . .
2.3 8.4 4.37*
10 9.9 . . .
5 4.2 2.79
SERUM TRANSFERRINS 985
the two time periods 0-24 days, and 25 days or longer, after insemination. Most of the inseminations which do not result in conception tend to occur in the first period. Returns in the second period (“long returns”) are partly or mainly com- posed of inseminations which caused conception but from which the products of conception did not remain viable. There is of course considerable overlap be- tween the two categories ( ASHTON and FALLON 1962). Two sets of data only have been published which report returns-to-service. These are shown in Table 2. Each set shows that long returns are least frequent from matings between unlike homo- zygotes i.e., TfAA male x TfDD female and TfDD male X TfAA female. Analy- sis by
x2
(SNEDECOR 1956) shows that the effect is significant in the Australian data (P<
0.05) but not in the New Zealand data. However the two sets of data are not significantly heterogeneous with respect to the distribution of long re- turns(xz
= 0.57, 2 d.f., P>
0.7) and the difference in the pooled data is signifi- cant(x’
= 5.88, 1 d.f., P<
0.02).These results imply that heterozygotes, produced from matings between unlike homozygous parents, are more likely to survive in utero than homozygotes, pro-
duced from matings between like-type homozygous parents.
It would be anticipated that matings producing homozygotes and heterozygotes in equal numbers would show an intermediate frequency of long returns. How- ever, as shown later some of these matings are subject to maternal-fetal incom- patibility and it is not possible to separate the loss due to the two causes by an ex- amination of long returns data.
(b) Matings between like heterozygotes. Direct evidence of heterozygote su- periority comes from analysis of segregation data from matings expected to pro- duce homozygotes and heterozygotes in equal numbers i.e., A/D male X A/D fe- male, A/A male x A/D female, and D/D male x D/D female. In these matings the mother will possess both alleles present in the fetus, and incompatibility will not be a complicating factor. Several workers have now reported segregation data, and their results are shown in Table 3 for the three relevant matings. The data were analyzed by the method given in SNEDECOR (1956). Overall, 717 heterozygotes and 637 homozygotes were produced, which differs significantly from equality
(xz
= 4.73, 1 d.f., P<
0.05). There was no significant heterogene- ity between matings with regard to the distribution of homozygotes and heterozy- gotes(x’
= 0.65, 2 d.f., P>
0.7). Further data are necessary before the extent of the effect can be established with certainty, but the weighted data in Table 3 imply that only about 89% of the homozygotes expected were produced by these matings.986 G. C. ASHTON
TABLE 3
Distribution of homozygotes and heterozygotes from matings in which maternal fetal incompatibility is not possible
Mating c? P
Progeny
Source' Homozygotes Heterozygotes Total
A / D X A / D A
B C D E F Total
A / A X A / D A
B C E F Total A B C D E F Total TOTALS
D / D X A / D
198 62 23 0 26 36 366 105 26 6 25 0 1 62 61 15 7 3 13 10 109
63 7
231 72 26 2 31 35 420 98 17 6 42 6 169 66 16 6 3 22 15 128 717 429 134 4.9 2 57 71 786 203 43 12 67 6 331 127 31 13 6 35 25 23 7
1354
* Source key: A BRUMMERSTEDT-HANSSEN et al. (1963). Progeny test data from 2079 matings (their Table 4 ) . B, BRUMMERSTEDT-HAE?SSEN et al. (1963). Data relating to bull calves (their Table 6 ) . C, GAHNE (1960). D, GALL and BERG (1964). E, ASHTON (1958b). F, ASHTON and FALLON (1 962).
tributions of genotypes, owing to the restricted use of sires (ROBERTSON 1965) in dairy and beef cattle herds. This difficulty could be resolved by working within sire groups, but in most cases the relevant information necessary to extract sire groups is not presented.
SERUM TRANSFERRINS 987
TABLE 4
Expected and observed distributions of transferrin and post-albumin heterozygotes f r o m surueys o f several cattle populations
Source' Population
Transferrin Post-albumin
heterozygotes heterozygotes
Observed Expected Observed Expected
G Sahiwal 176 168 106 113
Nganda 113 101 34 30
Boran 192 193 123 114
Tanganyika zebu 87 84 29 30
Teso 55 53 29 27
Ankole m 7 198 121 117
H Steers 43 36 30 27
Breeders (Unclassified) 119 113 74 72
Brisbane 100 92 61 61
Breeders (Classified) 79 72 46 46
1171 1110 653 63 7
* Source Note: G from ASHTON and LAMPKIN (1965); I1 from ASHTON, FRANCIS and RITSON, unpublished data.
value of 5.5% for transfenin heterozygote excess €or these herds is close to the 6.2% excess found in other surveys (ASHTON and FALLON 1962).
Maternal-fetal incompatibility: ASHTON ( 1958a) described an excess of like- mother offspring from matings involving the alleles
TfA
and T f D suggesting mother-fetus incompatibility. Other workers failed to confirm this effect, but it is nevertheless clear from their results that incompatibility exists. Segregation from matings which have a n equal chance of producing progeny compatible or incompatible with the mother are shown in Table5
f o r all the available data. Overall, these matings produced 478 compatible and 409 incompatible progeny, equal numbers of each being expected(xz
= 5.36, P<
0.05). The distribution of compatible and incompatible progeny was not significantly heterogenous(xz
=0.74, 1 d.f.,
P
>
0.3) between mating groups.The ratio between incompatible and compatible progeny is 0.86 which sug- gests that only 86% of incompatible progeny survive. However, it is impossible to derive a true estimate for incompatibility because all matings of this type pro- duce heterozygotes which may be at an advantage in utero, and this will con- found the incompatibility effect.
Heterozygote fertility: Apart from the two effects of transferrin type on fitness considered above, there is evidence that the fertility of heterozygous bulls is less than that of homozygous bulls, irrespective of cow genotype. Also there is less substantial evidence of a similar effect with respect to homozygous and heterozy- gous cows.
988 G . C. ASHTON
TABLE 5
Distribution of compatible and incompatible progeny from matings where equal numbers of both types are expected
Mating
d ?
Progeny
Source* Compatible Incompatible Total
A / D X D / D A 99 D / D 78 A / D 177
B 30 18 48
C 13 12 25
D 5 4 9
E 41 29 70
F 22 27 49
Total 210 168 378
A 1 5 9 A / A 1 3 4 A / D 293
B 55 59 104
C 12 14 26
D 7 4 11
E ' 2 0 12 32
F 15 28 43
Total 268 241 509
TOTAL 478 409 887
* Source key: See Table 3.
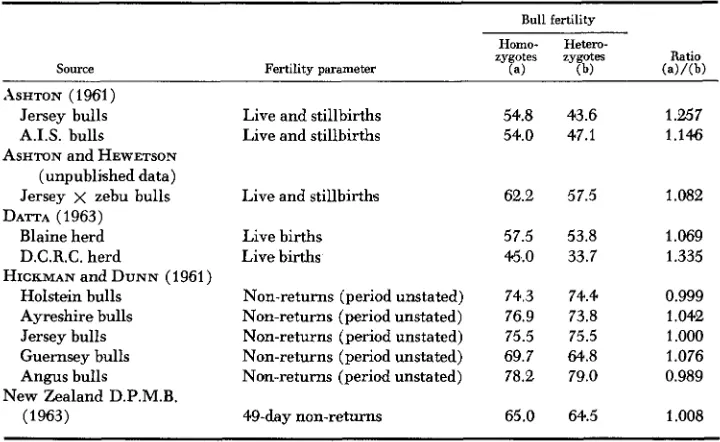
TABLE 6
Relaiive fertility of homozygous (mainly TfAA and TfU D ) and heterozygous (mainly TfA D) bulls
Bull fertility
Source
Homo- Hetem-
zygotes zygotes Ratio
Fertility parameter (4 (b) (a)/(b)
ASHTON (1961) Jersey bulls A.I.S. bulls
ASHTON and HEWETSON (unpublished data) Jersey x zebu bulls DATTA (1963)
Blaine herd
D.C.R.C. herd Holstein bulls Ayreshire bulls Jersey bulls Guernsey bulls Angus bulls
(1963)
HICKMAN and DUNN (1961)
New Zealand D.P.M.B.
Live and stillbirths Live and stillbirths
Live and stillbirth's
Live births Live births
Non-returns (period unstated) Non-returns (period unstated) Non-returns (period unstated) Non-returns (period unstated) Non-returns (period unstated)
@-day non-returns
54.8 43.6 54.0 47.1
62.2 57.5
57.5 53.8 45.0 33.7
74.3 74.4 76.9 73.8 75.5 75.5 69.7 64.8 78.2 79.0
65.0 64.5
1.257 1.146
1.082
1.069 1.335
0.999 1.042 1.000 1.076 0.989
SERUM T R A N S F E R R I N S 989
the major problem is the small number of bulls usually available for comparison. Large numbers of inseminations for a single bull will increase the precision of the estimate of that bull’s fertility, but will not contribute to the estimate of the mean fertility f o r bulls of a given genotype, which is the main interest. Table 6 shows that in the data so far published, TfAD bulls are mostly less fertile than TfAA and TfDD bulls. The extent of the effect varies, and it is not possible to get an accurate estimate of the difference in fertility of the two types of bulls from Table 6. It is necessary to weight the ratios for homozygote:heterozygote fer- tility by the number of bulls of each type used in deriving the ratios, and this information is not available for all these data.
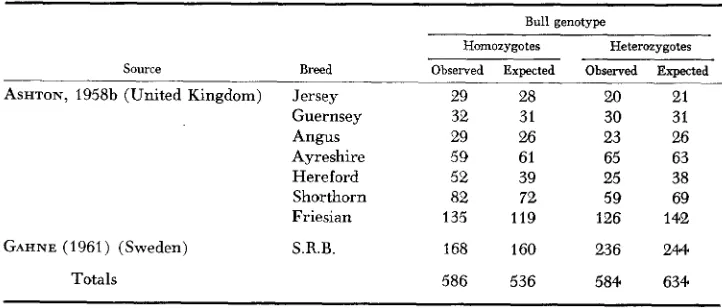
The poorer fertility of heterozygous bulls is substantiated in another way. Fer- tility is an important factor in bulls standing at Artificial Breeding Centers, and it might be anticipated that an excess of homozygous bulls would be found at such centers as a result of bull selection. The distribution of 766 bulls of seven breeds, standing at more than 20 centers in the United Kingdom in the period 1956-57, is shown in Table 7. The only other data relating to bulls at Artificial Breeding Centers were published by GAHNE (1961), for 404 SRB bulls in Sweden, and these show the same effect. Analysis of the data in Table 7 by
x 2
(SNEDECOR 1956) showed a significant difference between the expected and observed dis- tribution of homozygous and heterozygous bulls( x 2
= 8.61, 1 d.f., P<
0.01) and gave no evidence of heterogeneity between breeds(x’
= 8.60, 7 d.f., P>
0.2). There were 18.9%
more homozygous than heterozygous bulls based on expected distributions. This contrasts with the excess of heterozygotes found in cow popu- lations (Table 4) in which selection for milk yield rather than fertility is usual. Data showing the relative fertility of homozygous and heterozygous cows are given in Table 8 and relate largely to TfAA, TfAD and TfDD cows. They sup- port the conclusion that TfAD cows are less fertile than the homozygous cows, but the effect is not significant. Analysis by WOOLF’S (1955) method gavex 2
forTABLE 7
Observed and expected distributions of homozygous (TfAA, TfDD and T f E E ) and heterozygous (TfAD, TfAE and TfDE) bulls standing at Artificial Breeding Centers
Source Breed
ASHTON, 1958b (United Kingdom) Jersey Guernsey Angus Ayreshire Hereford Shorthorn Friesian
GAHNE (1961) (Sweden) S.R.B.
Bull genotype Homozygotes
-
Observed Exoected
Heterozygotes Observed Expected
29 28
32 31
29 26
59 61
52 39
82 72
135 119
168 160
20 21
30 31
23 26
65 63
25 38
59 69
126 142
236 244
990 G. C. ASHTON
TABLE 8
Relative fertility of heterozygous (mainly T f A D ) and homozygous (mainly T f A A and TfDD) cows
Cow fertility
Homozygotes Heterozygotes
No. of Percent No. of Percent
Source Fertility parameter inseminations successful inseminations successful
ASHTON (1961)
Jersey cows Live and stillbirths 746 52.6 781 49.6
A.I.S. cows Live and stillbirths 476 56.3 690 45.7
(1963) 49-day non-returns 443 66.1 393 63.1
Blaine cows Live births 225 51.6 206 60.2
D.C.R.C. cows Live birth’s 112 40.2 143 41.3
New Zealand D.P.M.B. DATTA (1963)
ASHTON and HEWETSON
(unpublished data) Live and stillbirths 477 60.0 387 59.4
deviation of incidence ratio from unity = 1.58, which is not significant, and
x2
for heterogeneity = 4.52, 5 d.f., P>
0.5. The analysis showed that homozygous cows were about 6.2% more fertile than heterozygous cows on average.The proposed model: A model which fits the order of breeding efficiencies ob-
tained by ASHTON and FALLON (1962) is shown in Table 9. This model utilizes the four demonstrated effects of transferrin type on fertility and is developed f o r the two alleles Tf” and “TfD”, little being known about T f E , or the two individual
D
alleles.( 1 ) Heterozygote superiority. Matings between unlike homozygotes which
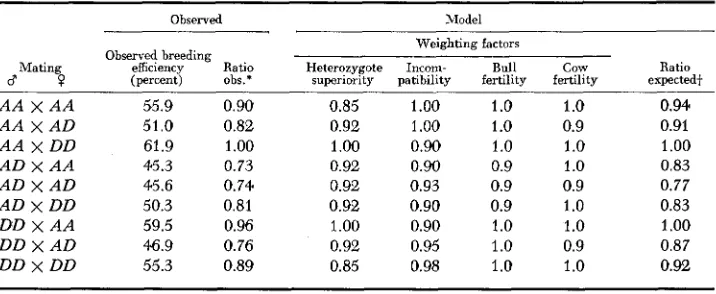
TABLE 9
Model proposed to explain the observed distribution of breeding efficiencies from the pooled data of Ashton and Fallon (1962)
Observed Model
Weighting factors Observed breeding
efficiency Ratio Heterozygote Incom- Bull cow Ratio
(percent) o h . * superiority patibility fertility fertility expected+
A A X A A A A X A D A A X D D A D X A A A D X A D A D x D D DD X A A D D X A D DD x DD
55.9 51.0 61.9 45.3 45.6 50.3 59.5 e . 9 55.3
0.90 0.82
1
.oo
0.73 0.74 0.81
0.96
0.76 0.89
0.85 1.00 1 .o 1
.o
0.92 1
.oo
1.o
0.91.00 0.90 1
.o
1.o
0.92 0.90 0.9 1
.o
0.92 0.93 0.9 0.9
0.92 0.90 0.9 1
.o
1
.oo
0.90 1.0 1.o
0.92 0.95 1
.o
0.90.85 0.98 1.0 1
.o
0.94 0.91 1
.oo
0.83 0.77 0.83 1.oo
0.87 0.92* Ratio observed taking 61.9% for AA male X DD female as 1.00.
SERUM TRANSFERRINS 991
produce only heterozygotes will suffer no disadvantage from this effect and are weighted by the factor 1.00. Matings between like homozygotes, which produce only homozygotes, are at a disadvantage and are weighted by the factor 0.85. This factor comes from analysis of the data presented in Table 3, where it is seen that approximately 87
%
as many homozygotes as heterozygotes are produced. Matings between homozygote and heterozygote are weighted by the factor 0.92, as only half their zygotes will be homozygotes.(2) Mother-fetus incompatibility. Matings producing only compatible fetuses are given the weighting 1 .OO while matings producing equal numbers of com- patible and incompatible fetuses are given the weighting factor 0.90. This is an arbitrary value close to the value of 0.87 derived from the data in Table 5. For reasons discussed above it is impossible to get an unbiased estimate of the effect due to incompatibility. Also the model requires the effect of incompatibility to be somewhat less than the effect of heterozygote advantage to meet the observed dis- tribution of breeding efficiencies.
Although the model is developed for the two alleles T f A and “Tf””, the observed distribution of breeding efficiencies was obtained from herds in which Tf”’ and TfD2 were segregating. It is necessary to make provision for this in the model. In the mating AD male x AD female there is the possibility of incompatibility be- tween TfADl embryos and TfAD2 mothers, TfAD2 embryos and TfADl mothers, and TfDlD2 embryos and TfAD1 or TfAD2 mothers. If Tf”’ and TfD8 were equally frequent in thsee populations the effect of incompatibility would be less than that from TfAA male x TfDD female (weighted at 0.90), but more than that from TfDD male x TfAD female weighted at 0.95. Thus the mating TfAD X TfAD is given the weighting 0.93. Similarly the mating TfDD male X
TfDD female will give rise to a proportion of incompatible zygotes, and is weighted by the factor 0.98.
(3) Heterozygote fertility. Both heterozygous bulls and cows are less fertile than their corresponding homozygotes. The exact values for their relative fertility is not clear. The mean unweighted ratio of homozygote: heterozygote bull fertility (Table 6 ) is 1.091, and the mean unweighted ratio for cow fertility is 1.062 (Table 8 ) . However, cows and bulls coded TfDD will include a proportion of heterozygous TfDlD2 individuals, and it is likely that the ratios f o r homozygote: heterozygote fertility are underestimates. Homozygote fertility for both cows and bulls is given the weighting factor 1 .O, and heterozygote fertility 0.9.
Theoretical values for the relative breeding efficiencies were derived by multi- plying the weighting factors for the four effects (heterozygote superiority, in- compatibility, bull fertility, cow fertility) and equating the ratio for the best mating, AA male X DD female to 1.00 (Table 9 ) . The ratio of the observed breeding efficiencies (from Table 1 ) was calculated taking the breeding efficiency of AA male x DD female as 1.00. Comparison of the ratios obtained from the observed breeding efficiencies with those produced by the model showed a good fit.
992 G . C . ASHTON
as a guide for interpretation of more stringent data as these become available.
Polymorphic equilibrium: The proposed model can be considered satisfactory if in addition to meeting the observed distribution of breeding efficiencies it also results in a balanced polymorphism. This may be examined mathematically, and I am indebted to DR. Y. HIRAIZU~TI for discussion and assistance with the relevant calculations. The mathematical analysis was 1-mited to consideration of two al- leles, Tf" and a single
TfD.
It consists of a comparison between the distribution of genotypes in any parental generation with that in the first filial generation, using the parameters of the model. From this comparison it is possible to deter- mine whether the model would lead to a balanced polymorphism.The frequency of each mating in the parental generation is readily calculated from the frequency of each parental genotype. From each mating the expected distribution of progeny after applying weighting factors for heterozygote su- periority, incompatibility and male and female heterozygote fertility can be de- rived (Table I O ) . The expected dis :ribution of each genotype in the progeny can be determined by summation and is equivalent to:
Frequency of AA in progeny at generation t = p t = z A A / G
Frequency of AD in progeny at generation t = qt = ZAD/Z
Frequency of DD in progeny at generation t = l-pt-qt = ZDD/G
where 5 = ZAA
+
ZAD+
ZDD.Putting: V A A = relative viability of TfAA progeny = 0.85
V D D = relative viability of TfDD progeny = 0.85
VADc = relative viability of TfAD progeny i n compatible (TfAD) mothers = 1.00
TABLE 10
Expected genotype and mating frequencies in parents at generation t and progeny in generation t
+
1Parents at
generatlon t Progeny at generation ( I
+
1 )~
SERUM TRANSFERRINS 993
Vaui = relative viability of TfAD prczeny in incompatible (TfAA
or TfDD) mothers = 0.90 and: Fertility of TfAA cows = FAA = 1.0
Fertility of TfDD cows = F,, = 1 .O Fertility of TfAD cows = FAD = 0.9 Fertility of TfAA bulls = f A A = 1.0 Fertility of TfDD bulls = f D D = 1 .O Fertility of TfAD bulls = fnD = 0.9
dpt -
?
[qt2(0.1721 -I- 0 . 0 2 0 8 ~ ~ )+
Then:dt w
pt(0.1Pt2
+
0.75pt - 0 . 8 5 ) ]qt(0.845 -I- 0.1
dqt - 1
d t [0.0208qt3 -I- qt2(0.1pt - 0.37)
+
qt(0.1pt2 - 1.9pt -I-0.005) 4- 1.8pt(l - p t ) ]
and LU = 0.85 O.lpt - 0.08qt - 0.1pt2 - 0.(Y2r08qt2 - O.lptqt
.
If selection operates on TfA and T f D it is assumed to be equal. Then at equilib- rium the following relationship will hold:
where $ and
4
are the estimated equilibrium frequencies of p and q. When d p t / d t = 0, then 0.89q3 - 26q2 f 1849 - 90 = 0.root gives:
$
4-
0.59 = 0.5Of the three roots to this equation two are imaginary, and the meaningful
9
0.5278 = equilibrium frequency of TfADand hence
$ = 0.2361 = equilibrium frequency of TfAA 1-$-9 = 0.2361 = equilibrium frequency of TfDD.
This implies that a population at equilibrium will show an excess of hetero- zygotes of 5.6% which is in good agreement with the values actually found
(Table 4; and ASHTON and FALLON 1962).
The stability of this equilibrium, maintained by heterozygote advantage, can be tested by applying the “characteristic equation” (LOTKA 1956). Let p t =
$
+
Apt, and qt =9
i- Aqt, where Apt and Aqt are slight deviations from the equilibrium values of $ and9.
Then_ _ -
dApt - -0.0024Apt
4-
0.3020Aqt4-
.
. .
(higher order values of Apt and A q t )- _
dAqt - 0.OOApt - 0.7863Aqt f
. .
.
(higher order values of Apt and A q t ) .dt
dt
and the characteristic equation for this system is
1
= o
’
-0.0024Apt - h 0.39200.00 -0.7863 - h
giving X = -0.0024 or -0.7863.
994 G . C . ASHTON
It should be noted that the differential equations dpt/dt and dqt/dt are more strictly written as finite difference equations, for example, Apt
i-
1. The arith- metic involved in the solution of such equations is complex, and the approximate but more readily soluble differential equations have been used here to obtain a general solution. A computer program for examining stability of equilibria is currently being written in this department (YASUDA,
personal communication). This will permit checking of the equilibrium for other values of p and q.Selection: A polymorphism maintained by heterosis is usually subject to selec- tive pressures, evidenced by inequality in the frequencies of the genes comprising the polymorphism. The nature of the selective forces acting on cattle transferrins in the feral state will most likely remain conjectural. However, evidence of powerful man-made selection is available from several sources, favors the trans- ferrin D alleles, and is associated with selection for milk yield.
OSTERHOFF (1964) has examined the distribution of transferrin genotypes of
female dairy cattle in different age groups. Up to 12 months of age the frequen- cies of Tf“ and Tf” were about the same, approximately 0.48, and the frequency of Tf” about 0.W. Tf” then showed a progressive rise and TfA a progressive fall in frequency with advancing age of the group examined, Tf” approaching 0.65 and TfA 0.25. The frequency of TfE also increased slightly approximating 0.1. OSTER-
HOFF points out that selection for higher milk yield is a continuous process, with the result that the older cows usually are the best producers. Other evidence of the effect of selection for milk yield on transferrin gene frequency comes from the data presented by LARSEN (1961). He examined the transferrin types of the three highest producing and three lowest producing heifers in each of 18 groups in the Danish progeny testing stations in 1959-60. The transferrin gene frequencies in the lowest yielding group were Tf“ 0.731, Tf” 0.241 and TfE 0.028, and in the highest yielding group TfA 0.630, TfD 0.333 and TfE 0.037. Although the differ- ence in gene frequencies was not significant, TfD is more frequent in the high producing group.
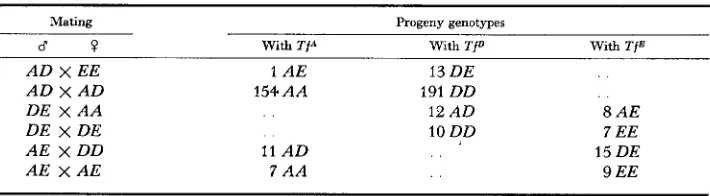
Selection for TfD is also apparent in the available segregation data from the six published sources examined in Tables 3 and 5. Six matings are available for assessing this effect, uncomplicated by heterozygote advantage or differential maternal-fetal incompatibility (Table 1 1 )
.
The relative “survival” of the progeny from these matings can be ranked in the order D>
E>
A. While it is true thatTABLE 11
Distribution of progeny from certain matings pooled from the six sources quoted in
Tables 3 and 5, showing selection favoring T P
>
T f E>
Tf*Mating Progeny genotypes
d ? With T j A With TfD With T f E
A D x EE A D x A D DE x A A
DE x DE A E x DD A E x AE
1 A E 13 DE
154 A A 191 DD
12 A D 8 AE
10 DD 7 EE
11 A D 15 DE
SERUM TRANSFERRINS 995
those results could also be explained by postulating prezygotic selection of D sperm in preference to E or A sperm it seems much more likely that postnatal selection for TfDD cows is the real cause. It must be borne in mind that the progeny which are available for segregation anlysis come mainly from dairy herds, will be mainly females, and will be from different age groups. Such con- siderations also make it more difficult to measure the extent of the effects shown in Tables 3 and 5.
Direct evidence that milk yield is influenced by transferrin type was obtained by ASHTON,
FALLON,
and SUTHERLAND (1964) who found that TfDD cows pro- duced a n average 45 imperial gallons of milk more than TfAA COWS, TfAD COWSbeing intermediate. These results confirmed earlier observations of ASHTON (1960) who examined the contemporary comparisons of bulls, found significant differences and forecast that TfDD cows would yield on average about 50 gallons more milk per lactation than TfAA cows.
While strong man-made selection is affecting the frequency of TfD in dairy herds the frequency of Tf" is still high, and in some cases higher than TfD
(ASHTON 195810; MARKUS, KOVACS, and FBsUs 1964). The reasons for this are not known, but it seems an inescapable conclusion that TfA is at a considerable ad- vantage, as yet undetermined.
TfE is usually present at low frequency in most European breeds. Its frequency is always higher in these breeds when they are located in the tropics. TfE is also frequent in zebu breeds (ASHTON and LAMPKIN 1965), and it seems likely that the selective advantage maintaining this allele is somehow associated with toler- ance to hotter climates. Unpublished observations revealed that sweating rate of TfAE and TfDE beef cattle is greater than of animals lacking TfE. Sweat and milk glands have a common embryological origin, and a common mechanism may link the advantages of TfD and TfE. If TfE also is maintained by heterozy- gote advantage, the necessary information will only come from studies of popu- lations with a high frequency of this allele. So far the information available about fertility of TfE cows and bulls and segregation of TfE genotypes is too scanty to warrant consideration. Similar comments apply to the transferrin alleles TfB, TfF, and TfG found in zebu cattle.
Conclusion: The data summarized here show significant effects for the four aspects of fertility somehow affected by transferrin type. While maternal-fetal incompatibility is reasonably well established for other antigenic systems, par- ticularly the Rh and AB0 blood groups in man, it is not at all clear why hetero- zygous fetuses should be more viable in utero than homozygotes, and quite con- jectural as to how heterozygous parents can be overall less fertile than homo- zygotes. Because of these gaps in our knowledge the title to this paper requires a question mark. Unequivocal demonstration of a polymorphism balanced in the complex manner described will require more stringent data than are now avail- able.
SUMMARY
996 G . C. ASHTON
bility, ( 3 ) poorer fertility of heterozygous bulls, and
(4)
poorer fertility of hetero- zygous cows. Estimates of these effects were derived from published data. Amodel with these parameters produced the observed distribution of breeding effi- ciencies. The model leads to a n apparently stable equilibrium for the two alleles considered, with an estimated population excess of heterozygotes very close to that observed.
LITERATURE CITED
ALLISON, A. C., 1956
ASHTON, G. C., 1958a
Population genetics of abnormal human haemoglobins. Acta Genet.
p-globulin polymorphism and early foetal mortality in cattle. Nature 183: 404-405. ___ 195813 Polymorphism in the serum proteins of mammals, with par- ticular reference to cattle, Thesis, University of Liverpool.
-
1960 p-globulin poly. morphism and economic factors in dairy cattle. J. Agric. Sci. 5 4 : 321-328. 1961 p-globulin type and fertility in artificially bred dairy cattle, J. Reprod. Fertil. 2: 117-129. - Polymorphism in the serum post-albumins of cattle. Nature 198: 1117-1118. - Serum transferrin-D alleles in Au'stralian cattle. Aust. J. Biol. Sci. 18: 665-670. p-globulin type, fertility and embryonic mortality inTransferrin (P-globulin) type and
Transferrin and post-albumin polymorphism i n East
Serum transferrin poly-
Immunogenetic studies of cattle transferrins and blood groups. Thesis, Uni-
Statist. Med. 4: 4 3 M 3 4 .
__
1963 1965
ASHTON, G. C., and G. R. FALLON, 1962
ASHTON, G. C., G. R. FALLON, and D. N. SUTHERLAND, 1964 ASHTON, G. C., and G. H. LAMPKIN, 1965
BRUMMERSTEDT-HANSSEN, E., J. MOUSTGAARD, and I. MBLLER, 1963
DATTA, S. P., 1963 FISHER, R. A., 1930
FORD, E. B., 1964 GAHNE, B., 1961
135-144.
GALL, G. A. E., and R. T. BERG, 1964 HICKMAN, C. G., and H. 0. DUNN, 1961 KRISTJANSSON, F K , 1C62
LARSEN, H., 1961
cattle. J. Reprod. Fertil. 3: 93-104.
milk and butterfat production in dairy cows. J. Agric. Sci. 62: 27-34. Africm clttln. Gen2t. Rea. 4: 203-215.
morphism in Danish cattle breeds. Roy. Vet. Agric. Coll. Copenhagen, Yearbook, 13-26.
versity of Wisconsin.
The Genetical Theory of Natural Selection. Clarendon Press, Oxford.
Ecological Genetics. Wiley, New York.
Studies of transferrins in serum and milk of Swedish cattle. Anim. Prod. 3: Studies of the inheritance of b s i n e serum transferrins. Anim. Prod. 6 : 107-1 17.
Differences in percentage of non-returns to service betwxn transferrin types of bulls. Can. J. Genet. Cytol. 3: 391-395.
Recent research in szrum protein polymorphisms of livestock. Proc. 8th Annual Blood Group Conference, Ljubljana, Yugoslavia. Mimeographed proceedings.
Investigations concerning the possible influence of serum P-globulins, haemo- globins an3 p-lact3globulins upon yielding ability of cattle. Inst. F. Sterilitetsforskning, Aarsberetning. pp. 125134.
LOTKA, A. J., 1956
MARKUS, J., G. KovAcs, and L. FBsUs, 1964
MORTON, N. E., and C. S. CHUNG, 1959
New Zealand Dairy Production and Marketing Board, 1963
Elements of Mathematical Biology, p. 60. Dover, New York.
The frequency of genes controlling serum p-glohu-
Are the M N blood groups maintained by selection? lin types i n Hungarian spotted cattle. Acta Vet. 14: 437114.2.
Amer. J. Human Genet. 11: 237-251.
p. 54.
S E R U M T R A N S F E R R I N S 997
OSTERHOFF, D. R., 1964 Recent research on biochemical polymorphism in livestock. J. S. Afr. Vet. Med. Ass. 35: 363-380.
ROBERTSON, A., 1965 The interpretation of segregation ratios in domestic animal populations. Anim. Prod. 7: (In press).
SHEPPARD, P. M., 1958 SMITH, C. A. B., 1961
Natural Selection and Heredity. Hutchison, London.
Statistical methods and theory. p. 140. Recent Advances in Human Ge- netics. Edited by L. S. PENROSE. Little, Brown, Boston.
SNEDECOR, G. W., 1956 WOOLF, B., 1955
25 1-253.
Statistical Methods. 5th ed., p. 213. Iowa State College Press., Ames.