ABSTRACT
MIDANI, MOHAMAD SAMIR. The Influence of Weave and Structural Parameters on the Performance of Composites from 3D Orthogonal Woven Preforms. (Under the direction of Dr. Abdel-fattah Seyam and Dr. Mark Pankow).
Over the past few decades there have been an increasing interest in woven preforms as a reinforcement for composites. Woven preforms not only offer ease of handling and structure uniformity, but also offer directional properties and high fiber volume fraction. The internal structure of a woven preform is dictated by the yarn spacing, interlacing pattern, yarn cross-section, yarn size, and other structural parameters that greatly influence the mechanical properties of the preform and hence the composite.
The invention of 3D Orthogonal Weaving (3DOW) technology, introduced new and enhanced features to the conventional 2D woven preforms. 3D woven preforms can be woven to near net shape, eliminate the need for stacking, have a through-thickness yarn component that significantly enhances the out-of-plane properties, and delamination resistance, in addition to having straight warp and filling yarns with no crimp, plus other features that are important to the composite industry.
generalized to predict the properties of any 3DOW structure, made with spun or filament yarn, jammed and non-jammed, which have any weave architecture, including hybrid composites. The model was verified experimentally for a broad range of experimental composites, including hybrid ones. The results indicated that there was a general good agreement between the experimental and theoretical curves. Moreover, a numerical parametric study was performed to reveal the architecture potential of 3DOW preforms.
A range of 3D woven E-glass preforms were woven using a patented 3D orthogonal weaving technology, and then converted into composites, using vacuum assisted resin transfer molding technology. The composite samples, had varying structural parameters, such as, number of Y-yarn layers, X-Y-yarn pick density, Z-Y-yarn interlacing weave pattern, and Z: Y-Y-yarn/ layer ratio. The purpose was to study the effect of changing those structural parameters on the mechanical properties of the 3DOW composites.
The response of the 3DOW composites subjected to different modes of impact was investigated. The study indicated that, the number of Y-yarn layers, had the most significant effect on the total Tup, Izod, and Charpy impact energies. The X-yarn pick density, had slight effect on the three modes of impact, while the Z-yarn weave design only had a slight significant effect on the Tup and Charpy impact energy. Additionally, when testing the overall correlation between the three impact energies, there was a strong correlation between the results of all three impact modes. However, after normalization there was a weak correlation between the Tup and Charpy impact results, very weak correlation between Charpy and Izod results, and no correlation between Izod and Tup results.
The Influence of Weave and Structural Parameters on the Performance of Composites from 3D Orthogonal Woven Preforms
by
Mohamad Samir Midani
A dissertation submitted to the Graduate Faculty of North Carolina State University
in partial fulfillment of the requirements for the degree of
Doctor of Philosophy
Fiber and Polymer Science
Raleigh, North Carolina 2016
APPROVED BY:
_______________________________ _______________________________
Dr. Abdel-fattah Seyam Dr. Mark Pankow
Co-chair of Advisory Committee Co-chair of Advisory Committee
_______________________________ _______________________________
Dr. William Oxenham Dr. Kavita Mathur
ii
Dedication
This work is dedicated to my people and my nation, a nation that has been suffering for a long time from oppression, ignorance, and misguidance. I hope that the experience which I’ve
gained throughout my career and my Ph.D. study would help me change their unfortunate reality, and make a tangible difference in their lives.
This work is also dedicated to the soul of my beloved grandmother, who always inspired me with her generosity, humbleness, and beautiful speech. My dad, who taught me the real purpose of life, and the importance of the family, and the value of maintaining balance in this life. My mum, my joy and my childhood, no words can describe her patience, persistence and dedication. My 2 brothers and 2 sisters (my gang), who were always by my side, and with whom I never felt alone even when I’m away from home.
To my beloved wife Wessam Elmalky, who went with me through all the ups and downs in this life, she is not just my wife, she is my soul mate, my best friend, and my counselor. To my daughter Jury, and my son Zaineldeen, for bearing the burden of traveling and leaving their comfort life, and showing resilience and ability to adapt with changing situations.
iii
Biography
Mohamad Samir Midani was born in Cairo –Egypt in 1983. He descends from a famous Syrian family, who runs a textile business in Egypt since 1960. He grew up around the textile mills, where he started building his passion for textile materials, machines, and products.
He earned his Bachelor of Science degree in Mechanical Engineering, with a major in Design and Production, and was awarded a 3rd class honor, from Ain Shams University in Cairo – Egypt in 2006. After graduation Mohamad joined his family business, he worked in different positions, and different function groups, such as technical sales, process improvement, and management systems.
In 2010 Mohamad moved to Raleigh, NC to start his textiles study, and earned his Master degree in Textiles Technology and Management, from the College of Textiles, NC State University in 2012. After graduation, Mohamad worked as a product development engineer in the textile industry in Egypt for a year and a half.
iv
Acknowledgements
I would like to express my sincere gratitude to everyone who helped me throughout my Ph.D. study. I was fortunate to have a great advisory committee, who provided me with continuous guidance and support. I’m grateful to my advisor Dr. Seyam for his sponsorship, guidance, trust and motivation, surely he treated me like a son, and I’m proud of being his son in academia. I’m thankful to my committee’s co-chair Dr. Pankow for his valuable inputs and
feedback, I would also like to extend my sincere thanks to Dr. Oxenham, Dr. Mathur, and Dr. Bourham.
I’m grateful to PPG industries for their generous donation of the E-glass rovings, and Ashland
Inc. for donating the Vinylester resin. I greatly appreciated, the help of Mehmet Ince in weaving the 3D preforms, and Karim Aly in the resin infusion. Great thanks to NC State University, College of Textiles, and the Graduate School, for providing great learning, skills building, and research resources.
Thanks are due to my dad Samir Elmidany, and my aunt Iman Elmidany for their generous and continuous financial support.
v
Table of Contents
List of Tables ... ix
List of Figures ... x
1. INTRODUCTION... 1
1.1. Reinforcement Forms (Preforms) ... 3
1.1.1. Woven fabrics ... 4
2. LITERATURE REVIEW ... 11
2.1. Analytical Modeling of the Mechanical Behavior of 3DOW Composites ... 11
2.1.1. Modeling the woven preform structure ... 11
2.1.2. Modeling the load-extension behavior of woven preforms ... 15
2.1.3. Modeling mechanical behavior of 3DOW composites... 18
2.2. Effect of the Z-Yarn on the In- and Out-of-Plane Performance of 3DOW Composites ... 29
2.3. Response of 3DOW Composites under Different Modes of Impact and their Relationship ... 44
2.3.1. Flexed beam tests ... 45
2.3.2. Flexed plate impact testing ... 45
3. OBJECTIVES ... 48
4. GENERALIZED MODEL FOR THE LOAD-EXTENSION BEHAVIOR OF 3DOW COMPOSITES ... 51
4.1. Generalized Load-Extension Model of 3DOW Preforms ... 51
4.1.1. Nomenclature ... 53
4.1.2 Geometrical model of general weaves ... 55
vi
4.2. Generalized Load-Extension Model of 3DOW Composites ... 64
4.2.1. Hamburger theory of blended yarns ... 65
4.2.2. Volume fraction of yarns and matrix components ... 66
4.3. Numerical Example ... 67
4.3.1. Load-extension properties of unit structure A and B of Z-yarn ... 68
4.3.2. Load-extension properties of X- and Y-yarns ... 72
4.3.3. Load-extension properties of the preform ... 73
4.3.4. Load-extension properties of the composite ... 73
4.4. Experimental Verification of the Model... 76
4.4.1. Composite tensile test ... 76
4.5. Numerical parametric study ... 112
4.5.1. Effect on composite peak load ... 114
4.5.2. Effect on Z stretch ratios ... 118
4.6. Conclusion ... 120
5. EXPERIMENTAL ... 122
5.1. Materials ... 122
5.1.1. Fibers ... 122
5.1.2. Resin and curing agents ... 123
5.2. Experimental Design ... 126
5.2.1. Design of experiment A ... 126
5.2.2. Design of experiment B ... 127
5.3. Preforms Formation ... 127
5.3.1. Weaving non-interlaced preforms ... 130
5.4. Resin Infusion ... 131
vii
5.5.1. Tensile test ... 135
5.5.2. Tup impact test ... 135
5.5.3. Charpy impact test ... 136
5.5.4. Izod impact test ... 136
5.5.5. Measuring the fiber volume fraction ... 136
5.6. Statistical Analysis... 136
5.7. Sampling ... 137
6. RESULTS AND DISCUSSION ... 139
6.1. Experiment A ... 139
6.1.1. Main effects of structural parameters on impact resistance ... 141
6.1.2 Correlation between different modes of impact ... 171
6.1.3. Conclusion on Experiment A ... 206
6.2. Experiment B ... 208
6.2.1 Effect of Z: Y-yarn/ layer ratio on mechanical properties ... 208
6.2.2. Failure analysis ... 229
6.2.3. Conclusion on Experiment B ... 238
7. OVERALL CONCLUSION AND SUGGESTION FOR FUTURE STUDIES ... 241
REFERENCES ... 246
APPENDICES ... 253
APPENDIX A: Statistical analysis of Tup impact energy for Experiment A ... 254
APPENDIX B: Statistical analysis of Izod impact energy in Y-axis direction for Experiment A ... 270
APPENDIX C: Statistical analysis of Izod impact energy in X- axis direction for Experiment A ... 286
viii
APPENDIX E: Statistical analysis of Charpy impact energy in X- axis direction for
Experiment A ... 318
APPENDIX F: Statistical correlation between impact energies of Tup, Izod, and Charpy impact tests of all samples for Experiment A ... 334
APPENDIX G: Statistical correlation between impact energies of Tup, Izod, and Charpy impact tests of plain samples for Experiment A ... 338
APPENDIX H: Statistical correlation between impact energies of Tup, Izod, and Charpy impact tests of twill samples for Experiment A ... 342
APPENDIX I: Statistical correlation between impact energies of Tup, Izod, and Charpy impact tests of basket samples for Experiment A ... 346
APPENDIX J: Statistical correlation between impact energies of Tup, Izod, and Charpy impact tests of balanced samples for Experiment A ... 350
APPENDIX K: Statistical analysis of tensile results from Experiment B ... 354
APPENDIX L: Statistical analysis of Tup impact results from Experiment B ... 368
APPENDIX M: Statistical analysis of Izod impact results from Experiment B ... 373
APPENDIX N: Statistical analysis of Charpy impact results from Experiment B ... 383
ix
List of Tables
Table 1 Structure of sample preform ...67
Table 2 3DOW composites specifications ...77
Table 3 Weaves considered for the parametric study ...113
Table 4 Fixed parameters used in the parametric study ...114
Table 5 Warp, weft, and binder yarns specifications ...122
Table 6 Typical liquid resin properties of Derakane® 8084 ...123
Table 7 Typical properties of post cured Derakane® 8084 resin clear casting ...124
Table 8 Typical properties of initiator (NOROX® MEKP-925H) ...124
Table 9 Typical gel times for Derakane® 8084 Resin ...125
Table 10 Design of experiment A ...127
Table 11 Design of experiment B ...127
Table 12 List of mechanical tests on final composite structures...133
Table 13 Experiment A samples ID and their variable parameters ...140
Table 14 Tup impact results [59] ...141
Table 15 Izod impact results in Y-axis direction ...146
Table 16 Izod impact results in X-axis direction ...147
Table 17 Type of breaks in Izod impact specimens according to ASTM D256 ...148
Table 18 Charpy impact results in Y-axis direction ...154
Table 19 Charpy impact results in X-axis direction ...155
Table 20 Experiment B samples ID and their variable parameter ...208
Table 21 Tup impact results ...209
Table 22 Tensile test results in Y-axis direction ...213
Table 23 Tensile test results in X-axis direction ...213
Table 24 Izod impact results in Y-axis direction ...219
Table 25 Izod impact results in X-axis direction ...219
Table 26 Charpy impact results in Y-axis direction ...224
x
List of Figures
Figure 1 Composites classification based on the dispersed phase [1] ... 2
Figure 2 Composites classification based on the matrix phase [1] ... 2
Figure 3 (Left) Cross section image (right) and surface image (left) of a woven fabric from spun yarns [8] ... 5
Figure 4 Tensile stress-strain curve of a woven fabric [9] ... 6
Figure 5 Classification of 3D woven fabrics [13] ... 7
Figure 6 Illustration of conventional 2D weaving principle, (a) 2D fabric, (b) 3D angle interlock fabric [16] ... 8
Figure 7 3D Through-thickness angle interlock weave [16]... 8
Figure 8 3D orthogonal woven fabric [16] ... 9
Figure 9 Peirce's circular cross section geometry of plain weave fabrics [18] ... 12
Figure 10 Peirce's approximate treatment of flattened yarn geometry of plain weave fabrics [18]... 13
Figure 11 Kemp's racetrack section geometry of plain weave fabric [18]... 13
Figure 12 Hearle's lenticular geometry, (a) plain weave fabric, (b) yarn lenticular C.S. [18]14 Figure 13 Seyam and Elsheikh’s geometry of woven fabric, warp C.S. (left), and filling C.S. (right) [23] ... 15
Figure 14 Straight lines approach used to represent the woven fabric used by Sun et al. [28] ... 16
Figure 15 Repeat of one yarn structure in the warp direction [28] ... 17
Figure 16 Schematic diagram of one construction repeat of a woven fabric [28] ... 17
Figure 17 Repeat along the warp axis, showing unit structures A and B [28] ... 18
Figure 18 Nagai et al. unit cell (a) 3DOW constituents, (b) Infinitesimal volume element in the 3D anisotropic space. [30] ... 21
Figure 19 Cox and Dadkhah 3DOW composite geometry [33]... 22
Figure 20 Kou & Pon unit cell for 3DOW composite (a) Straight yarns, (b) undulated yarns [34]... 23
Figure 21 Schematic of Tan et al. (a) X-model, (b) Y-model, and (c) Z-model [36] ... 24
xi
Figure 23 Wu et al. 3DOW composite unit cell discretization [40] ... 26
Figure 24 Chen et al. simplified unit cell for 3DOW composite [43] ... 27
Figure 25 Pankow et al. representative unit cell of 3DOW composite [45] ... 28
Figure 26 Schematic diagram of Leong 3DOW structure [46] ... 30
Figure 27 Warp cross sections of the 3DOW performs, (a) normal structure, and (b) modified structure [46] ... 30
Figure 28 Schematic diagram showing crimping of the warp yarn due to high tension of the binder yarn [46] ... 31
Figure 29 Rao et al. schematic representation of the 3DOW architecture, (a) plan view, (b) front cross sectional view, and the (c) detail of the modified unit cell [47] ... 32
Figure 30 Schematic of the structures investigated by Mouritz et al., (a) 3DOW structure, (b) 3D angular interlock structure, (c) quasi-isotropic stitched structure, and (d) pinned structure [48] ... 34
Figure 31 Schematic of different 3D woven structures, (a) layer-to-layer, (b) angle-interlock, and (c) orthogonal [49] ... 35
Figure 32 Crimp analysis of 3D woven structures [49] ... 36
Figure 33 Bilisik et al. 3D woven structures using different insertion mechanisms, (a) pin insertion, (b) shuttle insertion, and (c) single rapier insertion [50] ... 37
Figure 34 3D nonwoven carbon fiber needle punched web [51] ... 39
Figure 35 Stacked laminate of multi-layer plain woven preforms, Z-stitched in the through thickness direction [51] ... 39
Figure 36 Dhiman representative volume element of 3DOW, (a) structure 1, and (b) structure 2 [52]... 41
Figure 37 Hexagonal packing of individual fibers within the carbon tows [51] ... 41
Figure 38 Dai et al. 3DOW structures with varying Z-yarn architecture, (a) W-1 plain 1x1, (b) W-2.1 3x3 weave, (c) W-2.2 3x3 weave, and (d) W-2.3 3x3 weave [53] ... 43
Figure 39 Schematic diagram of (a) Charpy, (b) Izod impact equipment [55] ... 45
Figure 40 Schematic diagram of flexed plate impact testing [55] ... 46
Figure 41 Force-time diagram (left) and energy- time diagram (right) [54] ... 46
xii
Figure 43 Kawabata’s unit structure at weave intersection in the deformed state [24] ... 53
Figure 44 Schematic diagram of one construction repeat of 3DOW preform ... 57
Figure 45 Repeat of one yarn structure in the Y-direction for (a) rectangular yarn cross section, and (b) circular yarn cross section... 58
Figure 46 Z-yarn unit structure A subjected to biaxial loading ... 60
Figure 47 Effect of stress strain characteristics on blend strength [62] ... 65
Figure 48 Tensile properties of the yarns used ... 68
Figure 49 Graph for solving Fc ... 69
Figure 50 Average resistance to compression of Z-and X-yarns ... 69
Figure 51 The parameter Fc for uniform biaxial extension ... 70
Figure 52 Relation between Fz and λAz ... 70
Figure 53 Relation between Fz and λBz ... 71
Figure 54 Relation between Fz and λz ... 72
Figure 55 Relation between Fx (Fy) and λx (λy)... 72
Figure 56 Preform resultant tensile properties in y-axis direction for one structural repeat . 73 Figure 57 Tensile properties of Vinylester matrix at different fiber volume fractions for one structural repeat ... 74
Figure 58 Composite tensile properties in Y-axis direction for one structural repeat ... 75
Figure 59 Composite tensile properties in X-axis direction for one structural repeat ... 75
Figure 60 Yarn vs. fiber tensile properties for, (a) Spectra, (b) Vectran, (c) Zylon, (d) E-glass ρl =275 tex, (e) E-glass ρl =735 tex, and (f) E-glass ρl =2400 tex [63] ... 78
Figure 61 Experimental vs. model tensile load-strain for 3DOW plain E-glass composite with 2.44 picks/ cm in X- and Y-axis directions, (a) 4 layers, (b) 3 layers, and (c) 2 layers. ... 80
Figure 62 Experimental vs. model tensile load-strain for 3DOW 2x2 Twill E-glass composite with 2.44 picks/ cm in X- and Y-axis directions, (a) 4 layers, (b) 3 layers, and (c) 2 layers. ... 83
xiii
Figure 64 Experimental vs. model tensile load-strain for 3DOW plain E-glass composite with 2.74 picks/ cm in X- and Y-axis directions, (a) 4 layers, (b) 3 layers, and (c) 2 layers. ... 89 Figure 65 Experimental vs. model tensile load-strain for 3DOW 2x2 Twill E-glass
composite with 2.74 picks/ cm in X- and Y-axis directions, (a) 4 layers, (b) 3 layers, and (c) 2 layers. ... 92 Figure 66 Experimental vs. model tensile load-strain for 3DOW 2x2 Basket E-glass
composite with 2.74 picks/ cm in X- and Y-axis directions, (a) 4 layers, (b) 3 layers, and (c) 2 layers. ... 95 Figure 67 Experimental vs. model tensile load-strain for 3DOW plain E-glass composite
with 2.925 picks/ cm in X- and Y-axis directions, (a) 4 layers, (b) 3 layers, and (c) 2 layers. ... 98 Figure 68 Experimental vs. model tensile load-strain for 3DOW 2x2 Twill E-glass
composite with 2.925 picks/ cm in X- and Y-axis directions, (a) 4 layers, (b) 3 layers, and (c) 2 layers. ... 101 Figure 69 Experimental vs. model tensile load-strain for 3DOW 2x2 Basket E-glass
composite with 2.925 picks/ cm in X- and Y-axis directions, (a) 4 layers, (b) 3 layers, and (c) 2 layers. ... 104 Figure 70 Experimental vs. model tensile load-strain for 3DOW plain hybrid composites in
X- and Y-axis directions, (a) Spectra, (b) Vectran, and (c) Zylon. ... 107 Figure 71 Tensile specimen showing retroreflective tape used for laser extensometer strain
measurements ... 111 Figure 72 The effect of the Z-yarn weave factor and linear density on the peak load of the
composite in the Y-axis direction. ... 115 Figure 73 The effect of the Z-yarn weave factor and linear density on the peak load of the
composite in the X-axis direction ... 116 Figure 74 The effect of number of Y-yarn layers, and X-yarn pick density on the peak load
of the composite in the Y-axis direction ... 117 Figure 75 The effect of number of Y-yarn layers, and X-yarn pick density on the peak load
xiv
Figure 77 The effect of Y-yarn number of layers on Z stretch ratios ... 119 Figure 78 The effect of X-yarn pick density on Z stretch ratios ... 120 Figure 79 3D weaving loom donated by 3TEX Inc ... 128 Figure 80 Denting plan for a 3 layers preform at various Z- to Y-yarns/ Y-layer ratios (a)
1:1, (b) 2:3, (c) 1:3, (d) 0:1 ... 129 Figure 81 Woven preforms at various Z- to Y-yarns/ Y-layer ratios (a) 1:1, (b) 2:3, (c) 1:3,
(d) 0:1 ... 130 Figure 82 Non-interlaced 3DOW preform, (a) with supporting Z-yarns, and (b) Supporting
Z-yarns removed ... 131 Figure 83 Consolidation using VARTM technique, (a) VacMobiles® vacuum pump, (b)
vacuum bagging assembly ... 132 Figure 84 Specimens from the produced composites for design of experiment B ... 133 Figure 85 MTS Servo hydraulic 370 load frame for tensile testing ... 134 Figure 86 Instron impact testing equipment, (a) drop tower impact CEAST 9350, and (b)
pendulum impactor II ... 134 Figure 87 Specimens sampling plan ... 137 Figure 88 High precision waterjet cut composite panels ... 138 Figure 89 Typical punctured Tup impact specimen, (a) Front view, (b) back view, and (c)
side view ... 142 Figure 90 Types of breaks in Izod impact specimens ... 148 Figure 91 Types of breaks in Charpy impact specimens ... 156 Figure 92 Main effect of number of layers on impact energy, (a) Y-direction, and (b)
X-direction ... 163 Figure 93 Main effect of yarn density on impact energy, (a) Y-direction, and (b)
X-direction ... 163 Figure 94 Main effect of weave pattern on impact energy, (a) Y-direction, and (b)
X-direction ... 164 Figure 95 Main effect of (a) specimen direction, and (b) impact mode, on impact energy . 164 Figure 96 Main effect of number of layers on impact energy normalized by composite
xv
Figure 97 Main effect of X-yarn density on impact energy normalized by composite
thickness, (a) Y-direction, and (b) X-direction ... 165 Figure 98 Main effect of weave pattern on impact energy normalized by composite
thickness, (a) Y-direction, and (b) X-direction ... 166 Figure 99 Main effect of (a) specimen direction, and (b) impact mode, on impact energy
normalized by composite thickness ... 166 Figure 100 Main effect of number of layers on impact energy normalized by composite areal
density, (a) Y-direction, and (b) X-direction ... 167 Figure 101 Main effect of X-yarn density on impact energy normalized by composite areal
density, (a) Y-direction, and (b) X-direction ... 167 Figure 102 Main effect of weave pattern on impact energy normalized by composite areal
density, (a) Y-direction, and (b) X-direction ... 168 Figure 103 Main effect of (a) specimen direction, and (b) impact mode, on impact energy
normalized by composite areal density ... 168 Figure 104 Main effect of number of layers on impact energy normalized by preform areal
density, (a) Y-direction, and (b) X-direction ... 169 Figure 105 Main effect of X-yarn density on impact energy normalized by preform areal
density, (a) Y-direction, and (b) X-direction ... 169 Figure 106 Main effect of weave pattern on impact energy normalized by preform areal
density, (a) Y-direction, and (b) X-direction ... 170 Figure 107 Main effect of (a) specimen direction, and (b) impact mode, on impact energy
normalized by preform areal density ... 170 Figure 108 Impact energies of plain weave samples in, (a) Y-axis direction, and (b) X-axis
direction ... 175 Figure 109 Impact energies normalized by composite thickness of plain weave samples in,
(a) Y-axis direction, and (b) X-axis direction ... 177 Figure 110 Impact energies normalized by composite areal density of plain weave samples
in, (a) Y-axis direction, and (b) X-axis direction ... 179 Figure 111 Impact energies normalized by preform areal density of plain weave samples in,
xvi
Figure 112 Impact energies of twill weave samples in, (a) Y-axis direction, and (b) X-axis direction ... 183 Figure 113 Impact energies normalized by composite thickness of twill weave samples in,
(a) Y-axis direction, and (b) X-axis direction ... 185 Figure 114 Impact energies normalized by composite areal density of twill weave samples
in, (a) Y-axis direction, and (b) X-axis direction ... 187 Figure 115 Impact energies normalized by preform areal density of twill weave samples in,
(a) Y-axis direction, and (b) X-axis direction ... 189 Figure 116 Impact energies of basket weave samples in, (a) Y-axis direction, and (b) X-axis
direction ... 191 Figure 117 Impact energies normalized by composite areal density of basket weave samples
in, (a) Y-axis direction, and (b) X-axis direction ... 193 Figure 118 Impact energies normalized by composite areal density of basket weave samples
in, (a) Y-axis direction, and (b) X-axis direction ... 195 Figure 119 Impact energies normalized by preform areal density of basket weave samples in, (a) Y-axis direction, and (b) X-axis direction ... 197 Figure 120 Impact energies of balanced samples in, (a) Y-axis direction, and (b) X-axis
direction ... 199 Figure 121 Impact energies normalized by composite thickness of balanced samples in, (a)
Y-axis direction, and (b) X-axis direction ... 201 Figure 122 Impact energies normalized by composite areal density of balanced samples in,
(a) Y-axis direction, and (b) X-axis direction ... 203 Figure 123 Impact energies normalized by preform areal density of balanced samples in, (a)
Y-axis direction, and (b) X-axis direction ... 205 Figure 124 Tup impact, (a) peak loads, and (b) typical load - deflection curves ... 211 Figure 125 Tup impact energy in X- and Y- directions, (a) non-normalized, (b) normalized
by composite thickness, (c) by composite areal density, and (d) by preform areal density ... 212 Figure 126 Tensile properties in X- and Y-directions, (a) peak load, (b) failure strain, (c)
xvii
Figure 128 Normalized tensile load in X- and Y-directions, (a) by composite thickness, (b) by composite areal density, (c) by preform areal density, and (d) total fiber Tex ... 218 Figure 129 Izod impact energy in X- and Y-directions, (a) non-normalized, (b) normalized
by composite thickness, (c) by composite areal density, (d) by preform areal density, and (e) by total fiber Tex ... 221 Figure 130 Charpy impact energy in X- and Y-directions, (a) non-normalized, (b)
normalized by composite thickness, (c) by composite areal density, (d) by preform areal density, and (e) by total fiber Tex ... 226 Figure 131 Failure analysis of typical Tup impact specimens, showing 3 different views . 231 Figure 132 Effect of Z: Y-yarn/ layer ration on delamination area ... 232 Figure 133 Failure analysis of typical tensile specimens in, (a) Y-direction, and (b)
X-direction ... 234 Figure 134 Failure analysis of typical Izod impact specimens in, (a) Y-direction, and (b)
X-direction ... 236 Figure 135 Failure analysis of typical Charpy impact specimens in, (a) Y-direction, and (b)
1
1. INTRODUCTION
Conventional engineering materials are usually classified into, metals, ceramics, and polymers. However, each of these single phase materials, has their advantages and disadvantages, which dictate their end use and applications. For instance, metals are heavy but they are favored for their high strength and toughness, also ceramics are brittle, but they are favored for strength and thermal resistance, as for conventional polymers, they have low strength, but they are favored for ductility and light weight. Nowadays, modern technologies and industries requirements are pushing towards more innovation in materials offerings, since those single phase materials are no longer meeting their performance criteria. For instance, in the aerospace industry there is an ongoing demand for lighter, stronger, and stiffer materials, with higher abrasion, corrosion, and impact resistance. Such requirements can’t be satisfied by using a single phase material, for example, if metal is used to increase strength, this has to be accompanied by an increase in weight and decrease in ductility, due to the nature and limitations of metals [1].
Thus, there was a need to selectively combine features and attributes from specific materials and engineer them into a new class of materials called composite materials. Composite materials, contains two or more constituent materials that have different chemical and physical properties, and they remain distinct within the final composite. This combination of materials results in a material with properties superior to that of their constituents due to the synergetic effect taking place. A good example to illustrate this synergetic effect, is a glass fiber reinforced plastic, where short strands of glass fibers are embedded in a polymer matrix, thus, while glass fibers provide strength and stiffness, the polymer matrix provide increased ductility and weight reduced density of the final composite structure. Although composite materials are multi-phase materials, yet they still respond to external effects such as physical, mechanical, and environmental effects as a single unified material [2, 3].
2
Figure 1 Composites classification based on the dispersed phase [1]
Composite materials can also be classified based on the matrix phase as illustrated in Figure 2.
Figure 2 Composites classification based on the matrix phase [1]
The most commonly used matrix phase in composites, is the polymer matrix, they could either be thermoplastic, or thermoset polymer matrix. The type of interaction between the polymer molecules is what dictates whether it’s a thermoset or a thermoplastic, for instance, if the polymer has strong intermolecular covalent bonds in the backbone of the polymer then it’s a thermoset, whereas, if it has a weak secondary bonding then it’s a thermoplastic. One of the advantages of thermoset polymers, is that it’s generally liquid at room temperature, and it could infiltrate or impregnate the reinforcement in the liquid form. Thermosets solidifies or cure through cross linking, which is a chemical reaction that results in crosslinks between the
Composites
Particle-reinforced
Large particle
Dispersion strengthened
Fiber-reinforced
Continious (aligned)
Discontinious (short)
Aligned Randomly
oriented
Structural
Laminates Sandwich
panels
Composites
Metal matrix composites
Ceramic matrix composites
Polymer matrix composites
Thermoplastic polymers
3
polymer molecules, unlike thermoplastic polymers which melt by heating and solidify by cooling. The crosslinking resulting from curing thermosets, have a unique interconnected 3D network structures, which have very high molecular weight. The high molecular weight crosslink networks, increase the melting temperature of the polymer beyond its degradation point. This leads to a major distinction between the thermosets and the thermoplastics, which is thermosets char by increasing temperature instead of melting, while thermoplastics melt as temperature increases [3].
The science of composite material is broad and diverse, which can be clearly seen from the above classifications. However, the scope of work of this research is limited to fiber reinforced polymer composites, using continuous or staple aligned fibers as the dispersed phase, and thermoset polymer as the matrix phase.
One of the main design considerations when designing fiber reinforced polymer composites, is the strength to weight ratio, and the stiffness to weight ratio, which is referred to as specific strength and specific stiffness. The specific properties of the composite are calculated by normalizing (dividing) the composite properties by its density, and since the fibers and the matrix used in fiber reinforced polymer composites have low density and high strength, thus the resulting composite would have high specific strength and stiffness [1, 3].
1.1. Reinforcement Forms (Preforms)
The form of fiber reinforcement used in composites, which is also known as preform in the composite field, comes in different forms, such as fibers, yarns, mats, woven fabrics and knitted fabrics. The reinforcement form or the preform along with the manufacturing techniques, dictates the final properties of the composite material. It’s also worth mentioning that the type of preform used also dictates the processing technique. This means that knowledge of preform structure is a perquisite for understanding and predicting the mechanical behavior of the produced composites.
4
fiber reinforcements are mostly textile technologies, such as nonwoven, weaving, braiding, and knitting technologies [4].
The eighties and the nineties have witnessed a great interest in composite research and development. Langley Research Center, which was part of NASA Advanced Composites Technology program, was leading the way in researching and investigating textile structures for composite reinforcement. The main focus of NASA’s research program was to produce structural parts for passenger’s aircrafts, such as wings and fuselage, using textile reinforcement due to their favored damage tolerant internal structure that is much better than tape laminates [5, 6].
Textiles reinforcements from yarns such as woven and knitted fabrics have numerous advantages, one of which is the ease of handling and transportation with limited distortion to the preform structure, this unique feature is due to the inter fiber friction resulting from the yarns interlacement which produce more cohesive preforms. With the recent developments in textile technologies, preforms can be produced in near-net-shape form, which means that the preform has a very similar shape to that of the final composite product, eliminating waste, machining, and the need for parts assembly that usually involves weaker joints formation using bolts or adhesive [7].
1.1.1. Woven fabrics
In order to understand the mechanical behavior of the composites with textile reinforcement, it’s important to have a sound knowledge of the structure and mechanics of the textile reinforcement phase first.
Woven fabrics are considered the feedstock for different industries such as clothing, composites and technical textiles. The study of fabric mechanics under stress is of utmost importance, as it dictates how this fabric will perform in subsequent end uses. However, the study of the woven fabric mechanics is not as easy as studying the mechanics of isotropic homogeneous structures, due to the anisotropic nature of the woven fabric that result in a more sophisticated behavior [8].
5
material could be easily deformed and they experience high strain percentage even at low stresses, they are nonlinear and plastic at such low level of stresses [8].
2D woven fabrics
Woven fabrics have an extremely complicated geometrical structure; Figure 3 shows a cross sectional and a surface image of a woven fabric from spun yarns. It’s obvious that individual yarns inside the fabric are crimped. Furthermore, if the fabric is composed of spun yarns, the geometrical complication increases, due to the irregular nature of the spun yarns, as shown in Figure 3 [8].
Figure 3 (Left) Cross section image (right) and surface image (left) of a woven fabric from spun yarns [8]
The woven fabric is composed of a set of warp yarns and a set of weft yarns orthogonally interlacing. This interlacing holds the structure together by friction between the yarns and fibers. The interlacing design (or woven fabric design) contributes significantly to the amount of inter fiber/yarn friction and to the fabric properties. The distance between two adjacent yarns and the spaces within fibers in the yarns result in the porosity of the fabric. This porosity is what makes a porous fabric different from a continuum engineering structure.
6
crimped yarn within the fabric, which result in a very low initial tensile modulus when compared to engineering materials [9].
Figure 4 Tensile stress-strain curve of a woven fabric [9]
Woven fabrics are also prone to bending deformations under transverse loading; assuming that slippage between fibers is not constrained. When comparing the yarn bending stiffness with that of a solid rod of same cross section, it’s obvious that the yarn would have greater flexibility since it is composed of numerous fine constituent fibers. Moreover, 2D woven fabrics usually have very small thickness which results in a further lower bending stiffness [10].
7
the fabric starts to exhibit a more linear stress strain behavior which is similar to solid engineering materials [10].
3D woven preforms
Three-dimensional (3D) woven preforms are fabrics that could be formed to near net shape with considerable thickness. There is no need for layering to create a 3D part, because a single fabric provides the full 3D reinforcement. The 3D weaving process is a variant of the 2D weaving process and it’s an extension of the very old technique of creating double and triple woven cloth. 3D weaving allows the production of fairly thick fabrics [11].
In 3D orthogonal woven fabrics, yarns placed in thickness direction are called z-yarns, warp weaver, or binder yarns. More than one layer of fabric is woven at the same time, and z-yarns interlace warp and weft yarns of different layers during the process. At the end of the weaving process, an integrated 3D woven structure, which has a considerable thickness, is produced [12].
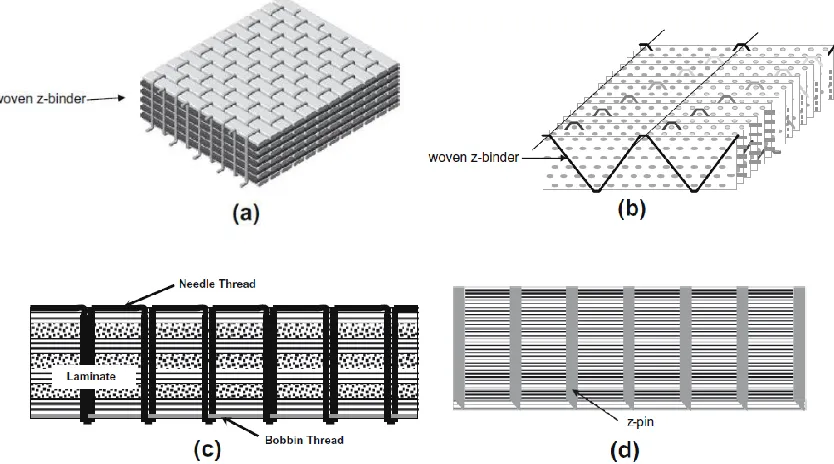
There are several types of 3D woven fabrics that are commercially available; they could be classified according to their weaving technique as shown in Figure 5 [13]. The first type is the 3D woven angular interlock fabrics, which are fabrics produced on a traditional 2D weaving loom, using proper weave design and techniques, it could either have the weaver or z-yarn going through all the thickness of the fabric or from layer to layer as illustrated in Figures 6 and 7 [14, 15].
Figure 5 Classification of 3D woven fabrics [13]
2D weaving
2D fabrics
3D angle
interlock fabrics
Through-thickness
Layer to layer
3D weaving
8
Figure 6 Illustration of conventional 2D weaving principle, (a) 2D fabric, (b) 3D angle interlock fabric [16]
9
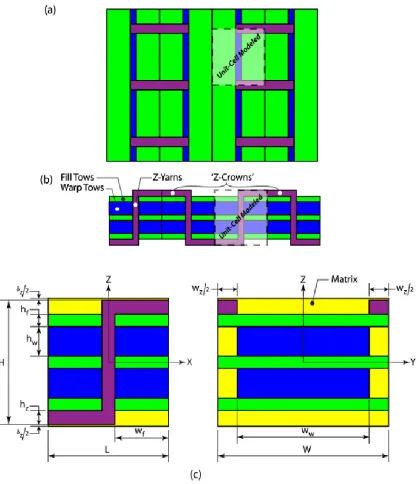
The second type is 3D orthogonal woven fabrics, which are produced on a special 3D weaving loom. The process to form such fabric was patented by Mohamed and Zhang [17]. The architecture of the 3D orthogonal woven fabric consists of three different sets of yarns; warp yarns (y-yarn), weft yarns (x-yarn), and (z-yarn). Z-yarn is placed in the through-thickness direction of the preform. In 3D orthogonal woven fabric there is no interlacing between warp and weft yarns and they are straight and perpendicular to each other. On the other hand, z-yarns combine the warp and the weft layers by interlacing (moving up and down) along the y-direction over the weft yarn. The interlacing is performed from surface to surface, through the entire thickness of the preform as illustrated in Figure 8 [14, 15].
10
11
2. LITERATURE REVIEW
The scope of this research is limited to fiber reinforced composites, with 3D Orthogonal Woven (3DOW) fabrics as the reinforcement, and thermoset resin as the matrix. It involves analytical modeling of the mechanical behavior of the 3DOW composites, effect of Z-yarn on the in-plane and out-of-plane properties, and the relation between the different impact loading modes on the properties of the final composite. This chapter is a critical review of current and prior relevant research in these areas.
2.1. Analytical Modeling of the Mechanical Behavior of 3DOW Composites 2.1.1. Modeling the woven preform structure
The structure of woven fabrics has a very strong influence on their mechanical properties and behavior, for example, when a 2D woven fabric is stretched in the warp direction; it results in a contraction in the weft direction and an increase in the weft yarn crimp and decrease in warp crimp (crimp interchange). Therefore, it’s important to study the fabric geometry to understand the relationship between the different geometrical parameters such as crimp, weave angle, thread spacing, etc. Furthermore, this understanding will help in the prediction of the mechanical properties by combining fabric geometry with yarn properties [18].
Fabrics are not regular structure that could be described in geometrical mathematical forms; however, it’s possible to simplify the general characteristics of the woven fabrics into simple geometrical forms and physical parameters.
12
C.S. model, Peirce’s elliptical C.S. model, Kemp’s race track C.S. model, Hearle et al’s Lenticular C.S. model, and Seyam and Elsheikh’s geometric model for jammed structures. In 1937, Peirce published a model about plain weave fabrics. His model was based on the assumptions that the yarns are uniform cylinders, inextensible, and completely flexible. The unit cell of plain weave (or half weave repeat) of Figure 9 depicts the Peirce geometry. The geometry of the unit cell was built by superimposing linear and circular yarn segments to produce the geometry that fit the assumptions. It was then possible to derive relationships between the geometrical parameters such as; yarn diameter, yarn length, thread spacing, weave crimp, weave angle and fabric thickness. Peirce’s model has been very useful in the ordering and interpretations of the observations. Peirce’s assumptions were especially valid in very open structures [19], and his geometry was very useful in predicting the maximum construction of woven fabrics [20]. However, his assumptions of circular cross section, uniformity of structure in longitudinal direction and incompressibility were not always valid [18].
Figure 9 Peirce's circular cross section geometry of plain weave fabrics [18]
13
Figure 10 Peirce's approximate treatment of flattened yarn geometry of plain weave fabrics [18]
In 1958 kemp proposed the race track cross sectional shape, which consisted of a rectangle enclosed by two semi-circles, and it had the advantage of using the simple relation of Peirce’s circular thread geometry as illustrated in Figure 11. In 1978 Hearle et al. proposed a more accurate and general mathematical model that considered the thread cross section to be lenticular as illustrated in Figure 12 [18, 21, 22]. While the assumption that yarn cross section is non-circular (elliptical, racetrack, or lenticular) is closer to practical yarn shape in open and medium tight fabrics, this requires information about the dimensions of the cross section geometry such as minor and major diameters in elliptical cross section as an example. Unfortunately, the cross section dimensions of non-circular yarns are not constant and varies with the degree of tightness of the fabric. Research is required to establish relationships of yarn cross section dimensions and degree of fabric tightness [28].
14
Figure 12 Hearle's lenticular geometry, (a) plain weave fabric, (b) yarn lenticular C.S. [18]
15
Figure 13 Seyam and Elsheikh’s geometry of woven fabric, warp C.S. (left), and filling C.S. (right) [23]
The structural parameters of the woven fabric could be derived from these geometric theories, and by combining the structural parameters with the yarns properties, the mechanical behavior of the woven fabric could be predicted. Thus, understanding the effect of fabric geometry on its mechanical properties is a perquisite for developing fabrics with the right combination of engineering characteristics.
2.1.2. Modeling the load-extension behavior of woven preforms
16
In 1973 Kawabata et al. developed a model to predict the load-extension behavior of 2D plain and 2x2 twill woven fabric, using finite-deformation theory, where the yarns are represented as straight line segments [24-26]. The parameters considered in this model, are the lateral yarn compression, and the measured nonlinear yarn tensile properties. However, this model didn’t consider the effect of yarn bending stiffness, which was introduced later as an improvement to the model [27]. This model could accurately predict the properties of plain woven fabric, if the correct yarn properties are used. Later, Kawabata et al. applied a method of analysis, to predict the uniaxial and biaxial tensile behavior of plain woven fabrics subjected to large deformations [24-26].
The unique advantage of this model is that it’s nonlinear and it could predict the entire load-extension curve of the plain woven fabric, from small strains region to the finite deformation region near the breaking strain. This model is partially based on an empirical approach, which rely on measured yarn properties to predict the load-extension properties of woven fabric which is nonlinear in nature, and that’s why this approach is more realistic than other approaches.
In 1995 Sun et al. [28] proposed a generalized model, based on Kawabata’s work. The model is also simple and can predict the entire load-extension curve of any woven fabric. Sun et al. adopted the simple straight line geometry used by Kawabata as shown in Figure 14, and despite that it doesn’t simulate the actual geometry, but it still predicts results that are in good agreement with experimental values.
17
Kawabata’s work was limited to plain weave and 2x2 Twill weave, thus one of the important modifications that Sun et al. did to this model, was generalizing it to be applicable to any weave construction and degree of tightness. The model included a factor that represents the weave and considers the yarn interlacing. The model also considered hybrid woven fabric comprising, more than one kind of warp or filling yarn, as well as variable thread spacing as shown in Figure 15 and 16. They also considered 2 modes of loading, uniaxial and bi-axial loading.
Figure 15 Repeat of one yarn structure in the warp direction [28]
18
Under tensile loading, the model considers two kinds of unit structures. Unit structure A which is the inclined portion, and unit structure B, which is the straight portion (float), while taking into account the interlacing pattern as shown in Figure 17. By computing the load-extension curve for unit structure A, given the local fabric stretch ratioλ1iA, the fabric tensile force per thread F1i is obtained. Afterwards, the load-extension curve of unit structure B is determined,
and hence the load-extension curve of the fabric can be computed.
Figure 17 Repeat along the warp axis, showing unit structures A and B [28]
Sun et al. model was verified experimentally, and the predicted results were in great agreement to the experimental values. Despite that this model was very successful in generalizing Kawabata’s model to be used in predicting the load-extension properties of literally any kind of woven fabric, yet this model is limited to 2D woven structures, and cannot be used to predict the mechanical behavior of 3D woven preforms, unless it’s properly modified. Modifying this model involves, defining the geometry and structural parameters of the 3D woven preform, as well as applying new assumptions that match the nature of such preforms. Once modified, this model can be used in conjunction with the rule-of-mixture to predict the tensile behavior of the composite material reinforced with such preforms. This will be covered in more details in the model proposed in this research.
2.1.3. Modeling mechanical behavior of 3DOW composites
19
section covers the different analytical models that were developed to predict the elastic and strength properties of the 3D woven composites under tensile loading.
Analytical models are mostly based on classical laminate theory and/or predictive models for 2D woven composites. They are very useful for simple geometries and can be used for quick prediction of mechanical behavior, which means that a full parametric study of different design iterations can be done in a relatively short time, to illustrate the effect of the fabric architecture and the constituent yarns’ properties on the behavior of the final composite material. This feature is unique to analytical model, and is an advantage over Finite Element Analysis (FEA) models, despite that FEA models are powerful in defining complex shapes and deformations, yet it’s computationally intensive and requires a very long time to run the analysis. This means that FEA will not be practical when doing a parametric study.
The classical laminate theory is a widely used approach to predict the elastic properties of inhomogeneous, anisotropic, materials such as 2D and 3D woven composites. The Classical Laminate Theory (CLT) along with other theories such as the rule-of-mixtures, represent the foundation for many of the modeling approaches that will be discussed later in this chapter. In the CLT approach the elastic properties of the composite are based on the relationship between the stresses and the strains, and the material is assumed to be linear elastic, which means that the reaction due to loading is a linear function of the loading, Equation 1 [29].
(1)
Where σ ij and ɛkl are the tensors of stress and strain respectively, and Cijkl is the stiffness
coefficients.
Similarly, Equation 2
(2)
Where Sijkl are the compliance coefficients. Since the tensors of the stress and strain are
20
reduced to 9. The reduced stress–strain relationship for an orthotropic system is represented in Equation 3 [29].
(3)
Where γ is the shear strain, τ is the shear stress, σ is the tensile stress and ɛ is the tensile strain. Similarly, the compliance matrix can be given as Equation 4.
(4)
The compliance matrix can be written in terms of engineering constants Eii, νij and Gij, where
E is the modulus of elasticity, G is the shear modulus and ν is the Poisson’s ratio for transverse strain, as shown in Equation 5 [29].
(5)
21
to be able to determine the elastic properties in the three orthogonal directions using the rule-of-mixtures, given the elastic properties of the constituents. Nagai et al. compared the predicted results of their model to the experimental results, and found that there was a good agreement between the results. However, their model was specific to the given weave architecture and cannot be generalized to include different weave constructions.
(a) (b)
Figure 18 Nagai et al. unit cell (a) 3DOW constituents, (b) Infinitesimal volume element in the 3D anisotropic space. [30]
In the late 70’s Kregers et al. used the so called Orientation Averaging (OA) method to determine the elastic properties of 2D and 3D composites based on a representative body approach. The model divides this representative body into smaller volume elements based on their tow orientation, to be able to treat these volume elements as a transversely isotropic unidirectional lamina. Afterwards, the elastic properties of the composite can be calculated by volume averaging the behavior of the representative body, while assuming either iso-stress or iso-strain condition. The predicted results of this method were greater than the experimental results, since it didn’t account for tows undulation associated with using woven preforms [31, 32].
22
19. The authors introduced the undulation of the warp and filler tows, while considering a stiffness knock down factor η of the Z- or binder tows to account for the degradation resulting from the tow waviness. However, the authors found that the undulation of the warp and filling tows are insignificant when compared to that of the binder tows, thus they decided to neglect it, and considered the warp and filling tows to be straight. The model incorporates the knock down factor as follow, when a composite is loaded in the fiber direction the elastic constants E1 and ν12 will change to ηE1 and ην12. Afterwards, the elastic constants are volume averaged
using the OA method assuming either iso-strain or iso-stress condition. The predicted results from this modified model were significantly improved over Kregers OA method, however neglecting the z-tows may not be justified for structures with out-of-plane performance. In the latter case the z-tows are significant in number and/or linear density.
Figure 19 Cox and Dadkhah 3DOW composite geometry [33]
In 1997 Kou and Pon [34] developed an analytical model based on the classical laminate theory to obtain the elastic constants of 3DOW composites. In their model they assumed the tows within the unit cells to be undulated oriented solids as illustrated in Figure 20, taking into account one-dimensional stress concentration and strains thereof ɛx(x), ɛy(y), ɛz(z). They
23
in any specific direction, by simply averaging the normal strain functions over the unit cell dimensions. Hence, the stiffness and compliance matrices of the composite can be obtained from the global applied stress and strain vectors, and consequently the global elastic constants of the composite. The predicted Young’s moduli were lower than the experimental results, and as the undulation factor λLi
i increased the predicted Young’s moduli decreased and the difference
between the predicted and the experimental values became bigger. Also, averaging the strains over the unit cell is not very accurate, especially when using tows of different fibers or linear densities.
(a) (b)
Figure 20 Kou & Pon unit cell for 3DOW composite (a) Straight yarns, (b) undulated yarns [34]
24
models. For instance, in the YXZ model the micro blocks are assembled in the y-, x-, and z- directions, respectively, according to the Y-, X-, and Z- models. The predicted results are in good agreement with the experimental work, however, the authors didn’t mention any preferential conditions for using one model among the others.
(a) (b) (c)
Figure 21 Schematic of Tan et al. (a) X-model, (b) Y-model, and (c) Z-model [36]
In 1999 Yushanov et al. [37] developed an analytical model for predicting the elastic behavior of 3DOW composites, referred to as the generalized modified matrix method, which is based on the modified matrix method developed by Abolinsh [38] in 1996. The proposed model accounts for the anisotropic properties of the composite and the constituent fibers, while considering the composite as a homogeneous medium. From the unidirectional macro-mechanics’ point of view, the tows in the i-direction were considered to be embedded in an isotropic matrix, while tows in the j-direction are transversely isotropic in the j-k plane, since they are considered to be embedded in a transversely isotropic matrix. Whereas the tows in the 3-direction has two orthogonal planes of isotropy, i-k and j-k, and are considered to be embedded in an orthotropic matrix. From the aforementioned assumptions, the elements of the compliance matrix are calculated, and further used to predict the elastic response of the 3DOW composite. This method was accurate in predicting the in-plane elastic properties, however the out-of-plane elastic properties were slightly lower than the experimental results.
25
perpendicular to the loading direction, and elements in the transverse direction. The elements resulting from the first level discretization could either represent the resin, or the fiber tows in any of the 3 orthogonal directions, furthermore, those elements are discretized again into sub-sections and sub-elements as illustrated in Figure 22 (a). The authors used the iso-strain assumption at the element and sub-element levels, and obtained the unit cell elastic properties from the elastic behavior of the sub-elements by using the elasticity theory. The predicted results of this model was compared to the experimental results of Cox and Dadkhah [33], and it wasn’t in good agreement, this is because this model used an idealized geometry as shown in Figure 22 (b).
(a) (b)
Figure 22 Naik et al. 3DOW composite unit cell for analysis (a) discretization, (b) idealized geometry [39]
26
cell are obtained from the elastic properties of the slices assembly thereafter. The predicted results were higher than the experimental ones, which could be due in part to the assumption that all tows have rectangular cross sections. In 2010 Buchanan et al. [41] used the same methodology used by Wu et al. to model the elastic response of the 3DOW composites, based on a more realistic geometry of the unit cell, rather than the idealized geometry [42], which yielded a much accurate results, and more agreement with the experimental results.
Figure 23 Wu et al. 3DOW composite unit cell discretization [40]
27
results from this model were in good agreement with FEA predictions and with experimental data.
Figure 24 Chen et al. simplified unit cell for 3DOW composite [43]
In 2006 Huang and Abdi [44] presented a general analytical model to predict the stiffness and the strength of 3D textile composites, and used 3DOW composite as an example. The proposed model makes use of a modified laminate theory and OA approach to calculate the elastic properties of the composite. They considered the 3D composite to be a laminate that is made up of a number of plies, and each ply would either represent warp tows layer or a Filling tows layer, with each layer having a portion of the binder tows passing through it. By using the OA approach, the elastic properties of each ply is calculated from the constituent tows stiffness. Afterwards, the global elastic properties of the composite laminate are calculated from the different layers’ properties using the modified laminate theory. The authors verified the model
experimentally, and the predicted results were in good agreement with the experimental results. In 2009 Pankow et al. [45] developed a new lamination theory to predict the effective linear
28
stiffness of the constituents, assuming that each tow is a transversely isotropic linear elastic solid. The model was verified experimentally, showing high correlation between the predicted results and the experimental results. However, this model relies heavily on the accurate determination of the volume fraction of the constituents that require micro-computed tomography (micro-CT) scans, and a finite element model to convert the slices into a 3D model. The micro-CT scanning requirement hinders the potential of this model from being generalized for any weave construction.
Figure 25 Pankow et al. representative unit cell of 3DOW composite [45]
29
the need for modeling hybrid composites with a combination of different fiber types, linear density, spacing, etc.
Thus one of the objectives of this research was to develop a simple analytical generalized model that could predict the entire load-extension curve, including plastic region, and can be applied to any kind of 3DOW reinforcement, with various weave constructions, and material hybridization to reveal the real potential of such kind of reinforcements.
2.2. Effect of the Z-Yarn on the In- and Out-of-Plane Performance of 3DOW Composites The path of the Z- or binder yarn in the 3DOW composites is usually inclined to the cloth plane in non-jammed structures, or perpendicular to the cloth plane in jammed structures. The orientation of the Z-yarn contributes to the out-of-plane properties; however, this contribution is at the expense of the in-plane properties. Thus, there is a need for optimizing the amount of Z-yarns used, so that the structure would have good out-of-plane strength without compromising the in-plane strength.
The effect of the Z-yarns can be controlled, by either changing the Z-yarn linear density, interlacing pattern, or the amount of Z-yarn in the structure which can also be expressed as the ratio of the Z-yarns to Y-yarns.
30
structure with the high binder yarn tension, are producing composite with lower fiber volume fraction, and lower tensile properties. The reduced properties of the normal structure were due to the collimation of the top warp tows due to the high tension of the binder yarn, which produced stress concentration regions as well as resin rich regions. The work of Leong et al. has only tackled the effect of the binder yarn path and tension on the in-plane properties, however, they didn’t check the effect on the out-of-plane properties. Moreover, the results might not be very accurate, since they used a manual hand loom, without any control over the yarns tension or weft yarns spacing. Additionally, this work is limited to plain weave.
Figure 26 Schematic diagram of Leong 3DOW structure [46]
(a) (b)
31
Figure 28 Schematic diagram showing crimping of the warp yarn due to high tension of the binder yarn [46]
32
Figure 29 Rao et al. schematic representation of the 3DOW architecture, (a) plan view, (b) front cross sectional view, and the (c) detail of the modified unit cell [47]
33
34
Figure 30 Schematic of the structures investigated by Mouritz et al., (a) 3DOW structure, (b) 3D angular interlock structure, (c) quasi-isotropic stitched structure, and (d) pinned structure
[48]
35
direction. In addition, the stress-strain behavior of the angle interlock was similar to that of the orthogonal woven in the warp and weft directions, and on the other hand, the layer-to-layer woven structure had higher load carrying capacity in the warp direction, and lowest strain to failure. They realized that crimp plays an important role in the tensile properties of the 3D woven composites, and that if the crimp can be shifted from the load bearing yarns such as the warp yarn, to the binder yarn, then the strength of the structure can be increased, which is the case in the layer-to-layer structure. The work of Peerzada et al. has shed the light on an important structural factor, which is the crimp, however they didn’t elaborate on the effect of the crimp within each structure, such as, the effect of different interlacing patterns within 3DOW composites, moreover, they didn’t study the effect of the binder yarn architecture on the out-of-plane properties, which is very important in optimizing the overall composite properties.
36
Figure 32 Crimp analysis of 3D woven structures [49]
37
Figure 33 Bilisik et al. 3D woven structures using different insertion mechanisms, (a) pin insertion, (b) shuttle insertion, and (c) single rapier insertion [50]
38
39
Figure 34 3D nonwoven carbon fiber needle punched web [51]
Figure 35 Stacked laminate of multi-layer plain woven preforms, Z-stitched in the through thickness direction [51]
40
41
Figure 36 Dhiman representative volume element of 3DOW, (a) structure 1, and (b) structure 2 [52]
Figure 37 Hexagonal packing of individual fibers within the carbon tows [51]
In 2015 Dai et al. [53] studied the influence of fiber architecture on the tensile, compressive and flexural behavior of 3D woven composites. They used different 3DOW structures, one was a plain weave, and another 3 structures were variant of 3x3 weaves as illustrated in Figure 38. The warp, weft, and binder yarn types were consistent for all structures, further all structures had the same warp and weft yarn spacing, and the binder yarn architecture was the only
42
43
Figure 38 Dai et al. 3DOW structures with varying Z-yarn architecture, (a) W-1 plain 1x1, (b) W-2.1 3x3 weave, (c) W-2.2 3x3 weave, and (d) W-2.3 3x3 weave [53]
44
these limitations, there was a need to make a focused investigation on the contribution of the Z-yarn on the performance of the 3DOW composites, at various Z-yarns levels, and study how it affects the in-plane and out-of-plane properties, to be able to optimize the structure parameters for highest performance. Thus, one of the objectives of this research was to study the effect of changing the amount of Z-yarns in the structure of the 3DOW, and find the optimum Z-yarn to Y-yarn ratio that will give good out-of-plane properties, without compromising the in plane properties.
2.3. Response of 3DOW Composites under Different Modes of Impact and their Relationship
Fiber composites have high specific mechanical properties; this feature is mainly due to the synergy between the fiber and the polymer matrix. However, these mechanical properties can be significantly reduced due to impact. Thus it’s important to measure the impact resistance of composite materials in different situations, and further perform post-impact tests to measure the residual properties of the composite.
Impact behavior of composites is sometimes referred to as impact resistance, which have a broad meaning, it may refer to several things, such as; the ability of the material to withstand a blow without damage, the maximum impact force necessary to rupture the composite, or the amount of energy absorbed by a given mass of the composite, etc. [54].
There are different theoretical aspects that need to be considered to understand the test theory, for example the level of impact can be changed by changing either the height of the striker in the machine which changes both the impact velocity and the impact energy, or changing the mass of the striker while keeping the velocity constant. Afterwards the forces generated during the test, the energy absorbed, and the deflection are measured [54].
![Figure 4 Tensile stress-strain curve of a woven fabric [9]](https://thumb-us.123doks.com/thumbv2/123dok_us/1754447.1225226/27.612.223.406.124.302/figure-tensile-stress-strain-curve-woven-fabric.webp)


![Figure 32 Crimp analysis of 3D woven structures [49]](https://thumb-us.123doks.com/thumbv2/123dok_us/1754447.1225226/57.612.145.486.70.316/figure-crimp-analysis-d-woven-structures.webp)
![Figure 34 3D nonwoven carbon fiber needle punched web [51]](https://thumb-us.123doks.com/thumbv2/123dok_us/1754447.1225226/60.612.169.458.283.513/figure-d-nonwoven-carbon-fiber-needle-punched-web.webp)
![Figure 37 Hexagonal packing of individual fibers within the carbon tows [51]](https://thumb-us.123doks.com/thumbv2/123dok_us/1754447.1225226/62.612.104.513.71.294/figure-hexagonal-packing-individual-fibers-carbon-tows.webp)
