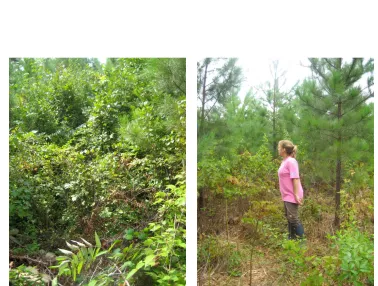
ABSTRACT
WYMORE, TEISHA LIANNE. Use of Goats for Vegetation Control in Young, Pine Plantations. (Under the direction of Dr. Frederick Cubbage).
Agroforestry presents an opportunity to increase land productivity and improve cash flow by combining variable income streams from agriculture, forestry, and animal production on the same piece of land. The specific objectives of this integrated research were to assess and demonstrate sustainable operational protocols in goat and forestry management, to measure how browsing affects desired and undesired forest vegetation and economically valued tree species, identify browse preference, and integrate sustainable agricultural practices and promote best management practices for woodlot owners.
The research site was located in Bahama, North Carolina, an area adjacent to an urban population of Durham County ( N 36° 11’ 57” W78° 53’ 43”). The research area is a 6.9 hectare loblolly pine (Pinus taeda) forest that was planted in 2000. Half of the site was treated once with herbicide and the other half (untreated) represents a mixed-planted pine forest with a large hardwood natural regeneration component. Pre-treatment measurements included understory species identification, diameter of crop tree by species, biomass clip samples, and cover density sampling. Sampling occurred between July and August 2009.
The findings indicate that goats effectively removed unwanted brush to an acceptable level (< 50%) up to a height of 1m to 1.5m without damage to the residual crop trees. When given a variety of forage, goats preferred browsing fruiting or flowering shrubs such as blackberry cane or sumac. They chose hardwood tree saplings, vines, and grasses before selecting pine trees. The larger trees, greater than 2 cm in diameter, were largely undamaged due to strict animal management and forage availability preferences.
Use of Goats for Vegetation Control in Young, Pine Plantations
by
Teisha Lianne Wymore
A thesis submitted to the Graduate Faculty of North Carolina State University
in partial fulfillment of the requirements for the degree of
Master of Science
Natural Resources
Raleigh, North Carolina 2013
APPROVED BY:
_______________________________ Frederick Cubbage, Ph.D.
Committee Chair
________________________________ ________________________________
DEDICATION
This work has been a long journey. Many months of blood, sweat and, most of all, tears were poured into the work that resulted in these pages, and for that, I want to dedicate this work to
the goats who gave their lives to research, who were my friends and confidantes, and who gave me so much more than a research paper or a degree by just being goats. I love them all.
I was so fortunate because my family has supported me through the entire process;
thus, I dedicate the end result, my degree, to them. My Dad, who patiently accepted my frantic phone calls and answered all of my emails without making me feel like an idiot; my
mom, who listened to my crying and moaning, and who cheered me through the emotions,
and sometimes even cross-country visits that accompanied this work; and finally, I would owe any academic verve passed onto me to my grandfather, Dr. A. Wayne Wymore. Thank
BIOGRAPHY
Ms. T. Lianne Wymore lives with her two dogs, Griffon and Dolly (who at this time are just 1-year old), in Durham, North Carolina. Teisha, a west-coast native, came to live in North
Carolina with her (ex) husband Robert Murray to escape the high cost of living in San Francisco, where the two had met and lived together with Teisha’s dog, Sasha. It was Sasha
who was the common thread through most of Teisha’s adult life. Having lived with her in
over 10 different locations in just over a decade, Sasha and Teisha were as close as a badger and a frog! They had a love-hate relationship that was a true testament to the unconditional
bond that humans and canines share. Ms. Wymore was born in Tucson, Arizona, to teenaged
parents, Farrell and Georgiana Wymore. Farrell, a young musician, and Georgiana, a high school junior, were forever bonded by the unexpected birth of their first child, Teisha-Lianne.
Upon getting his Master’s degree, Farrell and family moved east to follow the
blooming high-tech industry in the early 1970s. It was then that Teisha experienced living in
North Carolina as a child, playing with her younger brother Bryan (who later played a significant role in her life in the city of San Francisco) and feeling that wonderment of the
natural beauty of the region was never forgotten. Having lived in most tech-hubs across the USA, Teisha has a broad experience in adaptation. She attended high school in Austin,
Texas, and then moved to San Francisco, following her father’s path to Silicon Valley. Ms.
Wymore attended and graduated from San Francisco State University, then, after taking a year off to travel and explore the world, sow oats, and experience life, she began a career as a
Working as a low-level grunt, she quickly understood how businesses like that
thrived, and while she continued on to more traveling, she plotted her next move into the
world where she would feel most at home through her love of food. While working for various software start-ups and wealth management companies, Ms. Wymore rubbed
shoulders with the hardest working people in the fast-paced, high-tech world of Silicon Valley until she finally pursued her dream of owning her own business. She opened a
catering company and worked with her boyfriend to create a successful restaurant and catering business—Picnic Dining. It was here where Sasha entered the picture and the pair
were inseparable.
While the dot.com crash was taking prisoners, Ms. Wymore managed to stay afloat using her earlier marketing skills to support herself once again in the high-tech world, but
this time, at the front line of a huge corporate business headed for Chapter 11. She spent several years as a personal assistant and liaison to the Chairman of the Board of this company
and learned the intricacies and delicate, highly-guarded nature of being at the top of a large,
multinational organization. And there she met Mr. Murray, her soon-to-be husband. Rob was a laid-back guy who wasn’t swimming in the circles she was used to; he was a surfer from
Canada—just what was missing from the tight-laced life she had in corporate American culture. The two quickly fell in love and moved in together after Sasha put Rob through
rigorous testing and trials of commitment. The three were inseparable. As time went on, the little family found life in the city to be too much for what they sought out. Water, space,
Teisha began graduate school after realizing that if she ever wanted to reinvent
herself, the time was right! There was no doubt that NC State was the choice because it was
exactly the atmosphere she sought. Big school, lots of energy and most of all, it was an agriculture school, and that was her first love—animals. It was through a mutual friend that
her work with the goats at NCSU changed her life forever. Up to this point, she’d only dreamt of being on a farm and this experience was, indeed, a dream come true. During
graduate school, she started working on Food Systems programming with the Center for Environmental Farming Systems where she found her niche, and her career change was
made.
She is now leading a statewide consumer marketing program that encourages local food procurement, consumption, community awareness and economic development through
sustainable agriculture in North Carolina. This program is a model for increasing local foods’ market expansion in procurement in institutional and corporate settings and is being
ACKNOWLEDGMENTS
Some may call it an anchor, and others may call it an albatross; for 5 long years I called it the
weight-of-the-world. The education of obtaining a Master’s Degree for me, at this stage in
my life, is not just of the discipline of academic learning, course work and research, but also in large part, it was a life’s lesson and each person I’d like to acknowledge here played a role
in giving me something that made a life-long impact.
First, I acknowledge the goats that gave their lives to further our understanding of
them through academic research like mine—truly, the best experience of my life was being
in their company in the silent woods someplace in my mind that was far, far away from North Carolina; I will never know a more peaceful feeling. They taught me so much, and I
am grateful for that every day.
I have to acknowledge two people who were directly responsible for my research
focus and for my ever growing love of goats; without them, I would not ever have known how wonderful goats are. Heather Glennon, I can’t quite describe the impact you made on
my life. Maybe it was the mountain of goat poop and blood we analyzed while “doing
science” or the working-with-livestock education you patiently gave a city girl like me. Of course, my favorite part of our time together were the early mornings we spent with our girls
in the pasture—physical labor was never so much fun. I’ll never forget what you brought to my life, and I thank you.
and guidance through this whole experience. Your lovely wife Silvana has also been a big supporter of mine. Thank you both.
Because so many major life events occurred during this work, I feel as though I’ve
lived a few completely different lives through its duration and many of my family at CEFS (Center for Environmental Farming Systems) have been there with me, in particular, my
mentor and friend, Dr. Nancy Creamer. As the years went by, you went from gentle nudging
to mom-like pushing me, and as difficult a time as it was for me, you were always willing to work with me through all of it—a true friend. A million “Thank yous” to you, Nancy, you’ve
changed my life in more ways than you know. In General, CEFS is a family more than an organization. All of my work-family members there have supported me and I love them all.
During the hot months of summer when my field research began, we had our work cut out for us. Literally, working with machete and compass to cut through the forest,
building what would be my “home” for the summer, there was one person that stands out as being the engine of that summer work—Charlie Lawrence, a guy from Goldsboro nearly 20
years my junior who could not have made a better pair with me. You taught me not to fear
the spider but to power through and not worry about the spider! Thanks, CLAW, for showing me that power.
I also need to give a huge thank you to my dear, dear departed best friend Sasha, my husky dog, the love of my life, my companion, and my support system for over a decade.
I appreciate the mentorship and continued support of Dr. Fred Cubbage, my
Committee Chair and advisor. Fred has been instrumental in my graduate work since day one and has never quit on me despite all of the incredible events and insurmountable odds of never finishing that I’ll leave out here. Fred has been the first person to support me all the way and does it with a smile and that dry wit I admire. Thank you, Fred.
Dr. Bob Kellison joined my committee late but was crucial to helping me become a better writer! I appreciate your patience and kindness Bob. Thank you.
TABLE OF CONTENTS
LIST OF TABLES... xii
LIST OF FIGURES ... xiii
CHAPTER 1: INTRODUCTION... 1
CHAPTER 2: LITERATURE REVIEW... 3
Environmental Benefits ... 4
Soil ... 4
Silvopasture Systems ... 6
Loblolly Pine in Silvopasture... 7
Animal Welfare... 8
Economics... 9
Vegetation Control in Agroforestry Systems... 9
The Role of Goats as Biological Control Agents... 10
Characteristics that Make Goats Desirable for Vegetation Control... 10
CHAPTER 3: MATERIALS AND METHODS ... 15
Site Description... 16
Experimental Design... 17
Site Establishment... 19
Vegetation Measurements... 20
Pre-Treatment Measurements ... 20
Tree Sampling... 21
Vegetation Density Sampling ... 21
Biomass Samples ... 23
Pre-treatment Measurements ... 26
Daily Measurements and Observations ... 26
Post-treatment Measurements... 27
CHAPTER 4: RESULTS... 28
Pre-Treatment Dry Weight Sample Results... 28
Pre-Treatment Dry Weight Tree Samples Statistical Analysis Results ... 30
Pre-Treatment Dry Weight Grass Samples Statistical Analysis Results ... 33
Tree Samples... 36
Cover Vegetation Density Screen Samples ... 39
Goat Activity Measurements ... 44
CHAPTER 5: DISCUSSION... 46
Differences in Forest Treatments... 46
Challenges... 49
Goat Effectiveness ... 49
Methods and Management... 52
CHAPTER 6: CONCLUSION ... 54
REFERENCES ... 57
APPENDICES ... 62
Appendix 1: Example Vegetation Sample Coding Scheme ... 63
Appendix 2:Analysis of Variance for Dry Weights of Tree Samples in Two Treatments/m364 Appendix 3: Analysis of Variance for Dry Weight Samples of Forbs samples in Two Treatments g/m3... 65
Appendix 4: Analysis of Variance for Dry Weight Grass (Biomass) Samples in Two Treatments g/m3... 66
Appendix 5: Pre-treatment Animal Health Data... 67
LIST OF TABLES
Table 1: Descriptive Statistics for all Dry Weight Means in Both Treatments (grams per sample)... 29 Table 2: Dry Weight Tree samples, measured in grams per sample meter cubed... 31 Table 3: The least squares mean dry weights of Forbs samples of two treatments g/m3... 33 Table 4: Least Squares mean values for samples of dry weight grass samples in both
LIST OF FIGURES
Figure 1: Hill Forest topographical map; Inset research location... 16
Figure 2: Treatment Plots Diagram... 18
Figure 3: Vegetation Density Screen ... 22
Figure 4: Plot sampling scheme... 24
Figure 5: Goats from each treatment, post-rotation. ... 27
Figure 6: Comparison of mean dry weights for two treatments of all samples for three replications (grams per sample). ... 30
Figure 7: Comparison of mean dry weights for two treatments of tree samples for three replications g/m3... 32
Figure 8: Before and after goats. Herbicide Treatment, Plot 2... 34
Figure 9: Replication within Treatment. Comparison of dry weight Grasses across two treatments (g/m3)... 35
Figure 10: Percentage comparison of pre-treatment vegetation cover across both treatments40 Figure 11: Post-Treatment vegetation Cover Density Screen visibility percentage comparison across both treatments... 41
CHAPTER 1: INTRODUCTION
Agroforestry practices in agriculture present an opportunity to increase land productivity and diversify cash flow by combining variable income streams from agriculture, forestry, and animal production on the same piece of land (Clason & Sharrow, 2000; Hamilton,2008). It combines agricultural practices and forestry techniques to create more diverse, productive and sustainable land-use systems. Practices focus on satisfying economic, environmental and social objectives held by landowners (Sharrow, 2000; Workman, Monroe & Long, 2005). Such systems like Silvopasture, for example, are deliberately designed and managed to produce a high-value timber product (such as sawtimber) in the long term while providing short-term economic benefit from a livestock component (Hamilton, 2008). By farming three-dimensionally using agroforestry techniques, landowners can increase useable acreage
and benefit from a diversified system (USDA NAC, 2008).
The Southeastern United States contains the largest percentage of farm and private forest ownership in the country (NASS, 2001). The role of goats as biological control agents may become useful in plantation forestry settings in the future due to environmental concerns and elevated costs of traditional weed and forbs vegetation control methods such as
mechanical cutting and herbicide application. The specific objectives of this integrated research project were to assess and demonstrate sustainable operational protocols in goat and forestry managements to measure how browsing affects desired and undesired forest
vegetation and economically valued tree species; to optimize animal stocking rates in
CHAPTER 2: LITERATURE REVIEW
The success of modern agricultural and forestry production can be largely attributed to monoculture systems using a few select species (Nair, 2009). In the drive for maximizing yield and profit, the age-old tradition of using combined farming systems was essentially avoided and, in some cases, this has resulted in environmental problems such as land and water degradation and increased land clearing (Clason & Sharrow, 2002; Nair, 2004;
Sharrow, 1997). During the last 30 years, however, there is an emerging body of literature on the adoption of agroforestry based on two influences: economics and legislation in favor of incentives, specifically for small to mid-sized holders of diversified forest and farmland (Cubbage et al., 2012; Cutter, Hunt & Haywood, 1999a; Frey et al., 2007); and to manage and improve natural resources on their land (Beetz, 2002; Peters, 2000).
One central theme in agroforestry is that productivity is higher in agroforestry systems compared to monoculture systems (Clason & Sharrow, 2002). The positive benefits of agroforestry to the environment have also been increasingly recognized worldwide, and practitioners are positing that livestock and tree crops can not only co-exist, but if properly managed, can provide additional income from land formerly used for a single crop (USDA NAC, 2008). General strategies for designing sustainable agricultural systems include 1) Diversification of plant species to enhance farm biological and economic stability 2) Use of plants/animals well suited to farm soil and climate
3) Preference for farm-generated resources over purchased inputs 4) Tightening nutrient cycles
6) Soil conservation and improvement practices including cover crops
7) Rotations that include deep-rooted plants to utilize nutrients deep in the soil profile 8) Natural and sustainable methods for controlling weeds, pests, and diseases
9) Controlled use of livestock manure and nutrient positive legumes to replenish nutrient losses
10) Creation of an overall net-positive effect on the environment
These strategies, based on naturally occurring ecosystems, are intended to be economically viable, socially acceptable, and biologically sound (Sharrow, 1997). Key characteristics that distinguish agroforestry systems from agriculture and forestry include greater structural and functional complexity, an emphasis on multipurpose trees, and the production of multiple outputs (Nair and Graetz, 2004).
Environmental Benefits
The role of agroforestry in protecting the environment and providing a number of ecosystem services are promoted as key benefits of integrating trees into farming systems (Nair, 2007). As traditionally employed, these benefits were intuitive to the farmers and landowners that managed agroforestry systems, although the scientific evidence to support these benefits is only now coming to light through research on environmental benefits and ecosystem services such as carbon sequestration (Nair & Graetz 2004; Nair 2007).
Soil
erosion and degradation, and improve soil quality and health (Cutter et al., 1999a; McAdam, Sibbald, Teklehaimanot & Eason, 2007).
Evidence exists of accelerated erosion and increased run-off in many agricultural areas where replacement of natural forest and grasslands by croplands has been implemented (Nair, 2007). As well as increasing structural stability of the soil, tree roots can enhance water filtration and improve water storage by increasing the number of soil pores. In this way, the risk of soil erosion is reduced through tree roots acting as physical barriers to reduce surface flow of water and sediment (Pollock, 2008). By promoting a closed system with internal recycling of nutrients, where nutrients are accessed from multiple soil horizons by tree roots and returned to the soil through leaf fall and organic matter, agroforestry systems enhance soil nutrients and reduce reliance on external inputs (Pollock, 2008; Sharrow 2007).
In a meta-analysis on the adoption of agroforestry practices worldwide, Pattanayak, Mercer, Sills and Yang (2003) concluded that there are five categories that determine the adoption of agroforestry. The first category is preferences, or farmer-specific influences including risk tolerance, attitudes toward conservation, and characteristics of a household (including age, gender, education and social status). Other categories that determine adoption include resource leverages (assets like land, labor, livestock); market incentives (prices, availability and access to markets, transportation, and potential income loss or gains);
biophysical factors (soil quality, slope of farmland, plot size); and risk and uncertainty (short-term risks like fluctuating commodity prices and long-(short-term risks like land tenure).
increased soil fertility (Bazill, 1987). In developing countries, agroforestry offers alleviation from poverty by providing food security and arresting degradation of marginal lands that affect over one billion hectares and over 800 million people (Nair, 2007). In the United States, a nationwide survey of Natural Resource Professionals was administered in 1995 and determined that 20 of 50 states offered legislation related to Agroforestry practices, including tax incentives like cost-sharing (Cutter et al., 1999b). This suggests that landowner adoption may be related to policy. Frey et al. (2007) examined silvopasture adoption in Argentina where large scale agroforestry is widespread among large landowners and found that a significant number of farmers said their adoption of the practices was influenced by cost-sharing and subsidies programs available from the government.
Silvopasture Systems
Silvopastoralism intentionally integrates trees, forage crops, and livestock into a structural practice of planned interactions (Clason & Sharrow, 2000). This system represents an integrated land use that combines elements of agriculture and forestry in a sustainable production system (Sharrow, 1997). The emphasis is on managing rather than reducing complexity.
season grass production; provision of shade and shelter for livestock; production of short term revenue through non-timber forest products such as pine straw and mulch; an increase wildlife population; and improved water quality and reduce run-off (Nair, 2004, 2009; Sharrow, 2007; USDA NAC, 2008).
In the southern United States, controlled grazing studies have been underway for over 30 years examining various management scenarios (Pearson et al. 1995, as cited in Zinkahn & Mercer, 1997). However, in many areas, the practice of forest grazing is slow to become common practice (Cutter et al., 1999a).
Loblolly Pine in Silvopasture
In the Southeastern United States, there are four major pine species grown for
production including slash pine (Pinus elliotii), longleaf pine (P. palustris), shortleaf pine (P. echinata) and loblolly pine (P. taeda L.) (Clason, 1999; USDA, 2008). Loblolly pine has the second largest range of the southern pines, growing naturally on the coastal plain from New Jersey to Florida and west to Texas, throughout the Piedmont, and into Tennessee, Arkansas, and Oklahoma. The main uses of loblolly pine are for softwood lumber and chips for
During the first three years after planting, competition from hardwoods often reduces height growth and kills young pine trees. For this reason, intentional spacing for optimal growth and root clustering is important when developing a silvopasture system (USDA, 2008). Closely-spaced trees restrict equipment accessibility and sunlight to forage growing beneath trees while a double-row spacing 2.5-3.0 m (8-10 ft.) within rows and an alleyway of 6.1-12.2 m (20-40 ft..) can improve both forage production and offer optimal tree growth. A typical silvopasture system will have trees planted in a 3.7x3.7 m (12x12 ft) or 4.6x4.6 m (15x15 ft.) spacing (USDA, 2008).
Animal Welfare
Approximately 25% of all US forest land, primarily in the western states, is grazed by livestock (Sharrow, 1997). Trees are multifunctional in their provision of resources for animals; they provide shelter from rain and wind, shade from the sun, cover from predators, and a diversity of foraging resources (Beetz, 2002; McAdam et al., 2007). Shade is
Economics
Integrating trees into the agricultural landscape has the potential to impact the local economy through increasing economic stability, diversification of local products and opportunity for increased labor and skills; improved food and fuel security; and improvements to the environment (Clason, 1995).
Economic research in agroforestry systems has shown that financial benefits are correlated to increasing the diversity and productivity of the systems, which are influenced by market and price fluctuations of timber, livestock and crops (Grado & Husak, 2004). In addition to higher yield potential of agroforestry, product diversification increases the
potential for economic gain by providing annual and periodic revenues from multiple outputs throughout the rotation, thereby reducing the risks associated with farming single commodity crops (Clason, 1995; Cubbage et al., 2012). Several studies in the southern United States suggest that silvopasture can lead to moderate rates of returns comparable to alternative production systems (Clason 1999; Grado & Husak, 2004). Compared with exclusive forestry land use, agroforestry practices are able to recoup initial costs more quickly due to the income generated from the agricultural component, and, more specifically, as technological advances in maintenance and implementation of silvopasture systems are made, widespread adoption will become a more common practice for landowners (Grado &Husak, 2004).
Vegetation Control in Agroforestry Systems
Traditionally, landowners have only a few options available for vegetation
control include mechanical, chemical and animal browsing (Hart 2001, Sharrow 1997). Mechanical methods of vegetation management include rollerchopping, root plowing, bulldozing, chaining or cabling, and mowing, all of which are quickly and dramatically effective, even if it is costly to maintain equipment and not suitable for areas where machinery cannot access terrain, such as steep mountain hillsides or swampy areas.
Nevertheless, most of these methods are too expensive for small to medium sized landowners (USDA NAC, 2008). Chemical control of weeds has been effective in the past, but increased expense and risk of killing desired species can negate the practice (Hart, 2001; Lewis et al., 1983).
The Role of Goats as Biological Control Agents
Goats have been used for vegetation management in the United States for over one hundred years (Hart, 2008; Nair, 2004). Their use for this purpose is expected to expand dramatically in the future due to increased vegetation management problems resulting as a consequence of environmental degradation created by past systems of farming and grazing, and the increased expense of using conventional methods (Clason & Sharrow, 1997).
In the United States during the 1980s, a dramatic influx of goat production further increased the number of states with significant numbers of goats and goat producers, especially in the South. There is a need to further develop the technology of using goats to manage vegetation in the many different ecosystems common to the area (Hart, 2008).
Characteristics that Make Goats Desirable for Vegetation Control
utilize (Hart, 2008; Luginbuhl, 1999; Sharrow, 2007). Goats are resistant to many plant toxins and can digest plant matter with high levels of tannins. Research suggests that Condensed Tannins (CT) are effective in mitigation of parasites in ruminants (Luginbuhl & Mueller, 2000; Waghorn, 2008). Vegetation high in tannic properties that are often non-palatable to cattle are utilized by goats. This fact presents an economic advantage for using goats in an agroforestry system as a reduction not only in feed cost, but also in parasite control. Studies focused on intensive agroforestry production suggest that goats consume a predominance of browse (60-70%) and lesser grasses (20-30%) and forbs (Torrano & Valderrábano, 2005), although that proportion varies with availability, season, and
management intensity. Sharrow (2007) suggested that sheep and goats prefer hardwood over conifer browse in research using Douglas Fir (Pseudotsuga menziesii) and Western Red Cedar (Thuja plicata) plantations, noting that season and tree age also affect browse preference.
until other forage was consumed during the fall and winter months when green forage was scarce. Further, they argue that while it was common for goats to eat the bark of some tree species, they will browse to vary their diet with little effect on the targeted plant population. Conversely, some plants may only be grazed when goats are forced onto them as a sole diet, which suggests management as a factor in controlling vegetation damage (Luginbuhl & Pietrosemoli, 2007). Luginbuhl et al. (1999, 2007) concluded that due to a strong preference for browse, some woody plant species may prove to be an important component of goats’ forage systems. Goats readily consumed immature grasses but switched to browse when forage quality decreased with advanced maturity, selecting for optimum nutrient benefit.
There has been an accumulation of literature over the years on the use of goats for controlling various plant species such as invasive weeds and as an effective alternative to herbicides for clearing and maintaining firebreaks (Hart 2008; Luginbuhl & Pietrosemoli, 2007). This alternative has application for reducing fire fuel hazards on public lands and in urban areas where controlled burning or chemical application is prohibited (Hart, 2008). There are several innovative uses of goats for vegetation management including socio-economic benefit that promotes goats as useful to suppress brush that is too overgrown for wildlife such as whitetail deer (Hart, 2001).
In the southeastern United States, both farmers and forestland owners have introduced silvopasture onto their land. While there are no size limitations for production, typical
Research by Cornell University (Smallbridge et al., 2004) suggested the ideal stocking rate for optimization of brush control in a mature hardwood stand was 20 adult goats in a 0.10 ha paddock for 3 to 4 days. In this study, the objective was to observe the dietary preferences and health of goats in a woodland setting. Recommendations from the Cornell research include stocking adult goats in hardwood stands where the average tree diameter is >2.5cm to avoid girdling of the dominant stems (Smallbridge et al., 2003). Further, the research asserted that adoption of the practice for controlling unwanted
vegetation was largely due to the goat herd owners’ hesitation and lack of knowledge on how to manage for the objective of financial gain for this service. Results offering an example for intense goat management in agroforestry systems suggest that grazing in the pre-growing season has more of a negative effect on the saplings than grazing in post growing season, resulting in the reduction in stem diameter increase in both oak and ash saplings observed in a study by Sharrow et al. (1992). This research also found radial growth to be more sensitive to browsing than tree height in Douglas fir. This would also appear to be the case for
hardwoods like oak (Quercus spp.) and ash (Fraxinus spp.) as concluded by McEvoy, and McAdam (2008).
CHAPTER 3: MATERIALS AND METHODS
The project design was based on using limited resources for goat management and working with existing field conditions. The day-to-day field management was carried out by a single individual with occasional help from additional persons to replicate a real-life scenario for a woodlot owner as well as to provide enough management for tree crop growth and goat herd management.
The research site was located in a 6.88 hectare (17 acre) loblolly pine plantation within the G.W. Hill Forest located near Bahama, North Carolina, Durham County (N 36° 11’ 57” W78° 53’ 43”). The G.W. Hill Demonstration forest is a 991 hectare (2,450 acre) research forest established in 1929 and owned by North Carolina State University and managed by the Department of Forestry and Environmental Resources. This self-sustaining forest sells
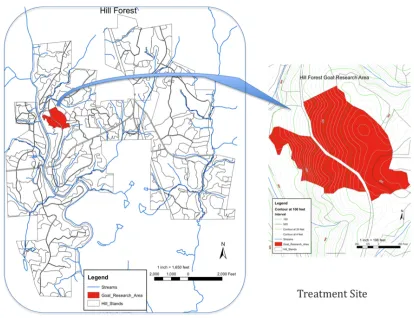
Figure 1: Hill Forest topographical map; Inset research location
Site Description
the control of undesirable vegetation in order to achieve one or more of the following vegetation management objectives:
1. The control of undesirable and noxious plant species.
2. The control of undesirable vegetation to aid in establishment of desirable plant species. 3. The control of undesirable vegetation for purposes of wildfire fuel reduction.
4. The release of existing desirable plant communities from the competitive pressure of undesirable plant species.
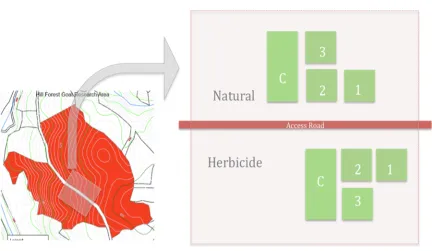
The stand is divided by an access road between the “Herbicide” and “Natural” areas we’ve designated as our “treatment area” for this research. The land contour has a slight slope facing west, which runs into a stream running in a north/south direction along the western edge of the herbicide-treated area. We established plots for the experiment that were approximately 182.3 m (200-yards) from the bottomland adjacent to the stream.
Experimental Design
and the length of the net fencing needed, we determined that a square was the optimal shape for each of the treatment plots.
Figure 2: Treatment Plots Diagram
Research plots were measured and fenced at a 0.10 ha (0.25 ac) size, which were established for each treatment. The vegetation on the sides of the plots was hand cut at distances of 31.62 m x 31.62 m (103.7 ft. x103.7ft.) long. This plot size gave us ample room in the study area to do as many replications as necessary during the study timeframe. Because of limited access through the thick brush found onsite, we established three matched
were fenced with portable livestock electro-net fences: two measuring 45.72 m (150-ft) and one measuring5.24 m (50-ft). A control plot adjacent to each treatment was measured and flagged but not fenced.
A 208 liter (55-gallon) plastic water barrel was used as a catchment tank, outfitted with a mesh top and a spigot on the bottom to fill water buckets. A barrel was placed along the access road adjacent to each treatment area (two tanks total). Water buckets were filled and hand-carried from the catchment tank to the goat plots. Drinking water troughs inside each plot were moved periodically to keep the goats from rooting and girdling nearby trees. Mineral supplement was kept in a waterproof box onsite and was provided to both treatments weekly. The supplements were moved periodically to encourage the goats to move around and not overgraze at one location.
Site Establishment
Prior to animals moving onto treatments, vegetation on each plot was cut by hand using machetes to avoid damage to the tree crops and to reduce cost of machinery typically
necessary build a fence in the thick undergrowth of a forest. Ground preparation for each plot included fence line clearing using a machete, neon rolled flagging, and a compass; the next step was weed-eating with a brush saw to cut a three-foot-wide pathway for the electrified net fence placement. Brush and trees were cut in a straight line using a compass, and flagging was placed at 3.3 m (10.83 ft.) intervals to indicate the areas inside the plot where vegetation samples and measurements would occur.
m (150-ft.) and a single 15.24 m (50-ft.) livestock electro-net fence were used for each treatment plot. A 12-volt solar charger was used to electrify each plot enclosure. Pre-treatment vegetation measurements were taken immediately after the fencing was laid.
Water troughs for the goats were placed in the closest road access corner of the plot. Fence perimeters were walked and tested for any breach or potential failure. After the animals were moved on to the site and were acclimated, a portable solar-powered charger was situated on the ground facing the most southern part of the subplot fence line and was attached to the net fence and charged. A total of three same-sized subplots (.10 ha) were established on each treatment site, and the goats were rotated through the plots as subsequently described.
Vegetation Measurements
Field measurements of the vegetation were taken in each treatment and control plots. The measurements can be described as pre- and post-treatment measurements. An analysis of variance (ANOVA) was conducted using JMP software by SAS. Confidence intervals were estimated at 95% (α=0.05). A consultant with the NC State University Department of Forestry and Environmental Resources provided statistical assistance. Analysis of variance was performed on all dry weight samples taken. Table 2 provides a descriptive statistical overview of the overall sample mean, standard deviation, standard error, and upper and lower percentiles for the dry weight samples taken across both treatments.
Pre-Treatment Measurements
determined by dividing each 0.10 ha (0.25 ac) plot into a quadrant. A transect was made within each quadrant to determine the center. This point was flagged in the branches of a plantation pine tree and exact compass coordinates of the center point were recorded. Different plot measurements were established for tree, brush, and grass sampling, as well as for goat grazing density measurements.
Tree Sampling
For trees, a radius from the plot (quadrant) center point was measured at 5.63 m (18.5 ft.) in the Herbicide treatment and 3.51 m (11.5 ft.) in the Natural treatment. The radius was larger in the Herbicide stand, which had more well-distributed loblolly pine trees and not many other trees. The Natural stand had far more hardwood tree in-growth and many trees, so we used a smaller radius. Trees within this sample area measuring 2.5cm (1 in.) or greater diameter at 1.83m (6 ft.) were measured by species and recorded.
Vegetation Density Sampling
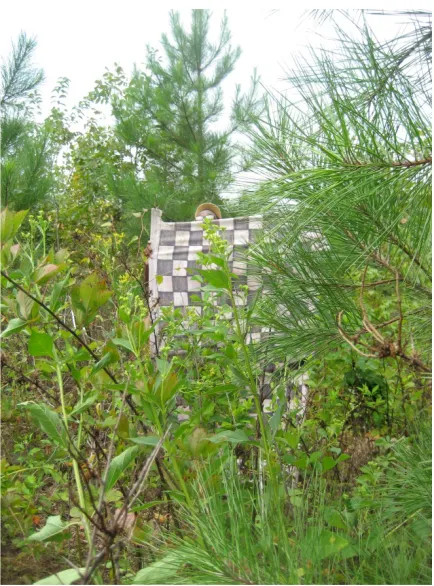
of the screen that when erected, allow it to be held up to its full height. Figure 2 shows a photograph of the Cover Density Screen that was used in the field.
Figure 3: Vegetation Density Screen
person measures 9 m (30 ft.) in the same cardinal direction away from the screen, turned and faced the screen. A visual measurement was taken by counting the black and white squares visible from the 9 m distance. This count provides a visual estimation of the percentage of ‘cover’ vegetation obscuring the screen. Four measurements (representing each cardinal direction) are taken from each transect center point of each sub-plot. The resulting
measurement used for each sample is the sum of the number of visible squares (black and white) on the screen representing a percentage of non-vegetation cover between the ground and 2.5 m (8.2021 ft.) vertically. The four values per sample were recorded for each plot and the mean was taken. Samples were taken from each plot over the three replications providing both pre-treatment and post treatment sample values.
Biomass Samples
An equal number of samples were taken from both Herbicide and Natural treatment plots. Biomass categories of forbs, tree, grasses and dead-matter samples were clipped using garden shears, separated by vegetation category, bagged, labeled, dried at 200 degrees Fahrenheit (93 degrees C), and weighed in grams.
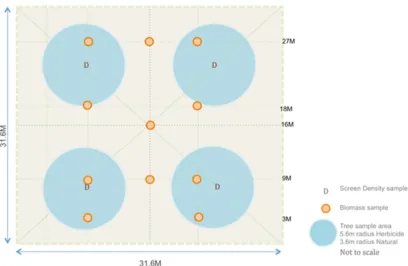
plot within each of the 0.10 ha treatment plots. Control plots in both treatments were sampled in the same manner. We sampled three locations along the adjacent border from the treatment plots at a distance of 3.1 m (10 ft.) from the fence-line. No samples were taken along the access road side of a control treatment plot. A diagram of the plot sampling scheme for each replication-plot is shown in Figure 3.
At each sample area, a radius was made using a 0.3 m metal stake and 2 m measuring tape. From the center point stake, a 55.8 cm (22 in.) radius was measured and a 9809.8 cm2 cylindrical circular sample of vegetation was clipped at ground level. Then this radius was measured vertically, 121.92 cm (48 inches) from the ground. All vegetation in each sample area, 1196017.7 cubic centimeter cylindrical volume, was clipped and saved. (pi * ( 55.88 ** 2)) * 121.92 = 1196017.7cm3 or 1.196m3).
All vegetation material within that cylindrical area was clipped using hedge trimming shears and placed in a paper bag. If a tree stem was centered within the sample area, the branches and leaves were taken but not the terminal stem. Following collection, paper collection bags were labeled using an identification code indicating the following
information: Treatment type, Replication Cycle Number and Sample Location. Location ID is based on flagging locations along each plot perimeter (Appendix 1). Herbicide Treatment has an ID designation of (H) and the Natural Treatment ID, (N). The Replication Cycle ID is 1, 2, or 3. Sample Orientation ID is based on location within plot as oriented from the access road. Top (T), Bottom (B), Right (R), Left (L), and Center (C). Each sample collected included a location based on perimeter flagging set at intervals around the fence line.
Following animals moving off of a plot, a second Cover Density measure was taken in the same four locations within each plot as were used in the pre-treatment measurement.
Animal Measurements
animal had PCV (Packed Cell Volume) and FEC (Fecal Egg Count) tests run to determine the fitness of each. Each goat was also tested for anemia in the field using the FAMACHA scoring system. This method is useful when dealing with the Haemonchus contortus
parasite. Because of concern to pasture-based sheep and goat production, FAMACHA is used to monitor health and administer deworming as needed. Heavy infestation by the blood sucking parasite results in anemia, the symptoms of which show up in the color of the membrane of the eye. In the FAMACHA system, a goat’s eyelid color is matched with a scorecard that ranks color on a 1 to 5 scale. A dark red eyelid membrane color is a 1 and indicates no significant anemia. A white color is a 5 and indicates severe anemia. The light red, pink and pinkish white colors in between indicated by scores 2 through 4 indicate increasing levels of anemia that generally correspond to the parasite load the animal is carrying.
Pre-treatment Measurements
Prior to treatment, animals were weighed and FAMACHA tested for anemia and evenly distributed by weight across both treatments at 8 goats per treatment.
Daily Measurements and Observations
Post-treatment Measurements
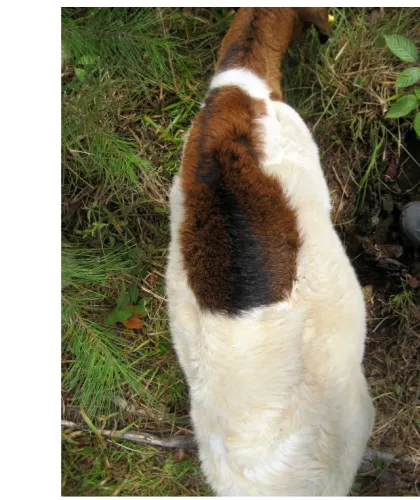
To prevent damage to the site or to the crop trees, we established a criterion of 20 percent vegetation remaining as being the indicator for removing goats from a treatment plot. At that point, goats were taken off treatment and weighed. There was not significant change in weights at this age of goat and quality of forage. Visual observation and photographs were used to assess overall animal health post-treatment (Figure 5).
Natural Treatment Herbicide Treatment
CHAPTER 4: RESULTS
This field trial lasted 60 continuous browsing days in July and August, 2009. Daily observation and measurements were taken from three replications on each treatment. The results for the research indicate that intense goat management can be a key to successful vegetation reduction in a young plantation forest. The results are described in two ways: with data analysis of samples of vegetation and trees on site; and through direct observation of goat browsing preferences and behavior. Analyses were performed on each of the dry weight sample categories measured within the field research area. The categories are represented as Trees, Forbs (shrubs and vines), Grasses, and Dead vegetation.
Pre-Treatment Dry Weight Sample Results
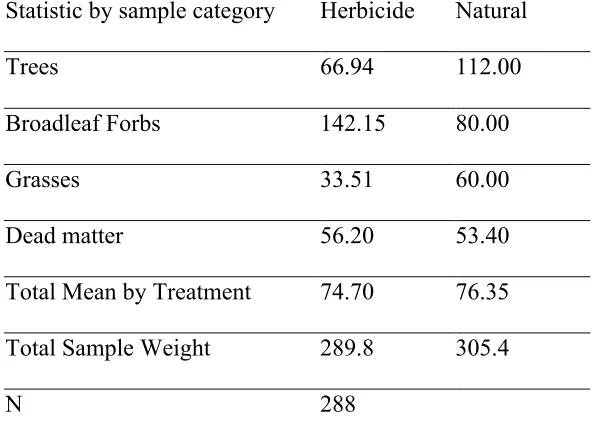
Table 1: Descriptive Statistics for all Dry Weight Means in Both Treatments (grams per sample).
Statistic by sample category Herbicide Natural
Trees 66.94 112.00
Broadleaf Forbs 142.15 80.00
Grasses 33.51 60.00
Dead matter 56.20 53.40
Total Mean by Treatment 74.70 76.35
Total Sample Weight 289.8 305.4
N 288
Each vegetation category was then analyzed in the same manner by testing the
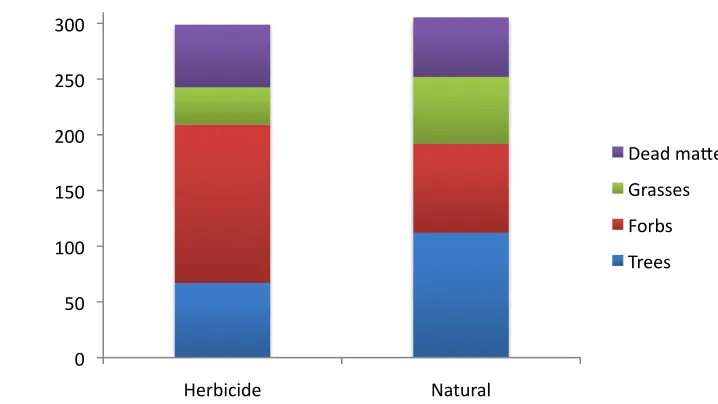
Figure 6: Comparison of mean dry weights for two treatments of all samples for three replications (grams per sample).
Pre-Treatment Dry Weight Tree Samples Statistical Analysis Results Tree dry weight samples for both treatments were different from each other at
probability value of 0.043 (Table 3). Natural plot samples had a mean value sample weight of 111.56g/m3 grams and Herbicide tree samples had a mean of 66.94 g/m3.
0 50 100 150 200 250 300
Herbicide Natural
Dead ma5er Grasses Forbs Trees
Table 2: Dry Weight Tree samples, measured in grams per sample meter cubed.
Treatment
Mean Probability > F 0.0435
Herbicide 66.94
Natural 111.51
The tree samples’ dry weights in Table 2 clearly shows that the Natural plots samples had a higher mean weight than the Herbicide treatment at over 111 g/m3mean sample weight versus approximately 67 g/m3grams mean sample weight of the Herbicide tree samples at a probability of 0.0435. This is because there were more branches and limbs in the cylindrical sample area that we clipped for small brushy hardwoods in the natural stands compared to the pine stands.
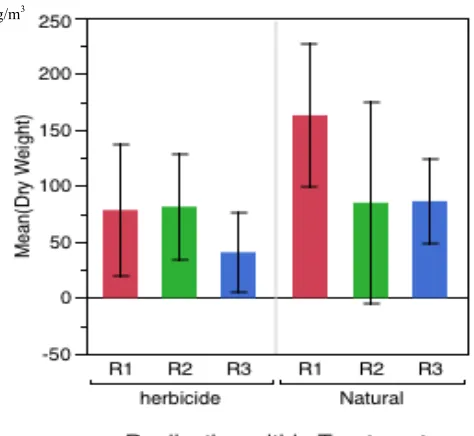
Figure 7: Comparison of mean dry weights for two treatments of tree samples for three replications g/m3
As noted, the explanation for this could be that we didn’t cut down an entire tree stem if it fell into our sample area because goats wouldn’t eat the entire tree; instead, we clipped branches and leaves within the cylindrical shape of a sample measurement (1.196 cubic meter volume). In the case of the Natural treatment plots, there were many more small sapling hardwood trees available to sample versus the Herbicide treatment plots, where there were primarily plantation pines in the tree samples category, which, therefore, would not have been cut at the stem but only the branches.
Pre-Treatment Dry Weight Forb Samples Statistical Analysis Results
Table 3 describes the forb sample values for the least squares calculation of Herbicide treatment at 142.15 g/m3 and the Natural treatment mean value of 79.98 g/m3with a standard error of 13.63 g/m3 and a probability of 0.0019. Forbs were much more prevalent in the herbicide-treated plots than in the natural plots.
Table 3: The least squares mean dry weights of Forbs samples of two treatments g/m3 Level Least Sq Mean Std Error Probability > F 0.0019
Herbicide 142.15 13.64
Natural 79.98
Table 4: Least Squares mean values for samples of dry weight grass samples in both treatments g/m3
Level Least Sq Mean Std Error Probability > F 0.01
Herbicide 33.51 7.22
Natural 60.16
Figure 8: Before and after goats. Herbicide Treatment, Plot 2
Figure 9 shows the dense vines and shrubbery present in the Herbicide plot, indicative of that treatment area. While Herbicide samples had a mean weight of 32g/m3, Natural treatment plots had a mean dry weight of 58 g/m3, indicating more grasses present in samples on the Natural treatment plots. Figure 9 suggests that the overall Grass samples category were more predominant in replications 2 and 3 of the Natural treatment plots, showing significantly higher mean sample weights than those in all replications of the Herbicide treatment plots.
Tree Samples
We sampled all trees of 2.5 cm (1 in.) or greater diameter in both treatments at 1.83 m (6 ft.) for consistency and to estimate the maximum forage available for goats (estimated browse level of 2 m high). These sample trees were identified, counted, measured and recorded. Figure 9 shows a bar chart of the mean diameter for Herbicide treatment plots of 6.73 cm (2.65 in.); the mean for the trees in the Natural plots was approximately 3.68 cm (1.45 in.). Table 6 provides a side-by-side comparison of the treatment tree sample means in the each of the sample areas. The radii size used for tree sample measurements in this research were different because there were many sapling trees to measure in the small
Table 5: Comparison of Tree measurements of two treatments
Tree Measurements Per .01ha
Herbicide Treatment Natural Treatment
Sample radius 5.64m 3.51m
Sample area 99.93m2 38.7m2
Mean volume of sample area 181.80 m3 70.25 m3
Replication (.01ha) R1 R2 R3 R1 R2 R3
Mean diameter (cm) at 1.83 m
6.71 6.99 6.53 3.87 3.72 4.09
Mean volume (m3) Per plot
0.036 0.033 0.032 0.007 0.008 0.011
Mean Volume per treatment (m3 per .10 ha)
0.033862 0.009018
Expansion Factor 99.93m2/38.7m2 = 2.58 2.58*0.009018
Scaled Tree Volume (m3 per
.10 ha) Comparison
0.033862 0.023283
Herbicide treatment plots (which were about 1/100 ha) had a total sample count of 153 trees; 101 of those sampled were plantation pines. The Natural treatment tree sample plots (which were about 1/250 ha) count totaled 115 trees; 54 of those were plantation pines. This is an indication of smaller diameter hardwood saplings in the Natural plots crowding the plantation trees, thus producing less growth in plantation trees and more sapling hardwoods.
Table 6: Comparison of tree species counts between two treatments measured in tree samples > 2.5 cm
Natural Treatment Herbicide Treatment Species Type
Species Count Species Count
CH 3 CH 0 CH= Prunus serotina Cherry
HI 14 HI 11 HI=Carya cordiformis Hickory
NP 14 NP 33 NP=Pinus taeda Nat. Pine
PO 9 PO 5 PO=Populus deltoids Poplar
PP 54 PP 101 PP=Pinus taeda Planted Pine
RB 2 RB 2 RB=Cercis chingii Red Bud
RO 4 RO 0 RO=Quercus rubra Red Oak
SG 15 SG 1 SG=Liquidambar
styraciflua
Sweet Gum
Total 115 153
Cover Vegetation Density Screen Samples
Using a method adapted from techniques used in wildlife management (Nudds, 1977) for estimation of vegetation cover before and after treatment provided a visual indication of the goats’ effectiveness at browsing areas to approximately 2.5 m in height. Figure 10 represents the overall pre-treatment results from vegetation cover screen density
measurements. The Y-axis in Figure 10 is the mean percentage of vegetation cover density screen visible through the vegetation. The means from 1 meter height samples indicate that we could see only about 10 percent of the cover density screen through the Herbicide plot’s vegetation pre-treatment, and slightly more (~ 16%) visible on the Natural plots, meaning that approximately 85-90% of the screen was obscured by vegetation.
Figure 10: Percentage comparison of pre-treatment vegetation cover across both treatments
Immediately following goat treatment, each plot was sampled again; a mean was taken and combined over all replications within each treatment. The results are shown here in Figure 10. As is visible on both treatments, a significant reduction in cover density occurred post-goat browsing. In Figure 10, the Y-axis represents the percentage of screen visible through the vegetation. Our results suggest that a significant change is evident in the mean sample values at the 1 meter height range. The post-treatment sample means across both Herbicide and Natural plots estimated about 50% visible screen cover density. The difference is about 40% from our pre-treatment measure of the same area, which exceeded our target of about 20% reduction in vegetation before rotation.
Figure 11: Post-Treatment vegetation Cover Density Screen visibility percentage comparison across both treatments
The mean vertical measurement from 2 to 2.5 m showed little difference between treatments, which suggests that the goats are efficient at browsing to about the 2 meter mark regardless of cover type. This might also suggest that intense management of goats is necessary to get desired results in a browse setting since the rotation times between treatments varied significantly based on the forage type available to the animals.
We analyzed the pre- and post-treatment percentage of vegetation reduction within both treatments and compared them with their respective control plots. Table 7 provides screen density measurements for the Herbicide treatment and Table 8 shows the same comparison for the Natural treatment.
Table 7: Comparison of pre-treatment and post-treatment vegetation cover density percentage reduction across Herbicide and Herbicide Control Treatment
Category
Height
M2 Visibility Percent Height M2 Visibility Percent Height M2 Visibility Percent
PRE TREATMENT 1.0 16.18 2.00 20.20 2.50 22.58
Percent of vegetation cover 83.82 79.80 77.43
POST TREATMENT 1.0 51.72 2.00 52.11 2.50 22.96
Percent of vegetation cover 48.28 47.89 77.04
GOAT
EFFECTIVENESS
Percentage of vegetation 1.0 35.54 2.00 31.90 2.50 0.38
reduction
Control 1.0 15.63 2.00 20.88 2.50 23.64
PRE TREATMENT
Percent of vegetation cover 84.38 79.13 76.36
Control 1.0 11.75 2.00 19.38 2.50 22.07
POST TREATMENT
Percent of vegetation cover 88.25 80.63 77.93
plots reduced vegetation by 33.21% while the post-treatment control vegetation had a cover density of 87.5%.
Table 8: Comparison of pre-treatment and post-treatment vegetation cover density percentage reduction across Natural and Natural Control Treatment
Category
Height
M2 Visibility Percent Height M2 Visibility Percent Height M2 Visibility Percent
PRE TREATMENT 1.0 9.97 2.0 13.22 2.5 19.94
Percent of vegetation cover 90.03 86.78 80.06
POST TREATMENT 1.0 50.90 2.0 46.43 2.5 25.22
Percent of vegetation cover 49.10 53.57 74.78
GOAT
EFFECTIVENESS
Percent of vegetation 1.0 40.92 2.0 33.21 2.5 5.28
reduction
Control 1.0 9.63 2.0 12.44 2.5 17.73
PRE TREATMENT
Percent of vegetation cover 90.37 87.56 82.27
Control 1.0 9.36 2.0 12.45 2.5 14.19
POST TREATMENT
Percent of vegetation cover 90.64 87.55 85.81
estimated at a mean of 85% at the 1-meter high mark; post-treatment, the control plot had a 3.88% increase in cover density during the research period. Goats effectively reduced vegetation at the 1-meter height by 35.5%. At a height of 2 meters, vegetation cover before goats had a mean cover density percentage of 80%; goats in the Natural treatment plots reduced vegetation at 2 meters by 32% while the post-treatment control plot had a cover density increase by 1.5% during the research period, indicating over 80% vegetation cover.
The resulting vegetation reduction estimation for the 2.5-meter cover density samples was less significant in both treatments, as indicated in Tables 7 and 8 with exception of the Herbicide treatment control plot that showed an increase in cover density of 3%. This change indicates that there was denser crown cover in the Herbicide treatment trees. The
pre-treatment results in both pre-treatments suggest that there was a range between 77-85%
vegetation cover at the 2.5-meter height, with the Herbicide treatment slightly more densely covered pre-treatment. Post–treatment vegetation cover density samples in both treatments also indicate only a slight change (~5%) in vegetation density.
Goat Activity Measurements
screen-density measurements. Appendix 5 provides the pre-treatment health check data taken prior to putting goats into treatment plots, thereby indicating the weight distribution on both treatments was equalized and the overall fitness of the goats was excellent.
The daily management regime consisted of an early-morning check on each
CHAPTER 5: DISCUSSION
Support from a wide body of literature suggests that agroforestry practices are useful and provide economic, environmental and sustainable benefits to landowners. While the use of goats as vegetation control mechanisms isn’t a novel concept, we were impressed with the goats’ performance in a mixed hardwood setting.
Differences in Forest Treatments
Working in a plantation forest with two different vegetation management treatments, Herbicide treated loblolly pine plantation trees and Naturally grown loblolly plantation pine, provided a look at how competition and spacing play an important role when planting for optimum tree crop growth. In general, the total volume of biomass in the samples of Herbicide treated plots and Natural plots was quite similar, at about 300 grams per sample. However, the distribution of that biomass among components of trees, forbs, grasses, and dead mater was quite different. The herbicide treated plots had more biomass in the broadleaf forbs, followed by the trees branches and leaves (but recall that weight of the the tree trunks were not counted). The Natural plots had a wide variety of trees and branches and leaves, which comprised the largest component of the stands, followed by broadleaf forbs.
non-herbicide plots, giving an opportunity for growth of other, broadleaf species such as Blackberry (Rubus L.) that dominated the undergrowth in the herbicide area.
Dry weights in the Herbicide treatments were higher than in the Natural treatment plot samples. In this case – it is not intuitive to think about an herbicide treated area to have “more” forbs matter than that of an untreated stand, but this particular tree stand was
predominately populated with a dense blackberry cover that was about 4 years old. Figure 8 shows before and after treatment effects on blackberry canes. The canes were thick and weighty and that could account for this finding. In the Natural treatment plots there were no predominant shrubs like blackberry cane and so there was a less significant presence of shrubs within our samples.
The Cover Screen Density technique is adapted from a wildlife scientist (Nudds 1977) who used a similar methodology to estimate the nesting cover density for deer. Adapted as a useful field technique, NC State Wildlife Biologist Aimee Rockhill developed the Density Screen technique further by creating a portable, accurately sized (with equal sized squares) screen with visual measurements that were easy to see through the thick forest brush. The technique described by Rockhill (personal communication, unpublished research) was used to measure brush density for Bobcat hunting cover. Further adapted for this
research experiment, Rockhill’s technique provides an accurate and easily-calculated method for fieldwork in thick brush given a fairly level terrain. The Cover-Density screen is
adaptable in terms of height and worked well for goats in this browsing situation as they have a maximum browse level that was easily captured with this method.
Challenges
Using different sized radii for tree sampling of larger trees within the treatments became a complex challenge to accurately compare trees and vegetation. Most of the trees in the Natural Plots were smaller than 2.5cm, our sample measurement size for trees, and therefore were not computed in the tree volume measurements but instead were weighed and calculated as tree “dry weights” leaving out some of the actual ‘volume’ of tree vegetation available in the sample plots. Future research might account for these differences by taking measurements of all trees within the sample in the same manner.
Goat Effectiveness
Animal performance in this experiment exceeded our expectations for vegetation reduction and in particular in terms of leaving no damage to the crop trees. Goats in this experiment were effective at vegetation control in a mixed hardwood stand to a level of 2 m and with trees and brush with a diameter of 2.5 cm or less. Table 9 compares the rotation length and the predominant forage type available to the goats in each treatment. The criterion for rotation was based on approximately 20% vegetation change and was based on
observation of browsing behavior within each plot and was variable in time due to differences in botanical composition both within and between treatments.
This was interesting that the Herbicide treated plots did place more volume on the crop trees, and had about the same total volume as the Natural stands, but the forbs on those plots actually did not provide as much food for the goats to subsist on. Thus Natural, untreated stands actually would be better for goats, and cost less than having both goats and herbicides. The goats did, however, enjoy eating the blackberries, honeysuckle, briars and forbs on the Herbicide plots, but goat happiness probably is not a forest owner or goat producer goal. In practice though, goats and as a means to thin competition below planted pines did seem to be an ideal mix of moderate competition control and goat health, without having to move the goats as often.
Table 9: Rotational management and understory vegetation type comparison
Natural Treatment Herbicide Treatment
Rotation length 15-22 days 7-10 days
Prominent forage type Hardwood saplings, grasses (hickory, oak, poplar)
Notable behavior included use of teamwork to retrieve browse that was too high to reach from bipedal posture. Many goats would stand or pounce repeatedly on a sapling tree to pull it down so that others could browse. Knowledge of the goats’ history of having no prior experience with browsing (completely pasture-based) provided a look into behavioral changes that happened over the course of the experiment, such as immediately looking up for available browse upon moving to a new plot. Also observed was communal dirt bathing and sun bathing casually, suggesting a non-stressful environment.
Dietary preferences were observed and most important to this research are the goats’ distinct resistance to consumption of the plantation pine tree needles, branches or bark, even in trees less than 2.5 cm diameter until there was little choice, suggesting a positive
interaction with loblolly pine trees used for crops. Goats in the Natural treatment (no herbicide pine tree crop) were observed eating charred tree stump bark on a few occasions while the Herbicide treatment goats were not observed doing this although the same opportunity was given on both treatments. Goats in both treatments seemed to prefer to eat fruit bearing browse over non-fruit bearing browse when possible and specifically enjoyed eating Sumac (Rhus aromatica) berries and leaves, often until they were bloated and lethargic.
styraciflua). On two occasions, it was noted goats were eating yellow crown beard, (Verbesima Occintalis) where in other, pasture settings the same goats would not eat this plant.
Methods and Management
The screen density measurement technique was a good tool for goat browse measurement. For example, we looked at the pre-treatment results in both treatment types and the control plots, where overall, there was more than 77% vegetation cover at the 2.5 meter height, with the Herbicide treatment slightly more densely covered pre-treatment. Post–treatment vegetation cover density samples in both treatments also indicate only a slight change (~5 percent) in vegetation density. A few factors can be attributed here. The age of the tree stand is one possible reason for less defoliation above the 2.5 meter height. The canopy for the 9-year old plantation trees in our research stand is fairly open at 3 m. Also, some of this might be potentially, due to the loss of some sapling trees as the goats browsed through during treatment.
Working with a prey animal such as goats in a forest setting, protection is an
CHAPTER 6: CONCLUSION
The specific objectives of this research project were to assess and demonstrate sustainable operational protocols in goat and forestry management, to measure how browsing affects desired and undesired forest vegetation and economically valued tree species, measure goat health in a forest setting, identify browse preference, and to integrate sustainable agricultural practices and promote best management practices for woodlot owners.
In a study by Luginbuhl et al. (1999), goats were an effective tool in reclamation of pastureland in an orchard setting in the Appalachian region of the United States. The research provides an example of an environment similar to our research in that there are crop trees and undesirable vegetation beneath. Goats grazing for eight-week periods over four years
beginning in May resulted in 21% mortality by the beginning of the second year, 78% by the third year and 94% by the beginning of the fourth season. Additionally noted in this study, due to goats’ versatile grazing/browsing behavior, they are able to successfully control unwanted vegetation while at the same time selecting a diet that meets their nutritional requirements in situations where other domestic ruminant species would be at a
disadvantage. This indicates that there is reduced pressure on the landowner to keep the weight, and nutrition of the animals as priority in a browse setting.
Figure 12: Goats browsing in a natural mixed pine-hardwood stand
While the use of goats as vegetation control mechanisms isn’t a novel concept, we were impressed with goat performance in a mixed pine-hardwood setting in reducing vegetation by about 50%. It is worth noting that we aimed to reduce vegetation to a 20% level, but this seemed to be too low a target. The goats became too hungry before that and started working together to pull down larger trees, which could damage crop trees as well. So the 50% level ended being more practical in actual operations.