* Corresponding author: [email protected]
Study of a distributed ICRF antenna system in DEMO
Riccardo Ragona1,2,* and André Messiaen1
1Laboratory for Plasma Physics, Royal Military Academy, (LPP-ERM/KMS), BE-1000, Brussels, Belgium 2Ghent University, Department of Applied Physics, 9000 Ghent, Belgium
Abstract. Different feeding options for distributed ICRF antenna systems in DEMO are analysed and compared, based on detailed circuit modelling. Voltages and currents (amplitude and phase) are computed for each element of the array. The power delivered by the feeding networks is evaluated characterizing each system. Although the results presented are for a small number of radiating elements, the procedure can be scaled to any arbitrary number of straps and feeding connections. Among the three options analysed (i.e. all-fed; distributed; resonant ring) the resonant ring feeding appears to be the most suitable configuration for a traveling wave array distributed antenna system in the DEMO reactor.
1 Introduction
An Ion Cyclotron Range of Frequency (ICRF) distributed antenna integrated in the blanket of the DEMO reactor is presently considered as a candidate system to heat the central plasma core without density cut-off. Lower power density is envisaged in order to not exceede the voltage standoff due to the large coupling evanescent length. A large number of radiating elements are used to couple the required power while achieving the low level of power density. The feeding of those elements plays an important role in the overall design of the ICRF system. While an independent feeding for each element allows the best control on the radiated spectrum, it poses some technical difficulties like the large number of intrusions in the reactor vessel and the intrinsic coupling between adjacent lines that complicates the external matching circuitry. A travelling wave array [1] is then a possible solution allowing a considerably smaller number of feeding lines and a simplified external circuitry. Integration in the DEMO design requires a detailed analysis of the possible system solutions for the launcher and the corresponding feeding mechanism. The aim of this contribution is to explore some of those possibilities.
Three different feeding cases are here analysed: (i) an array with all elements fed [2], (ii) an array with periodic conventional feeding [3] and (iii) an array with resonant ring recirculation feeding system [1]. We first analyse case (i), the case with the best possible performances [4] although with the drawback of requiring a large number of mutually coupled feeding lines. In the second case the dependency of the response of the structure with different relative phasing of the generators is analysed and the power capabilities are studied. In the last section an array fed with one resonant ring is compared to the traveling wave array (TWA) of [1] and a general case of
two consecutive resonant rings is studied. Conclusions are then presented.
2 Analyses
2.1 Simulation parameters
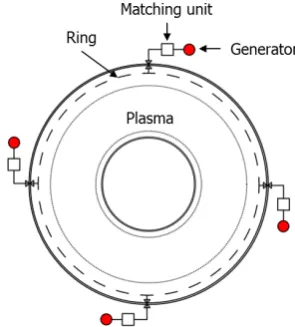
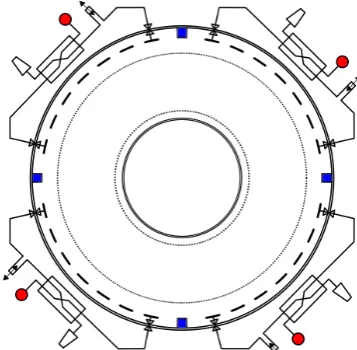
All the three cases analysed are based on an array of 28 elements, i.e. Nstr=28. In Fig. 1 the array is presented in
one of the feeding configuration analysed (case (ii)). A predominantly diagonal matrix can describe this array with some elements at the upper right and lower left corners due to the symmetry of each radiating element w.r.t. the neighbouring ones. Here only the mutual coupling with the first two neighbours (on each side) are considered. Exploiting the symmetry of the system means that all values of the self-inductance Li=L and
mutual couplings Mi+1=M1, Mi+2=M2, for i = 1, …, Nstr,
are respectively the same and all other elements of the
strap impedance matrix Zs are set equal to zero. At a
frequency f0=50MHz, ω0L=56Ω, ω0M1=17.3Ω and ω0M2=7.25Ω, being ω0=2πf0 the angular frequency. A
resistance Ri=R=2.5Ω is added in series to each strap to
account, in an appropriate way, for the coupling of power to the plasma. This arbitrary value is chosen as reference to compare the different cases and it is not consistently derived from a coupling code (e.g. ANTITER [5]). The array is configured as combline with a tuning reactance on each strap and can be described by an array impedance matrix Za such that
1/Za =1/Zs+1/Zc where 1/Zc is the admittance matrix of
the tuning capacitors. The details of the modelling procedure are explained in [4]. It is worth to remind that, in its pass band, the combline acts as transmission line with characteristic impedance Z0 = Zit = (Z112- Z122)0.5 [1]
where: Zit is the iterative impedance of the structure [6]
and Zii (i=1,2) are the terms of the symmetric Z matrix that characterise the two-port network. In other words, Zit
is the impedance seen at the input of a two-port network when the output is terminated on the same input impedance.
2.2 360o array – all straps fed
A continuous array distributed 360o all around the
machine is fed at each element by an independent generator connected through its own matching-decoupling network [2]. The generators are feedback controlled to provide the same strap current amplitude |Is|=178A with a phase difference Δφ between elements
such that the peak of the spectrum is centred on kz,M = p
kz,M0. The index p represents the harmonic number of
kz,M0 = 2π/(NstrSz) where the denominator is the perimeter
of the array with Sz the inter-strap distance, i.e. the
distance between the centre of two consecutive elements. For kz,M = 3.74m-1 (Sz=0.3m, kz,M0 =0.748m-1 harmonic
p=5) each strap has the following values: maximum voltage |Vstr| = 11.09kV, input impedance and input
current respectively Zin = (187+i503)Ω and |Iin| = 20.67A
seen and provided by the generators. The input current is given by the sum of the current on the strap and the one in the tuning capacitor: Iin = Is + Ic.
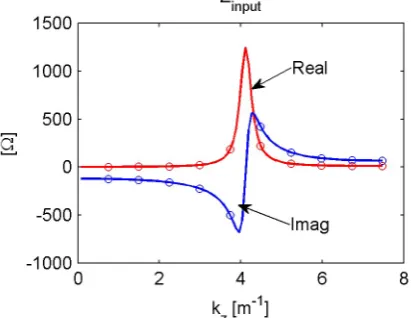
In Fig. 2, the value of the input impedance of the array is
computed for the discrete set of kz,M, each of those is
chosen by a different Δφ (represented by the dots). The
computation of a continuous spectrum for kz,M (lines)
reveals a resonance in the input impedance when kz,M is
equal to the one obtained by the dispersion relation of the traveling wave structure at the tuned frequency f0.
For this value we have minimum amplitude of the input voltage required to obtain the requested strap current. This is valid only in the assumption that the loading resistance is the same for each element. A variation of the plasma loading on one (or more) radiating element(s), or a failure of the corresponding generator(s), will lead to a change in the input impedance seen by the neighbouring generators causing an important power imbalance. A complicated matching-decoupling network is needed to compensate the impedance mismatch. Then the system cannot be made easily load resilient.
2.3 360o array – periodic feeding
A possible way to reduce the number of feeding lines is to provide periodic feeding to the 360o array. Here we
analyse a case where the array is fed with 4 independent generators evenly distributed (depicted in Fig. 1) and connected to the elements 1, 8, 15 and 22. Two different phasing cases for the generators are studied: (A) Δθ = π
Fig. 2. Input impedance for different spectrum peak positions. Fig. 4. Voltage amplitude along the array for the two cases considered.
and (B) Δθ = π/2. The resulting excitation spectra are shown in Fig. 3 where the reader will recognise the shape with two main peaks typical of case (A). From the point of view of traveling waves, (A) corresponds to the case in which two opposite directed traveling waves interfere leading to a standing wave pattern. To be noted the absence of coaxial modes (kz<k0≈1.05m-1) excitation.
The voltage amplitude distribution on each strap is shown in Fig. 4, for an applied forward voltage of V+ =
10kV. It appears to vary considerably and every 7 straps a spatial symmetric pattern emerges from the graph in both cases.
Not surprisingly this is the same number of elements in between two adjacent generators.
The current amplitude distribution presents the same characteristics of the voltage one. The value of the phase at each strap is shown in Fig. 5.
The array impedance matrix Za
reveals the strong coupling between the fed elements (i.e. #1, #8, #15 and #22) connected to the 4 generators. The characteristic impedance of the ring is Z0,a = 69Ω.
The contribution of each generator to the active power provided by the 4 fed elements is given by the power matrix PA and PB for the two different cases analysed.
The real part of the two power matrices is:
and
where each generator is delivering respectively PG,A =
429kW or PG,B = 534kW giving rise to total power levels
of Ptot,A = 1.72MW for case (A) and Ptot,B = 2.14MW for
case (B).
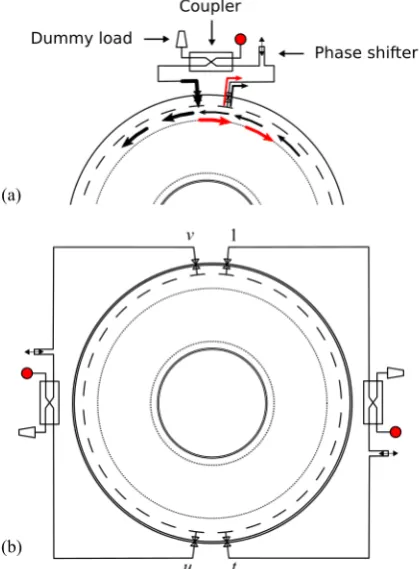
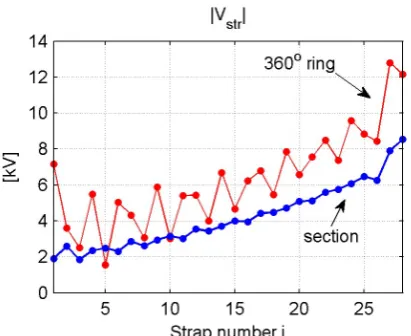
2.4 360o array – consecutive resonant rings The circular array of 28 elements used in the previous examples is now fed firstly by one resonant ring circuit and secondly by two consecutive one (Fig. 6). A TWA section fed by a resonant ring system was analysed in [1] and will be here compared with the first case where the resonant ring is connected to two arbitrary but consecutive elements, e.g. #28 and #1. The main difference with a normal TWA section is the mutual coupling between the inputs of the circuit due to the circular symmetry of the ring. This leads to a substantial differences in the array behaviour: (i) a different characteristic impedance of the array Z0 = Zit and (ii) a
much larger voltage and current amplitudes variation compared to the exponential decay of the single section. An example of the amplitude of the voltage is shown in Fig. 7. The parameters are: Z0,r = 85Ω for the ring, Z0,s =
148Ω for the section and VG+ = 10kV. The forward
power is then computed by P+ = 0.5|VG+|2/Z0, i.e. P+r =
588kW and P+s = 338kW. The linear phase variation
Fig. 5. Phase along the array for the two cases considered.
Za=
42.11
-i6.29 -13.76 -i36.81 2.04 + i49.39 -13.76 -i36.82 13.76
-i36.81 42.11 - i6.29 -13.76 - i36.81 2.04 + i49.39 2.04 +
i49.39 -13.76 -i36.81 42.11 - i6.29 -13.76-i36.81 -13.76 -
i36.81 2.04 + i49.39 -13.76 - i36.81 42.11 - i6.29
Re(PA)=
2.521 0.824 0.122 0.824
100kW 0.824 2.521 0.824 0.122
0.122 0.824 2.521 0.824 0.824 0.122 0.824 2.521
Re(PB)=
5.616 4.911 -0.271 -4.911
100kW -4.911 5.616 4.911 -0.271
-0.271 -4.911 5.616 4.911 4.911 -0.271 -4.911 5.616
along the array is however preserved (see Fig. 8). As a consequence, the spectra for the two cases assume the shape shown in Fig. 9 where in the case of the ring a
backward component appears as a sign of a wave traveling in the opposite direction, injected in the line due to the mutual coupling between the inputs, as depicted in Fig. 6a by red arrows.
Both the section and the ring maintain the capability of controlling the position of the peak varying the frequency.
The second case consists of the same ring fed by two consecutive resonant rings (see Fig. 6b), connected symmetrically at the elements 1, t, u and v. As seen above, there is mutual coupling between the output (e.g. 1, u) and the input (e.g. t, v) of the two resonant ring feeding systems due to the terms Z(1,v), Z(v,1), Z(t,u) and Z(u,t) of the array impedance matrix Za. For our
particular case: v = 28, u = 15 and t = 14. Also in this case the voltage amplitude presents large fluctuations, shown in Fig. 10, due to the interference of opposite directed traveling waves that manifests itself again in the spectrum, like for the case in Fig. 9. But here, due to the strong modulation of the current on the straps, side peaks appear in the spectrum as shown in Fig. 11.
The real part of the power matrix for this case is:
that gives P1 = P15 = -432kW, P14 = P28 = 991kW. The
negative values show that the power is extracted from the structure and recirculated in each resonant ring. The total power delivered by the array is Ptot = 1.18MW.
3 Conclusions
Re(PA)=1.615 -1.046 -0.078 -4.807
100kW 1.006 4.474 4.646 -0.217
-0.078 -4.807 1.615 -1.046 4.646 -0.217 1.006 4.474
Fig. 7. Voltage amplitude along the array for the two cases considered and for a generator forward voltage VG+=10kV.
Fig. 8. Phase along the array for the ring and for the section.
Fig. 9. Spectra for the ring and for the section.
The analysis based on the 28 elements array can be generalized to an arbitrary number of radiating elements and sections. The results presented, that are independent on that arbitrary number, shows that the preferred system for DEMO is the self-tuned strap array sections fed in resonant ring configuration (e.g. Fig. 6b), where the number of sections depends on the total number of elements. It has the advantage of: (i) best selective excitation spectrum, (ii) load resilience and (iii) simplicity of its adjustment. The load resilience is a characteristic of the resonant recirculation ring [1]. Moreover, a configuration with separate sections (e.g. Fig. 12), ideally one per each sector of the machine, provides better reliability than all other solution: if one element (or one generator) of one section fails, the other ones will not be significantly affected. In the example in Fig. 12 the sections are isolated by means of short blanket segments (blue rectangles).
An example of a DEMO system is given in [4].
The second layout that provides excellent RF performances is the 360o ring array with each strap fed
independently. For this system, the problems of load resilience and mutual coupling between feeding networks are not yet solved and all solutions based on a complete 360o strap ring will suffer from mutual
coupling between the feeding networks and from
standing waves along the TWA structure that will lower the performance.
This work has been carried out within the framework of the EUROfusion Consortium and has received funding from the Euratom research and training programme 2014-2018 under grant agreement No 633053. The views and opinions expressed herein do not necessarily reflect those of the European Commission.
References
1. R. Ragona and A. Messiaen, Nucl. Fusion 56 (2016) 076009.
2. G. Bosia and R. Ragona, this conference. 3. G. Bosia, Fus. Eng. and Design 92 (2015) 8-15. 4. A. Messiaen and R. Ragona, this conference. 5. A. Messiaen et al, Nucl. Fusion 50 (2010) 025026. 6. C. G. Montgomery, R. H. Dicke, and E. M. Purcell.
Principles of Microwave Circuits, volume 8 of MIT Radiation Laboratory Series. McGraw-Hill, New York, 1948
Fig. 11. Spectrum for the ring fed by two consecutive resonant ring systems.