The End Point Tagger physics program at A2@MAMI
Oliver Steffen1,a, on behalf of the A2-Collaboration
1Institut für Kernphysik, Johannes Gutenberg-Universität Mainz, Johann-Joachim-Becher-Weg 45, 55099 Mainz
Abstract.The A2-Collaboration uses a beam of real photons from the tagged photon facility at the electron accelerator MAMI in Mainz, Germany, to study photo-produced mesons. A new tagging device allows access to the higher photon beam energy range of 1.4 to 1.6 GeV. A large dataset containing more than 6 millionηand roughly 29 millionω decays has been obtained. Analyses are ongoing, including a study of the cusp effect and Dalitz plot inη→ηπ0π0, giving insight to theππscattering length and the structure of theηππsystem, as well as the measurement of the electromagnetic transition form factor inη→e+e−γ, a cross section measurement ofγp→3π0, and branching ratio analyses ofη→ωγandω→ηγ.
1 Introduction
The A2-Collaboration uses the tagged photon facility at the Mainz Microtron MAMI [1] to study baryon resonances, meson photoproduction and meson de-cays.
After upgrading the existing experiment setup, a large dataset containing more than 6 millionηdecays has been obtained during 10 weeks of beam time in 2014. It serves as a rich base for many physics topics to be studied. Analyses are ongoing, including the measurement of the electromagnetic transition form factor inη→e+e−γis relevant for the understanding ofη/ηmixing and theory of the anomalous magnetic moment of the muon (see section 3.1). A study of the cusp effect and Dalitz plot inη→ηπ0π0, giving insight to theππscattering length and the structure of theηππsystem (see section 3.2). Branching ratio analyses ofη→ωγand ω→ηγ will provide input for chiral effective theories (see section 3.3). The cross section measurement ofγp→3π0will extend existing data from previous measurements (see section 3.4).
2 Experiment
The electron beam produced by the MAMI multi-stage racetack microtron has an energyEbeamof up to
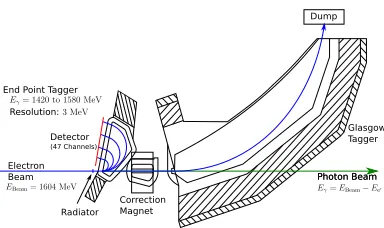
1.6GeV [1]. It is converted into bremstrahlung pho-tons by a thin copper foil. The electron, together with the unused portion of the beam, is bent away by the tagging spectrometer magnet (see Fig. 1). The energy of the scattered electronEscattered is measured by a hodoscope, and the photon energy can be calculated:
Eγ=Ebeam−Escattered. Forming a time coincidence
ae-mail: steff[email protected]
Dump
Glasgow Tagger
Photon Beam Photon Beam
Radiator Detector
(47 Channels)
Correction Magnet End Point Tagger
Electron Beam Resolution:
Figure 1. The photon tagging setup: Bremsstrahlung is created by shooting electrons on a thin metal foil. The energy of the scattered electrons is measured by a mag-netic spectrometer. The specialized End Point Tagger is mounted in front of the main tagger, followed by a correc-tion magnet.
with the detector system of the experiment makes it possible to energy tag the photons.
A new tagging device, the End Point Tagger, was constructed in 2014. It focuses on the highest photon energies of the bremsstrahlung spectrum from1.4GeV to1.6GeV with a resolution of3MeV. It is an ideal tool to study rare and comparatively heavy mesons like theη and theω, produced in photo production reactions off the proton (see Fig. 2). Together with upgrades and fine-tuning of the readout system the existing experimental setup could be turned into an
ηfactory.
The photon beam impinges on a 10 cm long cell filled with liquid hydrogen, acting as a high density proton target. The target cell is contained in a cryo-stat and cooled down to temperatures below20K.
/ [GeV]
γ
E 1 2 3 4 5 6 7 8 9
Br
emsstrahlung P
robability [a.u]
Meson P
h
otopr
o
d
uct
ion Cr
oss Sect
ion
Tagger
EPT 1
10 10² 10³
0 0.5 1 1.5
[μbar
n]
total
'
Figure 2. Sketch of photoproduction cross sections for prominent mesons (points) in the energy range covered by the Crystal Ball/TAPS experiment, together with the energy distribution of the bremsstrahlung spectrum (line). The End Point Tagger focuses on a narrow energy region around theη threshold, while the main tagger covers a wide range of the lower energies. This allows rejection of the much more probable low energetic background events.
BaF2
PbWO4
Target
Photon Beam
PID & MWPC
TAPS
Crystal Ball
Vetos
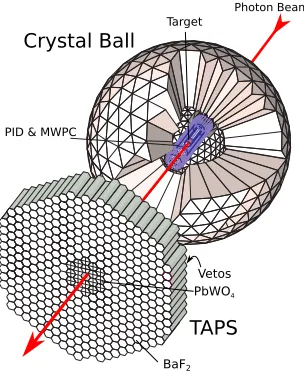
Figure 3. The detector system: The calorimeters Crystal Ball and TAPS cover over96%of the solid angle. Addi-tional particle identification detectors are located around the target and in front of TAPS.
The target is surrounded by the main calorimeter, the Crystal Ball [2]. It consists of 672 thallium doped sodium iodine crystals (NaI(Tl)), forming a sphere. The forward opening is covered by the TAPS detec-tor [3], forming a wall of 366 barium fluoride (BaF2) and additional 72 lead tungstate (PbWO4) crystals. These detectors together cover over96 % of the full solid angle (see Fig. 3) and are ideal for the mea-surement of neutral final states. Both calorimeters
are equipped with additional detectors made out of plastic scintillators, allowing particle identification by measuring the energy loss of traversing charged par-ticles. Additionally, a pair of cylindrical multi-wire proportional chambers (MWPC) is located inside the Crystal Ball. Due to the extremely high rates they could not be used in the beam times mentioned above. Table 1 summarizes the properties of the detector sys-tem.
CB TAPS
Energy Resolution √4E2 % γ/GeV
0.8 %
√
Eγ/GeV+ 1.8 %
Crystals 672 438
Material NaI(Tl) BaF2, PbWO4
3 Analyses
3.1 Electromagnetic Transition Form Factors
The electromagnetic transition form factors (TFF) of pseudo-scalar mesons are important input for solving the mystery of the anomalous magnetic moment of the muon [4] and better understanding the η/η mixing [5].
Currently a 3.6σdiscrepancy exists between then experimental observation [6] and theoretical predic-tions of aμ = (g−2)/2. The theory is limited by QCD contributions [7, 8], consisting of hadronic vac-uum polarizations and hadronic light-by-light scatter-ing [9], where the transition form factors enter in the description primarily through the light-by-light scat-tering terms. The studies of meson decays allow the measurement of the q2 dependent TFF in the time-like region (q2 >0). They appear as a modification of the QED prediction of the differential cross section for the point-like meson:
dσ
dΩ=
dσ
dΩ
QED
·F(q2)2 (1)
Electromagnetic transition form factors of theπ0[10] andη[11] meson have already been studied in previ-ous experiments of the A2-Collaboration (see Fig. 4). This experiment gives the opportunity of extending the existing data set to higher energies and also study theηTFF in theη→e+e−γdecay, to complete the set of TFF of the light neutral mesons. The experi-ment covers a wideq2range in the time like region up toq2 ≈0.7GeV2. This allows a fit containing theρ
peak region which is not covered by competing experi-ments [12]. A Monte Carlo simulation of the expected
q2distribution is shown in Fig. 4. The analysis is still ongoing.
] 2 [GeV/c -e + e m
0.02 0.04 0.06 0.08 0.1 0.12 0.9 0.95 1 1.05 1.1 1.15 1.2 1.25 1.3
This Work: Data This Work: Fit
approxim. e Pad DA Preliminary 2| |F a) ] 2
) [GeV/c
-l
+
l
m(
0 0.1 0.2 0.3 0.4 0.5
2|
|F
1
This Work: Data This Work: Fit A2, 2014 A2, 2011 TL calculation appr. (2014) e Pad
b)
] 2 [GeV 2 q0 0.1 0.2 0.3 0.4 0.5 0.6 0.7 0.8 0.9
' events η # 1 10 2 10 Simulation VMD fit QED calculation Simulation VMD fit QED calculation c)
Figure 4. Electromagnetic transition form factors previ-ously studied at A2: a) Preliminaryπ0TFF fromπ0→
e+e−γ [10], b)η TFF fromη →e+e−γ [11], c) Monte
Carlo simulation of the q2 distribution ofη →e+e−γ,
together with a VMD fit and the QED calculation.
) [MeV] π 2 η IM(
8500 900 950 1000 1050 10000 20000 six_fit_IM_eta2pi_Buffer Entries 32604 Mean 951.2 RMS 24.82 Experiment Exp. signal Fitted background Fitted background + signal Fit range Peak region
Preliminary
a)
X 0.0 0.5 1.0Y 1.0 − 0.5 − 0.0 0.5 1.0 0 100 200 300 400 500 600 700 Preliminary b)
Figure 5. a) Invariant mass spectrum corresponding to one bin in the Dalitz plot. The peak fromη→ηππ is
clearly visible above the background. b) One half of the symmetric Dalitz plot, containing1.3×105events.
3.2 Cusp Effect and Dalitz Plot
The large amount ofηallows detailed studies of the
η→ηπ0π0decay. Two analyses of particular interest are the Dalitz plot analysis amd the search for the cusp effect.
A Dalitz plot analysis reveals the full information about the dynamics of a decay. The Dalitz plot vari-ablesXandY forη→ηπ0π0can be calculated from the kinetic energiesTand massesmof the decay prod-ucts as follows:
X=
√
3(Tπ1−Tπ2)
Q (2)
Y =(mη+ 2mπ) mπ
Tη
Q −1 (3)
Q=Tπ1+Tπ2+Tη=mη−mη−2mπ. (4)
Since the two pions,π1andπ2, are indistinguishable both combinations have to be considered, making the plot symmetric inX. This Dalitz plot is well suited for testing extensions of chiral perturbation theory, such as large Ncand resonance models [13, 14, 15]. The plot obtained during this experiment contains
1.3·105 events (see Fig. 5). This is a significant in-crease in statistics compared to previous experiments of the GAMS-4π (1.5·104 η →ηπ0π0 events) [16] and BES-III (4.3·104 η→ηπ+π− events) [17] col-laborations. The Dalitz plot parametersa,b, andd
can be extracted by fitting
|A|2=|N|21 +aY +bY2+cX+dX2 (5)
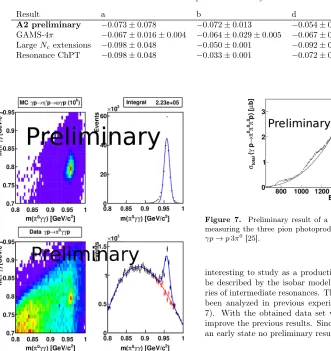
to the plot. The parameter c, describing the slope inX, cannot be extracted since the plot in this case is symmetric inX. The preliminary values from this analysis are compared to previous measurements and theory calculations in table 2.
A cusp effect, due toπ+π−→π0π0re-scattering, has been predicted for η →ηπ0π0 [18] and is also being studied with the data set. This kind of effect was first observed inK+→π0π0π+by NA48/2 [19], and has also been predicted for η/KL0 → 3π0 as a few percent effect. The analysis of the cusp would allow the determination of the S-waveπ0π0scattering length [20, 21].
3.3 Branching Ratio Measurements
Reactions between pseudo-scalar and vector mesons with a photon at the same vertex contain valuable input for implementing vector mesons in chiral effec-tive field theories. The goal is a consistent picture of pseudo-scalar and vector mesons within the theory and finding a way to set up a power counting for un-stable particles which to fulfill additional constraints due to spin 1 nature [15, 22].
The decay η → ωγ has a branching ratio of
Result a b d
A2 preliminary −0.073±0.078 −0.072±0.013 −0.054±0.009
GAMS-4π −0.067±0.016±0.004 −0.064±0.029±0.005 −0.067±0.020±0.003
LargeNcextensions −0.098±0.048 −0.050±0.001 −0.092±0.008
Resonance ChPT −0.098±0.048 −0.033±0.001 −0.072±0.001
Figure 6. Branching ratio measurement ofη→ωγ:
Pre-liminary invariant mass spectra from Monte Carlo (pure signal sample) and Data (including background).
branching ratio measurement of this decay relative toη→γγis being performed on our data set with about104estimated signal events. Preliminary invari-ant mass spectra from Monte Carlo and experiment data are shown in Fig. 6.
Additionally about 29 millionωmesons were pro-duced during this experiment, which allows the mea-surement of theω→ηγ decay (Γi/Γ = (4.6±0.4)·
10−4[23]). We are performing a relative measurement
toω→π0γ, with an expected number of about 1500 signal events.
3.4 Photoproduction cross section of3π0
The photo production process of three neutral pions off the proton, γp → p3π0, is a major background for the other ongoing analyses. This reaction is also
Figure 7. Preliminary result of a previous experiment measuring the three pion photoproduction cross section:
γp→p3π0[25].
interesting to study as a production process. It can be described by the isobar model and involves a se-ries of intermediate resonances. The cross section has been analyzed in previous experiments [25] (see fig 7). With the obtained data set we can extend and improve the previous results. Since the analysis is in an early state no preliminary results can be shown.
4 Summary
With the specialized tagging spectrometer and the upgraded detector readout of the Crystal Ball/TAPS experiment a large data set of η and other mesons was recorded in 2014. Analyses are now ongoing within the A2-Collaboration: A study of the3π0 pho-toproduction cross section, a Dalitz plot analysis of
η →ηππ, including the search for a cusp effect, as well as the measurement of the electromagnetic tran-sition form factor inη→e+e−γ, and branching frac-tion measurements ofη→ωγandω→ηγ.
References
[1] M. Dehnet al., EPJ Special Topics198, 19 (2011).
[2] M. J. Oreglia, PhD Thesis, Department of Physics of Stanford University (1980).
[3] R. Novotny, IEEE Trans. Nucl. Sci. 38, 379 (1991).
[4] E. Czerwinski et al., arXiv:1207.6556 [hep-ph], (2012).
Table 2. Preliminary results for the Dalitz plot parameters in the decayη →ηπ π (χ/dof= 233.6/195 = 1.198) with statistical errors, compared to the GAMS-4πmeasurement and predictions from largeNcand resonance
[5] L. Ametller, Phys. ScriptaT99. 45 (2002).
[6] G. W. Bennett et al., Phys. Rev. D73, 072003 (2006).
[7] M. Davieret al., Eur. Phys. J. C71, 1515 (2011). [Erratum: Eur. Phys. J.C72, 1874 (2012)].
[8] K. Hagiwaraet al. J. Phys. G38, 085003 (2011).
[9] P. Masjuan, Nucl. Part. Phys. Proc. 260, 111 (2015).
[10] P. Adlarson et al., Phys. Rev. C 95, 025202 (2017).
[11] P. Adlarson, et al., Phys. Rev. C 95, 035208 (2017).
[12] M. Ablikim et al., Phys. Rev. D 92, 012001 (2015).
[13] R. Kaiser and H. Leutwyler, EPJ C 17, 623 (2000).
[14] R. Escribanoet al., JHEP2011, 94 (2011).
[15] G. Eckeret al., Phys. Let. B223, 425 (1989)
[16] A. M. Bliket al., PAN72, 231 (2009).
[17] M. Ablikim et al., Phys. Rev. D 83, 012003 (2011).
[18] Kubis, B., Schneider, S., EPJ C62, 511 (2009).
[19] J.R. Batleyet al., Phys. Let. B633, 173 (2006).
[20] N. Cabibbo and G. Isidori, , JEHP03, 21 (2005).
[21] C.-O. Gullström, A. Kupść and A. Rusetsky, , Phys. Rev. C79, 028201 (2009).
[22] C. Terschlüsen, S. Leupold, and M. F. M. Lutz, Eur. Phys. J. A48, 190 (2012).
[23] K. A. Oliveet al., Chin. Phys.C38, 1 (2014).
[24] M. Ablikim et al., Phys. Rev. D 92, 051101 (2015).
![Figure 4. Electromagnetic transition form factors previ-eCarlo simulation of theously studied at A2: a) Preliminary π0 TFF from π0 →+e−γ [10], b) η TFF from η → e+e−γ [11], c) Monte q2 distribution of η′ → e+e−γ,together with a VMD fit and the QED calculation.](https://thumb-us.123doks.com/thumbv2/123dok_us/8143473.1357485/3.482.38.228.448.527/electromagnetic-transition-simulation-theously-studied-preliminary-distribution-calculation.webp)