A New Variable for Spatial Accessibility Measurement
in Social Infrastructure Planning
Y. Li1, A. J. Brimicombe2
1,2Centre for Geo-Information Studies
University of East London, University Way, London E16 2RD Telephone: 0044 2082232603, 2352
Fax: 0044 2082232918
Email: [email protected], [email protected] http://www.uel.ac.uk/geo-information
1. Introduction
The quantitative analysis and modelling of networks and their flows as processes of spatial organisation came sharply into focus in the 1960s (e.g. Chorley & Haggett 1967) and, along with spatial cognition and navigation/wayfinding, remain on the research agenda for GIScience (e.g. Duckham et al. 2003). Accessibility commonly refers to the ease with which something or somebody can be reached, which from a spatial perspective also implies nearness (distance) or ease of travel. In this study, carried out in the context of social infrastructure planning in the UK, equitable access to facilities across a region shows a consistent match between supply and demand and can be taken as an indicator of good planning (Rosero-Bixby 2004, HUDU 2007). Thus measures of spatial accessibility are a means of analysing inequalities within the organisation of social services (Waters 2000). To provide a variable that captures accessibility at UK census Output Area (OA) level as an input to analyses of inequalities and to inform social infrastructure planning, an approach has been developed and tested which is less computationally intensive and overcomes some of the disadvantages of conventional approaches.
2. Spatial Accessibility in Social Infrastructure Planning
Social infrastructure in the UK normally includes: healthcare, education, community facilities, emergency and other essential services. In order to ensure that these services are delivered effectively and comprehensively, social infrastructure should be well planned for new developments, regeneration and in rationalising the efficient use of available resources. Within a planning area, inequality in local social services is relative, as it is increased by imbalances in supply and demand across space. Thus relative spatial accessibility needs to be measured rather than in absolute terms. Meanwhile, social infrastructure planning in UK is mainly carried out at a local scale, for example by Local Authorities and Primary Care Trusts (PCTs - soon to be superseded by GP consortia). Details of spatial accessibility in relation to relevant social-economic variables are thus desirable by small area geography.
where people live and estimates the distance required to access their nearest facilities. Recently, considerable effort have been made on travel cost calculation in order to achieve accurate and comprehensive measures, which at the same time lead to more complex and less compatible approaches. Furthermore, the use of networks for either view requires assumptions to be made not only of travel speeds, but mode of travel as the available network may differ. Some inappropriate assumptions might result in a poor understanding of local accessibility. For example, a study of accessibility to health services in Liverpool was based on the public transport network, but a survey showed that only 19% respondents took public transport to visit a GP. Approaches based on these two views can be seen in various measures for catchment profiling, travel impedance modelling and gravity modelling (Guagliardo 2004, Liu & Zhu 2004).
In current research, spatial accessibility measurement has been improved significantly with increasing complex methods and growing amount of detailed information. However, challenges remain to establish robust and flexible approaches for various applications and rapid ‘what-if’ analyses, which can balance a range of factors. In this study, a new variable is developed to measure the spatial accessibility by small area geography for social infrastructure planning from the perspective of where people live. The new variable leads to less computational burden than network-based methods whilst correlates well with them. By using updated time series data, local organisations are able to monitor and analyse spatial accessibility locally in a timely manner.
3. Average Weighted Distance by Small Area Geography
A new variable – called average weighted distance (AWD) - is tested for measuring the relative inequalities in spatial accessibility to local social services/ facilities. It is based on the average distance of residents to a nearest facility by small area geography and further weighted by population distribution. No assumption is made for the new variable about travel mode. OA is chosen as the basic geographic unit, as it can be associated with many demographic and socio-economic variables.
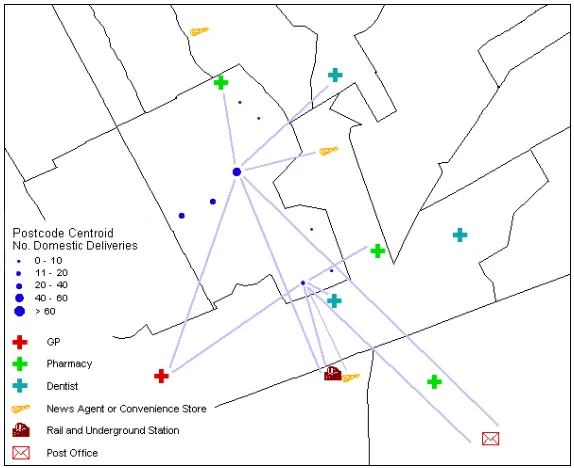
Population distribution can exert significant influence on spatial accessibility measures (Langford et al. 2008). However there is a lack of up-to-date inter-census information about population distribution by small area geography. For each postcode unit, OS CodePoint provides a geographic delivery centroid as well as the number of domestic deliveries. This is used as a proxy of population distribution within an OA.
AWD is developed to measure the relative spatial accessibility for social infrastructure planning. It intends to compare the ease of travel rather than the exact travel cost. For rapid appraisals, a measure with less computational load will be preferred, if it correlates well with more complex distance measures. In GIS there are three measures of distance that are readily computable: Euclidean, Manhattan and network distance. The network distance can be taken as is (network geometry), or further refined to reflect impedances such as speed limit, congestion level (attributed network). Our study shows very strong correlation between Euclidean and network distances at OA level for both urban and rural districts (see case studies below). Euclidean distance is therefore adopted for AWD. The general principle for AWD is expressed in equation (1). Fig. 1 illustrates how AWD is derived within an OA.
(
)
OA ddp P F P ddp F N D Wwhere:
= OA average weighted distance to a facility
= Euclidean distance from postcode centroid to nearest facility
[image:3.595.154.441.163.397.2]= weight equal to the number of domestic delivery points within each postcode = total number of domestic delivery points for the OA
Figure 1. Deriving AWD for an OA (boundaries and postcodes Crown Copyright).
4. Case Studies
Two case studies have been carried out to investigate the feasibility of the new approach. Two case study areas are selected: Haringey is an inner London borough with high density urban population and Uttlesford is a rural district with small towns and dispersed villages and hamlets. Pharmacies were selected as the facility for modelling accessibility. To avoid boundary problems in the calculations, a buffer area is included for both districts. OS Integrated Transport Network is used for the network.
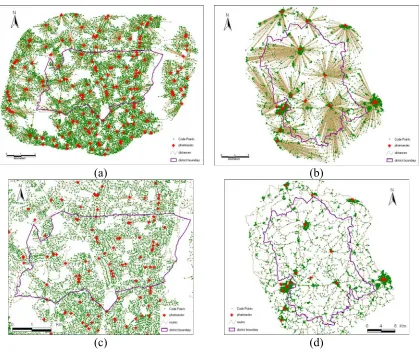
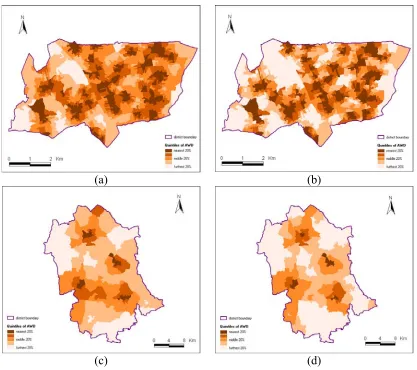
As illustrated in Fig. 2, Euclidean distances can be rapidly calculated using GIS whilst network distances need more editing and higher computational loads. The exact lengths are of course different for average weighted Euclidean and network distances. The median percentage difference is 28% (130m) for Haringey and 21% (670m) for Uttlesford. However, there are strong correlations between these two types of distance measures where coefficient is 0.936 for Haringey and 0.981 for Uttlesford (see Fig 3 for regression models). Such strong correlation supports the concept that AWD based on Euclidean distance can provide an acceptable relative measure, which aims to develop a straightforward measure for rapid assessments. A visual comparison of the results is given in Fig 4. This shows the relative inequalities in accessibility to a pharmacy. Thus if a local GP consortium wishes to evaluate filling the gaps in accessibility to commercial pharmacies, it can rapidly ‘what-if’ model additional pharmacies attached to existing surgeries.
F
OA
P F
D
P ddp
W
OA ddp
(a) (b)
[image:4.595.89.509.67.419.2](c) (d)
Figure 2. Distances from Code Points to nearest pharmacies (a) Euclidean distances for London Borough of Haringey, (b) Euclidean distances for Uttlesford District, (c) network distances for London Borough of Haringey, (d) network distances for Uttlesford District (data Crown Copyright).
Average weighted Euclidean distance400 600 800 1000 1200
200 0
Average
weight
ed
networ
k
distan
ce
2000
1500
1000
500
0
London Borough of Haringey
R Sq Linear = 0.859
Average weighted Euclidean distance4000 6000 8000 10000 12000
2000 0
Average
weight
ed
networ
k
distan
ce
12500.0
10000.0
7500.0
5000.0
2500.0
0.0
Uttlesford District
R Sq Linear = 0.964
(a) (b)
[image:4.595.79.521.515.707.2](a) (b)
[image:5.595.90.507.67.437.2](c) (d)
Figure 4. Patterns of local accessibility in quintiles (a) average weighted Euclidean distance for London Borough of Haringey, (b) average weighted network distance for London Borough of Haringey, (c) average weighted Euclidean distance for Uttlesford District, (d) average weighted network distance for Uttlesford District (boundaries Crown Copyright).
5. Conclusion
A new variable – AWD - is developed to measure and analyse spatial accessibility by small area geography. It will support rapid assessments of inequalities and ‘what-if’ analyses in local social infrastructure planning. The approach can use both Euclidean distance and network distance using postcode centroids as the atomic spatial unit. However, it is found that these two approaches have a high correlation and therefore similar patterns of relative inequality. The Euclidean distance approach has less computational load and is generally applicable, particularly where rapid ‘what-if’ analyses are required for decision support in a planning context. Local organisations are then able to interpret and further analyse relative local spatial accessibility for specific services/facilities as well as monitor changes in accessibility over time.
6. Acknowledgements
7. References
Chorley RJ and Haggett P, 1967, Models in Geography. Methuen, London.
Duckham M, Goodchild MF and Worboys MF, 2003, Foundations of Geographic Information Science. Taylor & Francis, London.
Guagliardo MF, 2004, Spatial accessibility of primary care: concepts, methods and challenges.
International Journal of Health Geographics, 3(1):1-13.
HUDU, 2007, Health and Urban Planning Toolkit. NHS Healthy Urban Development Unit, London. Langford M, Higgs G, Radcliffe J and White S, 2008, Urban population distribution models and
service accessibility estimation. Computers, Environment & Urban Systems, 32:66-80.
Liu S and Zhu X, 2004, Accessibility Analyst: an integrated GIS tool for accessibility analysis in urban transportation planning. Environment and Planning B: Planning and Design, 31: 105-124. Rosero-Bixby L, 2004, Spatial access to health care in Costa Rica and its equity: a GIS-based study.
Social Science & Medicine, 58:1271-1284.